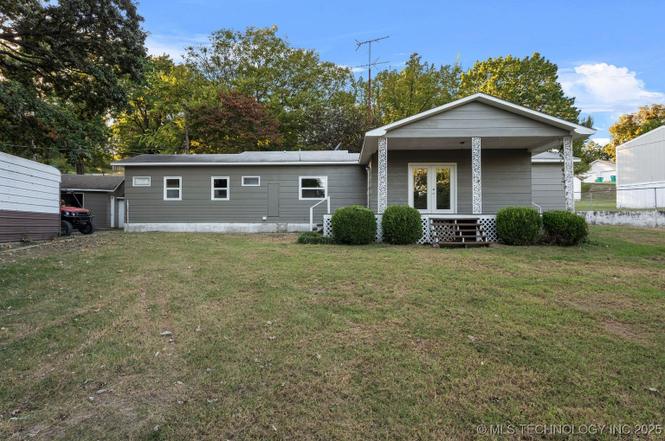
705 Chickasaw St · Bernice, OK
Flood risk 1/10 · Minimal
- FEMA flood zone
- X
- Chance of flooding over 30 yrs
- 0.0%
- Est. flood insurance / yr
- $435 – $905
Fire risk 2/10 · Minimal
- Est. fire insurance / yr
- $2,463 – $4,575
Heat risk 6/10 · Moderate
- Hot days now (above threshold)
- 7 days/yr
- Hot days in 30 yrs
- 21 days/yr
Wind risk No data
- Chance of severe wind over 30 yrs
- —
Air-quality risk No data
- Unhealthy air days now
- —
- Unhealthy air days in 30 yrs
- —
Risk factors via First Street. Map © Google.
Why this score? — see what drove the C grade
The composite is a weighted blend of 9 inputs, each scored 0–100. Each bar is that input's sub-score; the figure is the points it added to the 100-point composite (weight × sub-score).
- Cash flow +18.7/30.0
- Appreciation +10.0/10.0
- ARV discount +7.5/15.0
- DSCR +5.9/10.0
- 1% rule +3.8/10.0
- Livability +3.0/5.0
- Rent growth +2.5/5.0
- Condition / age +2.5/5.0
- Schools +1.4/10.0
$135,000
🖨 Deal sheet (PDF) 📄 Offer letter ✓ Due diligence
Listing remarks
Welcome to your Grand Lake getaway! This beautifully updated 3-bedroom, 2-bath home offers lake access and all the comforts of modern living. Fresh interior and exterior paint, newer flooring throughout, and a freshly finished deck make this home truly move-in ready. The open-concept layout creates a bright, inviting space perfect for entertaining or relaxing after a day on the water. The kitchen comes fully equipped, and all appliances stay! The primary suite provides a peaceful retreat, while two additional bedrooms offer flexibility for guests, a home office, or hobbies. Outside, you'll love the attached garage, large workshop, and extra storage building—ideal for lake
Key facts
- Attached garage
- Updated home
- Lake access
Tags
Property features AI
Exterior
- Parking: Detached garage; 2 garage spaces
- Security: Smoke detectors; No safety shelter
- Utilities: Electricity available; Public water; Septic tank sewer
- Home design: Single-story; Faces east; Slab foundation; Vinyl siding with wood frame construction; Asphalt/fiberglass roof
- Construction: Built (year per public records); Vinyl siding; Wood frame; Asphalt/fiberglass roof; Slab foundation
- Exterior features: Concrete driveway; Covered porch; Workshop; Partial fencing; Mature trees; Boat ramp/lift access (Grand Lake, less than 1 mile away)
Interior
- Kitchen: Dishwasher; Microwave; Oven; Range; Refrigerator; Electric water heater
- Flooring: Tile; Wood veneer
- Bathrooms: 2 full bathrooms
- Heating & cooling: Central heating (electric); Central air conditioning
- Interior features: Ceiling fans; Laminate countertops; Vinyl window frames; Electric oven and range connections; Disposal
- Laundry & utility: Washer hookup; Electric dryer hookup
Neighborhood map
What this means for you Summary
Snapshot
- This is a 3-bed/1.0-bath single-family listed at $135k.
Deal economics
- At list price, monthly cash flow is $133 ($2k/yr) — positive.
- The deal already cash-flows at list — no discount required.
- To meet the 1% rule (rent ≥ 1% of price), the offer needs to be $119k (11.9% below list).
- Recommended offer: $119k (11.9% below list) — sets the bar for 1% rule.
Location & tenants
- Location reads 60/100 on livability (#346 in OK) — a middle-class / working-renter tenant base. Strengths: cost of living A+, housing A+; Watch: amenities F, commute F, employment F.
- Afton (rural): math 16% / reading 18% proficiency, ranked #206 of 270 in OK (top 76%) — low school quality limits family demand, transient renter base, plan for 1-2y turnover; 76% free/reduced lunch — lower-income household profile, screen leases tightly.
- Zoned schools: Afton Es (math 17% / reading 17%, grade F, #540 of 845 statewide, top 68%, 305 students, 0% FRL); Afton Hs (math 15% / reading 15%, grade F, #323 of 447 statewide, top 74%, 172 students, 0% FRL) — zoned schools average 0% FRL vs 76% district-wide (76 pts lower); this property's tenant base skews higher-income than the district average.
- Market conditions: 150 active listings in the ZIP; 51 units permitted in Delaware County in 2024 (0 in 5+ unit buildings).
Forward outlook
- In year one you build about $14k of equity ($933 loan paydown + $14k appreciation (10.0% local appreciation)).
- Delaware County population projected to shrink 6% by 2050 — rents likely to lag national; underwrite the cash flow, not the appreciation.
- At projected returns (10.0% appreciation + 3.0% rent growth), your $38k cash investment doubles in ~3 years — after that, you're playing with house money.
- By year 3, paydown + projected appreciation supports a ~$37k cash-out refi (75% LTV) — recoverable capital for the next deal without selling this one.
Negotiation context
- It's been on market 114 days — a 9% lower offer ($123k) is reasonable based on typical stale-listing flexibility.
- 2 sale attempts; this cycle's ask has dropped $15k (10%) from the opening price — seller is motivated, your offer sets the floor, not the list.
- Current owner paid $36k; list at $135k implies a 275% gain — meaningful room to come down on a strong offer.
Risks & watch-outs
- Climate carrying-cost: extreme-heat days projected 7→21/yr by 2055 (HVAC capex compounding) — expect insurance premiums to compound above CPI over the hold.
Questions for the listing agent
- It's been on market 114 days. Have you received any prior offers? Is the seller open to a 12% concession, seller financing, or rate buy-down credit?
- Why hasn't it sold? Are there any deal-killer items the seller is aware of (foundation, flood, title, zoning, code violations)?
- Is there a deadline driving the sale (1031 exchange, divorce, estate, relocation)? That informs how much negotiation room exists.
- Schools are F-rated, which usually means shorter tenancies and higher turnover. Who's the typical renter profile here, and what's been the actual vacancy rate?
- What's the average days-on-market for RENTAL listings here right now (not sales)? A rising rental-DOM trend means longer vacancies and softer asking-rent achievability than the comps imply.
- What's the recent tenant-quality profile in this submarket — average credit score on applications, eviction rate, late-payment / NSF rate, and stable-employment percentage? A property-management company in the area should have these aggregated.
- How much new for-sale + rental construction is in the pipeline within 1–3 miles? Heavy new supply typically softens prices + rents 12–24 months out; constrained supply supports both.
Investment metrics
- 1% rule
- 0.88% ✗
- Cap rate
- 7.47%
- Cash-on-cash
- 4.21%
- DSCR
- 1.19
- GRM
- 9.5
CMA / ARV
No comps found within radius.
Projected returns pro-forma
10.0% appreciation · 3.0% rent growth · sell at horizon
- IRR
- 27.3%
- Equity multiple
- 3.17×
- Total profit
- $81,920
- Equity at exit
- $121,619
- IRR
- 23.8%
- Equity multiple
- 7.20×
- Total profit
- $234,472
- Equity at exit
- $262,275
Cash invested: $37,800 (down + closing). Projections, not guarantees.
Landlord ↔ Tenant lean methodology
- Overall (STATE)
- 83 Strongly Landlord-Friendly
- State Oklahoma
- 83 Strongly Landlord-Friendly · R+20
- County
- — inherits STATE
- City
- — inherits STATE
ZIP-level market 74331
- Home prices YoY
- 11.1%
- Active inventory
- 150
- Price-to-rent
- 9.5×
Monthly cashflow live
- Estimated rent
- $1,189 medium interval (Pro) →
- Mortgage (P&I)
- −$708
- Tax from tax record
- −$42 /mo · $506/yr
- Insurance
- −$56
- HOA
- −$0
- Vacancy / Maint / Mgmt
- −$250
- Net cashflow
- $133
Break-even live
Sensitivity live
| Price | -10% $209 | -5% $171 | +0% $133 | +5% $95 | +10% $56 |
|---|---|---|---|---|---|
| Rent | -10% $39 | -5% $86 | +0% $133 | +5% $180 | +10% $227 |
| Rate | -1.0pp $201 | -0.5pp $167 | base $133 | +0.5pp $98 | +1.0pp $62 |
UW: 25.0% down · 7.5% · 30yr · 1.5% tax · 5.0% vac · 8.0% maint · 8.0% mgmt
Financing live
Cash to close
- Down payment
- $33,750
- Closing costs
- $4,050
- Reserves months
- —
- Total cash needed
- —
Loan-product check · same deal, 3 products live
Conventional
25% down · 7.5% · 30yr
- Down + closing
- —
- Monthly P&I
- —
- Monthly cashflow
- —
- DSCR
- —
- Eligible?
- —
Personal DTI + credit; lowest rate.
DSCR
20% down · 8.5% · 30yr
- Down + closing
- —
- Monthly P&I
- —
- Monthly cashflow
- —
- DSCR
- —
- Eligible?
- —
No personal income docs; deal must DSCR.
Hard money
10% down · 12.0% · 12mo
- Down + closing
- —
- Monthly P&I
- —
- Monthly cashflow
- —
- DSCR
- —
- Eligible?
- —
Short-term bridge; refi at stabilization.
Listing history 22 events
-
2026-06-21days on market $135,000 Active 114 DOM
-
2026-06-21days on market $135,000 Active 113 DOM
-
2026-06-18days on market $135,000 Active 111 DOM
-
2026-06-17days on market $135,000 Active 110 DOM
-
2026-06-16days on market $135,000 Active 109 DOM
-
2026-06-15days on market $135,000 Active 108 DOM
-
2026-06-13days on market $135,000 Active 106 DOM
-
2026-06-12days on market $135,000 Active 105 DOM
-
2026-06-09days on market $135,000 Active 102 DOM
-
2026-06-08days on market $135,000 Active 101 DOM
-
2026-06-08days on market $135,000 Active 100 DOM
-
2026-06-05days on market $135,000 Active 98 DOM
-
2026-06-04days on market $135,000 Active 96 DOM
-
2026-06-02days on market $135,000 Active 95 DOM
-
2026-06-01days on market $135,000 Active 94 DOM
-
2026-05-31days on market $135,000 Active 93 DOM
-
2026-05-15price $135,000
-
2026-04-06status Active
-
2025-11-21status Pending
-
2025-11-10price $140,000
-
2025-10-14$150,000 Active
-
2008-07-15soldstatus $36,000
ⓘ Source: listings_history table (triggers on properties + properties_extension) + one-shot
backfill from property_details.listing_events for pre-trigger history.
Tax reassessment forecast OK · Resets to sale price
- Current annual tax
- $506 · $42/mo
- Projected year-2 tax
- $1,215 · $101/mo
- Expected delta
- +$709/yr (+$59/mo · 140.1%)
ⓘ Screening estimate from a state-policy table — verify with the county assessor before closing.
Climate risk First Street
- Flood 1/10 Low FEMA zone X · 0% chance over 30 yrs
- Wildfire 2/10 Low
- Heat 6/10 Major
Nearby sold comps map
Loading sold comps map…
Walkable amenities ~0.75 mi
Loading nearby amenities…
Taxation est. · year 1
- Rental income
- $14,265
- − Mortgage interest
- −$7,562
- − Property taxes
- −$506
- − Insurance
- −$675
- − Repairs & maintenance
- −$1,141
- − Management
- −$1,141
- − Depreciation
- −$3,927
- Taxable loss
- −$688
- Est. tax savings @ 24.0%
- +$165
- After-tax cash flow
- $1,758/yr
For passive investors: Depreciation is non-cash, so a rental often shows a tax loss while cash-flowing — sheltering income. Rental losses are passive: they offset passive income freely, and up to $25,000/yr can offset ordinary (W-2) income if you actively participate and your MAGI is under $100k (phasing out to $0 by $150k); unused losses carry forward. On sale, claimed depreciation is recaptured at up to 25%, and gains may owe capital-gains tax (a 1031 exchange can defer both). Figures are a year-1 estimate at your 24.0% rate — not tax advice; consult a CPA.
Schools (NCES district)
- District
- Afton
- NCES district ID
- 4002520
- Math proficiency
- 16% ▼ -8.00%
- Reading proficiency
- 18% ▼ -9.00%
- Median HH income
- $37,117
- Composite
- 14.19/100
- National rank
- #9453
- State rank
- #206 of 270 in OK
Livability — Bernice
- Score
- 60/100
- State rank
- #346
- US rank
- #18861
Category grades
Schools grade is shown separately in the Schools card above.
Census & demographics
- Census place
- Bernice, OK
- Population (ZIP)
- 7,110
Population outlook (Delaware County) Hauer SSP2
- Today (2025)
- 41,302 people
- By 2030
- 40,888 · -1.0%
- By 2040
- 39,802 · -3.6%
- By 2050
- 38,839 · -6.0%
- By 2075
- 37,438 · -9.4%
- By 2100
- 34,910 · -15.5%
Race, ethnicity, and origin ACS 2023
- Neighborhood character
- Predominantly White (71%)
- Race & ethnicity
- White 71% Native American 14% Two or more races 12% Hispanic / Latino 2%
- Common ancestry
- Italian 3% Slovak 2% Serbian 2%
- Foreign-born
- 1% · Canada
Political lean MEDSL · Delaware
- 2024 margin
- Solid R (+60.4) · D 19.2% · R 79.6% · Other 1.2%
- 2008→2024 swing
- -26.6pp toward R · 2008: -33.8pp · 2024: -60.4pp
- All cycles
- 2024: R+60.4 2020: R+58.5 2016: R+54.1 2012: R+41.3 2008: R+33.8
Not yet ingested
- Civics
- —
Market trends
- HPI YoY
- ▲ 32.91%
- Current HPI
- 329.9447
- Rent YoY
- —
- Metro
- —
- State GDP YoY
- ▲ 1.55%
- F500 in state
- 6
Industry mix (Fortune 500 HQ in OK)
| Industry | F500 HQs | Revenue |
|---|---|---|
| Energy | 3 | $48B |
|
||
Price history
+275.0% since first listed6 events — show timeline
- 2026-05-15 Price Changed $135,000 MLS Technology, Inc.
- 2026-04-06 Relisted — MLS Technology, Inc.
- 2025-11-21 Pending — MLS Technology, Inc.
- 2025-11-10 Price Changed $140,000 MLS Technology, Inc.
- 2025-10-14 Listed $150,000 MLS Technology, Inc.
- 2008-07-15 Sold (Public Records) $36,000 Public Records
Property tax history
+5.7%/yrLatest (2025): $506 · +4.1% YoY. Source: county tax records.
Cash-flow waterfall
monthlySold comps — $/sqft
last 12 mo · ≤1 miLoading sold comps…