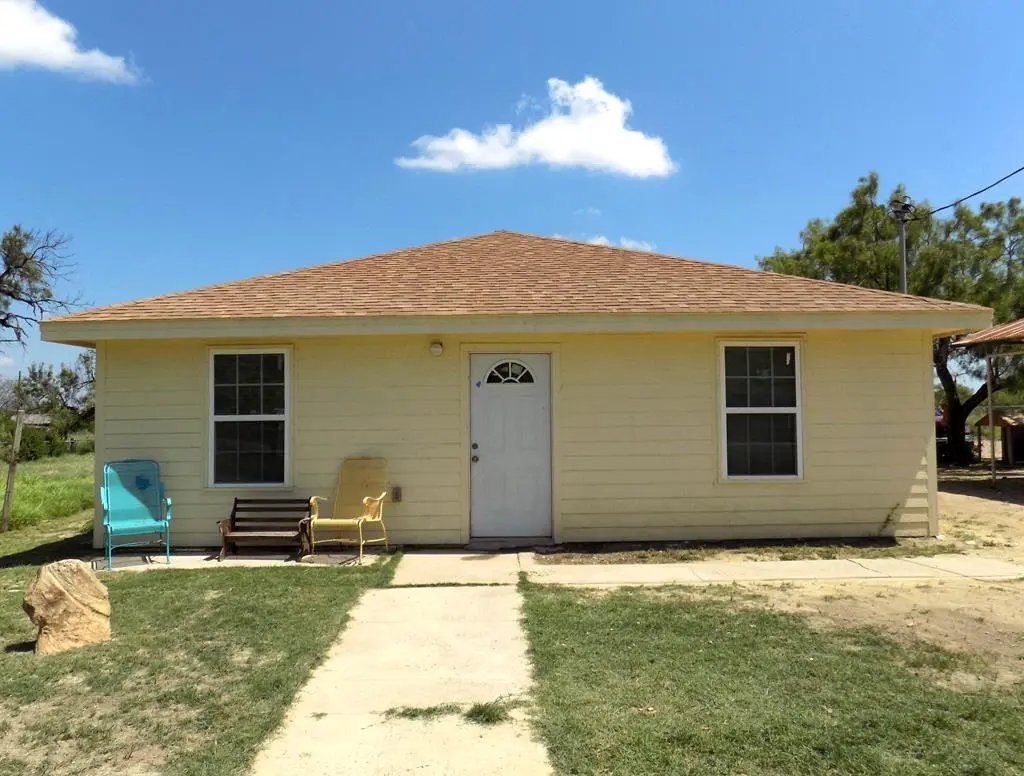
220 Calle Escuela · El Indio, TX
Flood risk 1/10 · Minimal
- FEMA flood zone
- X (unshaded)
- Chance of flooding over 30 yrs
- 0.0%
- Est. flood insurance / yr
- $507 – $1,088
Fire risk 3/10 · Minor
- Est. fire insurance / yr
- $1,222 – $2,270
Heat risk 8/10 · Major
- Hot days now (above 111°F)
- 5 days/yr
- Hot days in 30 yrs
- 17 days/yr
Wind risk 6/10 · Moderate
- Chance of severe wind over 30 yrs
- 27.0%
Air-quality risk 1/10 · Minimal
- Unhealthy air days now
- 0 days/yr
- Unhealthy air days in 30 yrs
- 0 days/yr
Risk factors via First Street. Map © Google.
Why this score? — see what drove the D grade
The composite is a weighted blend of 9 inputs, each scored 0–100. Each bar is that input's sub-score; the figure is the points it added to the 100-point composite (weight × sub-score).
- Cash flow +12.4/30.0
- ARV discount +7.5/15.0
- Appreciation +5.0/10.0
- DSCR +3.7/10.0
- 1% rule +3.4/10.0
- Rent growth +2.5/5.0
- Condition / age +2.2/5.0
- Schools +1.7/10.0
- Livability +1.7/5.0
$139,500
🖨 Deal sheet (PDF) 📄 Offer letter ✓ Due diligence
Listing remarks MLS
Original MLS#: 75047; Age Range: 0-5 Yrs; Appraisal District ID: 8400; Apx Bsmt SqFt: 0; Apx Lot Size SqFt: 15000.00; Dining: Hard Surface; Finished %: 90; Kitchen: Hard Surface, Electric; Lender: Fairway Mortgage; Living Room: Separate, Hard Surface; Loan Terms: 30 yr.; Qualify: No; Sold Type: In Office; Streets: All Weather; Utility: Elec Connect
Key facts
- Hard surface
- Fenced
- All weather
Tags
Property features AI
Exterior
- Utilities: City water; Septic system
- Home design: Single-family property
- Construction: Composition roof; Slab foundation
- Exterior features: Siding exterior; Lot approximately 100 x 140
Interior
- Kitchen: Stove/Range
- Bathrooms: 1 full bathroom
- Heating & cooling: Window air conditioner
- Interior features: Ceiling fans; Eat-in kitchen; Living area; Laundry room; Stove/Range
- Laundry & utility: In-home laundry room
Neighborhood map
What this means for you Summary
Snapshot
- This is a 3-bed/2.0-bath single-family listed at $140k. Condition is rated fair.
Deal economics
- At list price, monthly cash flow is $-23 ($-272/yr) — negative.
- To cash-flow at today's rent, offer at most $136k (2.9% below list).
- To meet the 1% rule (rent ≥ 1% of price), the offer needs to be $117k (15.9% below list).
- Recommended offer: $117k (15.9% below list) — sets the bar for 1% rule.
Location & tenants
- Location reads 33/100 on livability (#1,679 in TX) — a limited-amenity area; tenant pool skews transient or value-seeking. Strengths: cost of living A+, crime A; Watch: health & safety C-, amenities F, commute F.
- Eagle Pass ISD (town): math 15% / reading 28% proficiency, ranked #774 of 826 in TX (top 94%) — low school quality limits family demand, transient renter base, plan for 1-2y turnover.
- Zoned schools: Rosita Valley El (math 7% / reading 16%, grade F, #4,225 of 4,322 statewide, top 98%, 454 students, 94% FRL); Memorial J H (math 12% / reading 27%, grade F, #1,445 of 1,662 statewide, top 88%, 976 students, 90% FRL); C C Winn H S (math 16% / reading 40%, grade F, #1,170 of 1,632 statewide, top 72%, 2,001 students, 86% FRL) — zoned schools average 90% FRL vs 32% district-wide (58 pts higher); higher-poverty schools than district average — tighter screening recommended.
- Market conditions: 8 active listings in the ZIP; 66 units permitted in Maverick County in 2024 (0 in 5+ unit buildings).
Forward outlook
- In year one you build about $5k of equity ($964 loan paydown + $4k appreciation (3.0% local appreciation)).
- Maverick County population projected at +18% by 2050 — long-run rental-demand tailwind backs the buy-and-hold thesis.
- At projected returns (3.0% appreciation + 3.0% rent growth), your $39k cash investment doubles in ~7 years — after that, you're playing with house money.
- By year 7, paydown + projected appreciation supports a ~$33k cash-out refi (75% LTV) — recoverable capital for the next deal without selling this one.
Negotiation context
- Only 12 days on market — expect competitive offers; lowballing is unlikely to land.
- 2 sale attempts since 4y ago with the ask held roughly flat each time — persistent listings suggest the price (not the market) is what's stuck; bring a comps-based counter.
Risks & watch-outs
- Climate carrying-cost: major wind risk, 27% chance of damaging wind over 30y; extreme-heat days projected 5→17/yr by 2055 (HVAC capex compounding) — expect insurance premiums to compound above CPI over the hold.
Questions for the listing agent
- What do current leases actually rent for vs. the listed asking? Can we see a recent rent roll and the last 12 months of T-12 income?
- Have any recent inspections been done? Can we get a copy of the seller's disclosures and any deferred-maintenance estimates?
- Is there a deadline driving the sale (1031 exchange, divorce, estate, relocation)? That informs how much negotiation room exists.
- Schools are F-rated, which usually means shorter tenancies and higher turnover. Who's the typical renter profile here, and what's been the actual vacancy rate?
- The area grade is low — what's the realistic commute time and amenity access for the typical tenant pool here? Any planned neighborhood developments (good or bad) we should know about?
- What's the average days-on-market for RENTAL listings here right now (not sales)? A rising rental-DOM trend means longer vacancies and softer asking-rent achievability than the comps imply.
- What's the recent tenant-quality profile in this submarket — average credit score on applications, eviction rate, late-payment / NSF rate, and stable-employment percentage? A property-management company in the area should have these aggregated.
- How much new for-sale + rental construction is in the pipeline within 1–3 miles? Heavy new supply typically softens prices + rents 12–24 months out; constrained supply supports both.
Investment metrics
- 1% rule
- 0.84% ✗
- Cap rate
- 6.10%
- Cash-on-cash
- -0.70%
- DSCR
- 0.97
- GRM
- 9.9
CMA / ARV
No comps found within radius.
Projected returns pro-forma
3.0% appreciation · 3.0% rent growth · sell at horizon
- IRR
- 6.9%
- Equity multiple
- 1.39×
- Total profit
- $15,371
- Equity at exit
- $62,725
- IRR
- 9.7%
- Equity multiple
- 2.45×
- Total profit
- $56,775
- Equity at exit
- $96,667
Cash invested: $39,060 (down + closing). Projections, not guarantees.
Landlord ↔ Tenant lean methodology
- Overall (STATE)
- 87 Strongly Landlord-Friendly
- State Texas
- 87 Strongly Landlord-Friendly · R+5
- County
- — inherits STATE
- City
- — inherits STATE
ZIP-level market 78860
- Active inventory
- 8
- Price-to-rent
- 9.9×
Monthly cashflow live
- Estimated rent
- $1,173 medium interval (Pro) →
- Mortgage (P&I)
- −$732
- Tax from tax record
- −$160 /mo · $1,916/yr
- Insurance
- −$58
- HOA
- −$0
- Vacancy / Maint / Mgmt
- −$246
- Net cashflow
- $-23
Break-even live
Sensitivity live
| Price | -10% $56 | -5% $17 | +0% $-23 | +5% $-62 | +10% $-102 |
|---|---|---|---|---|---|
| Rent | -10% $-115 | -5% $-69 | +0% $-23 | +5% $24 | +10% $70 |
| Rate | -1.0pp $48 | -0.5pp $13 | base $-23 | +0.5pp $-59 | +1.0pp $-96 |
UW: 25.0% down · 7.5% · 30yr · 1.5% tax · 5.0% vac · 8.0% maint · 8.0% mgmt
Financing live
Cash to close
- Down payment
- $34,875
- Closing costs
- $4,185
- Reserves months
- —
- Total cash needed
- —
Loan-product check · same deal, 3 products live
Conventional
25% down · 7.5% · 30yr
- Down + closing
- —
- Monthly P&I
- —
- Monthly cashflow
- —
- DSCR
- —
- Eligible?
- —
Personal DTI + credit; lowest rate.
DSCR
20% down · 8.5% · 30yr
- Down + closing
- —
- Monthly P&I
- —
- Monthly cashflow
- —
- DSCR
- —
- Eligible?
- —
No personal income docs; deal must DSCR.
Hard money
10% down · 12.0% · 12mo
- Down + closing
- —
- Monthly P&I
- —
- Monthly cashflow
- —
- DSCR
- —
- Eligible?
- —
Short-term bridge; refi at stabilization.
Listing history 22 events
-
2026-06-21days on market $139,500 Active 12 DOM
-
2026-06-19days on market $139,500 Active 10 DOM
-
2026-06-18days on market $139,500 Active 9 DOM
-
2026-06-17days on market $139,500 Active 8 DOM
-
2026-06-16days on market $139,500 Active 7 DOM
-
2026-06-15days on market $139,500 Active 6 DOM
-
2026-06-14days on market $139,500 Active 4 DOM
-
2026-06-13days on market $139,500 Active 3 DOM
-
2026-06-10remarks 259-char remark
-
2026-06-10days on market $139,500 Active 1 DOM
-
2026-06-09days on market $139,500 Active 703 DOM
-
2026-06-08days on market $139,500 Active 702 DOM
-
2026-06-07days on market $139,500 Active 701 DOM
-
2026-06-05days on market $139,500 Active 698 DOM
-
2026-06-02days on market $139,500 Active 696 DOM
-
2026-06-01days on market $139,500 Active 695 DOM
-
2026-05-31days on market $139,500 Active 694 DOM
-
2026-05-30days on market $139,500 Active 693 DOM
-
2025-02-19price $139,500
-
2024-07-04$145,000 Active
-
2023-03-14soldstatus
Show marketing remark (350 chars)
Original MLS#: 75047; Age Range: 0-5 Yrs; Appraisal District ID: 8400; Apx Bsmt SqFt: 0; Apx Lot Size SqFt: 15000.00; Dining: Hard Surface; Finished %: 90; Kitchen: Hard Surface, Electric; Lender: Fairway Mortgage; Living Room: Separate, Hard Surface; Loan Terms: 30 yr.; Qualify: No; Sold Type: In Office; Streets: All Weather; Utility: Elec Connect
-
2022-12-26$120,000
Show marketing remark (350 chars)
Original MLS#: 75047; Age Range: 0-5 Yrs; Appraisal District ID: 8400; Apx Bsmt SqFt: 0; Apx Lot Size SqFt: 15000.00; Dining: Hard Surface; Finished %: 90; Kitchen: Hard Surface, Electric; Lender: Fairway Mortgage; Living Room: Separate, Hard Surface; Loan Terms: 30 yr.; Qualify: No; Sold Type: In Office; Streets: All Weather; Utility: Elec Connect
ⓘ Source: listings_history table (triggers on properties + properties_extension) + one-shot
backfill from property_details.listing_events for pre-trigger history.
Tax reassessment forecast TX · Resets to sale price
- Current annual tax
- $1,916 · $160/mo
- Projected year-2 tax
- $2,553 · $213/mo
- Expected delta
- +$637/yr (+$53/mo · 33.2%)
ⓘ Screening estimate from a state-policy table — verify with the county assessor before closing.
Climate risk First Street
- Flood 1/10 Low FEMA zone X (unshaded) · 0% chance over 30 yrs
- Wildfire 3/10 Moderate
- Heat 8/10 Severe 5 d/yr ≥111°F today · 17 d/yr by 30 yrs out
- Wind 6/10 Major 27% chance of damaging wind over 30 yrs
- Air quality 1/10 Low 0 unhealthy d/yr today · 0 by 30 yrs out
Nearby sold comps map
Loading sold comps map…
Walkable amenities ~0.75 mi
Loading nearby amenities…
Taxation est. · year 1
- Rental income
- $14,076
- − Mortgage interest
- −$7,814
- − Property taxes
- −$1,916
- − Insurance
- −$698
- − Repairs & maintenance
- −$1,126
- − Management
- −$1,126
- − Depreciation
- −$4,058
- Taxable loss
- −$2,662
- Est. tax savings @ 24.0%
- +$639
- After-tax cash flow
- $367/yr
For passive investors: Depreciation is non-cash, so a rental often shows a tax loss while cash-flowing — sheltering income. Rental losses are passive: they offset passive income freely, and up to $25,000/yr can offset ordinary (W-2) income if you actively participate and your MAGI is under $100k (phasing out to $0 by $150k); unused losses carry forward. On sale, claimed depreciation is recaptured at up to 25%, and gains may owe capital-gains tax (a 1031 exchange can defer both). Figures are a year-1 estimate at your 24.0% rate — not tax advice; consult a CPA.
Condition & rehab AI · 10 photos
The home requires a moderate level of renovation, focusing on updating the paint and HVAC system to improve its overall condition and value.
Repairs flagged
- Minor paint — faded paint in some areas
- Minor HVAC unit — visible but no signs of malfunction
Value-add opportunities
- Both paint job — Fresh paint can improve the home's appearance and value
- Both HVAC maintenance — A clean and functioning HVAC system is essential for comfort and energy efficiency
Renovation cost estimate screening
| Repair item | Severity | Est. cost |
|---|---|---|
| paint · faded paint in some areas | Minor | $500–3,000 |
| HVAC unit · visible but no signs of malfunction | Minor | $500–3,000 |
| Total estimated repair cost · 2 items | $1,000–6,000 |
Value-add ROI direction
- Both paint job — Fresh paint can improve the home's appearance and value ↑
- Both HVAC maintenance — A clean and functioning HVAC system is essential for comfort and energy efficiency ↑
ⓘ Cost ranges are severity-bucket heuristics (US national rule-of-thumb). Get contractor quotes + a written scope before underwriting a rehab budget.
Schools (NCES district)
- District
- Eagle Pass ISD
- NCES district ID
- 4817730
- Math proficiency
- 15% ▼ -41.00%
- Reading proficiency
- 28% ▼ -18.00%
- Median HH income
- $32,967
- Composite
- 17.48/100
- National rank
- #9057
- State rank
- #774 of 826 in TX
Livability — El Indio
- Score
- 33/100
- State rank
- #1679
- US rank
- #27811
Category grades
Schools grade is shown separately in the Schools card above.
Census & demographics
- Census place
- El Indio, TX
Population outlook (Maverick County) Hauer SSP2
- Today (2025)
- 62,919 people
- By 2030
- 65,440 · +4.0%
- By 2040
- 70,229 · +11.6%
- By 2050
- 74,218 · +18.0%
- By 2075
- 80,765 · +28.4%
- By 2100
- 76,268 · +21.2%
Not yet ingested
- Political lean
- —
- Race & ethnicity
- —
- Common origin
- —
- Civics
- —
Market trends
- HPI YoY
- —
- Current HPI
- —
- Rent YoY
- —
- Metro
- —
- State GDP YoY
- ▲ 3.95%
- F500 in state
- 110
Industry mix (Fortune 500 HQ in TX)
| Industry | F500 HQs | Revenue |
|---|---|---|
| Energy | 16 | $1,198B |
|
||
| Technology | 5 | $198B |
|
||
| Engineering / Construction | 4 | $72B |
|
||
| Energy Services | 3 | $60B |
|
||
| Utilities | 3 | $41B |
|
||
| Healthcare | 2 | $330B |
|
||
Price history
+16.2% since first listed3 events — show timeline
- 2024-07-04 Listed $139,500 LERA
- 2023-03-14 Sold (MLS) — LERA
- 2022-12-26 Listed $120,000 LERA
Property tax history
-1.1%/yrLatest (2025): $1,916 · -1.1% YoY. Source: county tax records.
Cash-flow waterfall
monthlySold comps — $/sqft
last 12 mo · ≤1 miLoading sold comps…