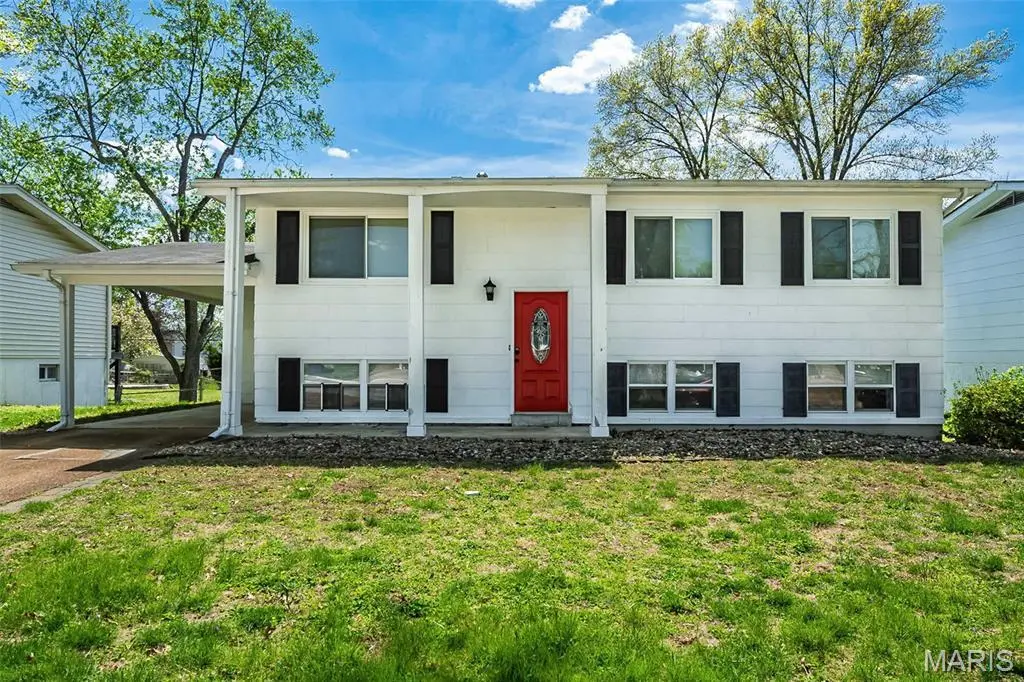
28 James Ct · Winchester, MO
Flood risk 1/10 · Minimal
- FEMA flood zone
- X (unshaded)
- Chance of flooding over 30 yrs
- 0.0%
- Est. flood insurance / yr
- $473 – $860
Fire risk 1/10 · Minimal
- Est. fire insurance / yr
- $1,054 – $1,958
Heat risk 5/10 · Moderate
- Hot days now (above 107°F)
- 7 days/yr
- Hot days in 30 yrs
- 20 days/yr
Wind risk 2/10 · Minimal
- Chance of severe wind over 30 yrs
- 1.0%
Air-quality risk 2/10 · Minimal
- Unhealthy air days now
- 1 days/yr
- Unhealthy air days in 30 yrs
- 1 days/yr
Risk factors via First Street. Map © Google.
Why this score? — see what drove the D grade
The composite is a weighted blend of 9 inputs, each scored 0–100. Each bar is that input's sub-score; the figure is the points it added to the 100-point composite (weight × sub-score).
- Cash flow +13.5/30.0
- ARV discount +6.2/15.0
- Schools +5.4/10.0
- DSCR +4.1/10.0
- Livability +3.7/5.0
- 1% rule +3.3/10.0
- Rent growth +3.0/5.0
- Condition / age +2.5/5.0
- Appreciation +0.0/10.0
$275,000
🖨 Deal sheet 📄 Offer letter ✓ Due diligence
Listing remarks
SUBJECT TO SHORT SALE APPROVAL. This split-level has been loved and well-maintained. Welcome to a great opportunity to own a home at this great value! Hardwood floors are featured on the main level. The LR/DR combo off the kitchen is perfect for entertaining. The composite deck is accessed right off the kitchen, overlooking the level, fenced-in backyard. The main bathroom on the first floor is nicely updated with a newer vanity, lighting, and more. Ceiling fans in bedrooms have been added. The lower level offers a recreation room, another bath plus a workout area. The seller has made numerous improvements since ownership, such as the following: Trane HVAC 2018; 200Amp Panel box 2025; Hot wa
Key facts
- 7,501 sq ft lot
- Parking
- Built 1968
Property features AI
Finance
- Other: Seller may consider concessions
- Financial info: Lease not considered; No second mortgage indicated
Exterior
- Parking: Carport with 1 space
- Utilities: Public water; Public sewer; Electric service (Ameren); Natural gas connected; Cable connected; Electricity connected; Sewer connected
- Home design: Single-family residence; Multi/split level
- Construction: Frame construction
- Exterior features: Level lot; Chain link fence
Interior
- Kitchen: Built-in gas range; Dishwasher; Garbage disposal
- Bedrooms: 3 bedrooms, all on the main level
- Flooring: Simulated wood
- Bathrooms: 2 full bathrooms; 1 half bathroom
- Heating & cooling: Forced air heating (natural gas); Central air conditioning
- Interior features: Partially finished basement with concrete floor, bathroom and storage space; Simulated wood flooring; Ceiling fans; Built-in gas range; Dishwasher; Disposal
- Laundry & utility: Basement utility / storage space
Neighborhood map
What this means for you Summary
Snapshot
- This is a 4-bed/1.5-bath single-family listed at $275k.
Deal economics
- At list price, monthly cash flow is $11 ($131/yr) — positive.
- The deal already cash-flows at list — no discount required.
- To meet the 1% rule (rent ≥ 1% of price), the offer needs to be $228k (17.2% below list).
- Recommended offer: $228k (17.2% below list) — sets the bar for 1% rule.
Location & tenants
- Location reads 73/100 on livability (#74 in MO) — a middle-class / working-renter tenant base. Strengths: crime A+, cost of living A+, housing A+; Watch: amenities D, commute F.
- Rockwood R-VI (suburban): math 51% / reading 64% proficiency, ranked #9 of 324 in MO (top 3%) — acceptable for families but not a draw, mixed tenant base, ~2y average lease; only 10% free/reduced lunch — higher-income household profile.
- Zoned schools: Ballwin Elem. (math 45% / reading 57%, grade C-, #273 of 1,115 statewide, top 25%, 434 students, 18% FRL); Marquette Sr. High (math 53% / reading 79%, grade B, #17 of 521 statewide, top 3%, 2,155 students, 13% FRL).
- Market conditions: Rents rising (+1.9%/yr); 241 active listings in the ZIP; 6 comparable units currently listed for rent nearby; rentals leasing fast (median 8d on market — plan ~1-2 weeks tenant-placement turnaround); high-income renter base; 920 units permitted in St. Louis County in 2024 (250 in 5+ unit buildings).
Forward outlook
- Local home prices are declining (-3.0%/yr); year-one equity from $2k of loan paydown is wiped out by about $8k of value loss. Plan a longer hold.
Negotiation context
- It's been on market 62 days — a 6% lower offer ($258k) is reasonable based on typical stale-listing flexibility.
- 2 sale attempts since 9y ago with the ask held roughly flat each time — persistent listings suggest the price (not the market) is what's stuck; bring a comps-based counter.
- Current owner paid $180k; list at $275k implies a 53% gain — meaningful room to come down on a strong offer.
Risks & watch-outs
- Climate carrying-cost: extreme-heat days projected 7→20/yr by 2055 (HVAC capex compounding) — expect insurance premiums to compound above CPI over the hold.
Questions for the listing agent
- It's been on market 62 days. Have you received any prior offers? Is the seller open to a 17% concession, seller financing, or rate buy-down credit?
- Built in 1968 — when were the roof, HVAC, electrical panel, plumbing, and water heater last replaced?
- Why hasn't it sold? Are there any deal-killer items the seller is aware of (foundation, flood, title, zoning, code violations)?
- Is there a deadline driving the sale (1031 exchange, divorce, estate, relocation)? That informs how much negotiation room exists.
- Schools are D-rated, which usually means shorter tenancies and higher turnover. Who's the typical renter profile here, and what's been the actual vacancy rate?
- The area grade is low — what's the realistic commute time and amenity access for the typical tenant pool here? Any planned neighborhood developments (good or bad) we should know about?
- What's the average days-on-market for RENTAL listings here right now (not sales)? A rising rental-DOM trend means longer vacancies and softer asking-rent achievability than the comps imply.
- What's the recent tenant-quality profile in this submarket — average credit score on applications, eviction rate, late-payment / NSF rate, and stable-employment percentage? A property-management company in the area should have these aggregated.
- How much new for-sale + rental construction is in the pipeline within 1–3 miles? Heavy new supply typically softens prices + rents 12–24 months out; constrained supply supports both.
Investment metrics
- 1% rule
- 0.83% ✗
- Cap rate
- 6.34%
- Cash-on-cash
- 0.17%
- DSCR
- 1.01
- GRM
- 10.1
CMA / ARV
- ARV (on-the-fly)
- $267,288
- Comps found
- 12
Show comp detail 12 sales within ~0.75 mi
| Address | Dist | Beds/Ba | Sqft | Sold | Price | $/sf | Match |
|---|---|---|---|---|---|---|---|
| 429 Fairview Ct | 0.11mi | 3/1.5 (-1) | 1,008 (-3%) | 2mo | $250,000 | $248 | 84 |
| 408 Saint Lawrence Dr | 0.47mi | 3/1.5 (-1) | 1,040 (+0%) | 2mo | $249,900 | $240 | 71 |
| 236 Ballwin Ave | 0.37mi | 3/1.0 (-1) | 1,050 (+1%) | 4mo | $245,000 | $233 | 70 |
| 73 Hillcrest Blvd | 0.20mi | 3/1.0 (-1) | 980 (-5%) | 8mo | $239,500 | $244 | 68 |
| 313 Saint Lawrence Dr | 0.36mi | 3/1.0 (-1) | 988 (-5%) | 2mo | $255,000 | $258 | 66 |
| 237 Chamberlin Dr | 0.39mi | 3/1.0 (-1) | 1,000 (-4%) | 8mo | $245,000 | $245 | 62 |
| 218 Robin Hill Ln | 0.27mi | 3/2.0 (-1) | 924 (-11%) | 1mo | $249,900 | $270 | 62 |
| 212 Lakeside Dr | 0.37mi | 3/1.0 (-1) | 950 (-8%) | 2mo | $245,000 | $258 | 60 |
| 407 Tulsa Ave | 0.56mi | 3/1.5 (-1) | 1,082 (+4%) | 3mo | $324,900 | $300 | 58 |
| 611 Sulphur Spring Rd | 0.64mi | 3/1.0 (-1) | 1,000 (-4%) | 8mo | $265,000 | $265 | 51 |
| 308 Spring Meadows Dr | 0.74mi | 3/2.0 (-1) | 1,078 (+4%) | 7mo | $265,000 | $246 | 46 |
| 408 Ballwin Ave | 0.53mi | 3/1.0 (-1) | 948 (-8%) | 10mo | $279,900 | $295 | 46 |
Match score weights: distance 35% · size 25% · config 20% · recency 20%. Top-matched comps best support the ARV.
Projected returns pro-forma
-3.0% appreciation · 1.94% rent growth · sell at horizon
- IRR
- -17.2%
- Equity multiple
- 0.40×
- Total profit
- $-46,303
- Equity at exit
- $41,003
- IRR
- -11.1%
- Equity multiple
- 0.36×
- Total profit
- $-49,216
- Equity at exit
- $23,777
Cash invested: $77,000 (down + closing). Projections, not guarantees.
Landlord ↔ Tenant lean methodology
- Overall (STATE)
- 81 Strongly Landlord-Friendly
- State Missouri
- 81 Strongly Landlord-Friendly · R+10
- County
- — inherits STATE
- City
- — inherits STATE
ZIP-level market 63021
- Rents YoY
- 1.9%
- Active inventory
- 241
- Price-to-rent
- 10.1×
Monthly cashflow live
- Estimated rent
- $2,277 high interval (Pro) →
- Mortgage (P&I)
- −$1,442
- Tax from tax record
- −$231 /mo · $2,770/yr
- Insurance
- −$115
- HOA
- −$0
- Vacancy / Maint / Mgmt
- −$478
- Net cashflow
- $11
Break-even live
UW: 25.0% down · 7.5% · 30yr · 1.5% tax · 5.0% vac · 8.0% maint · 8.0% mgmt
Financing live
Cash to close
- Down payment
- $68,750
- Closing costs
- $8,250
- Reserves months
- —
- Total cash needed
- —
Loan-product check · same deal, 3 products live
Conventional
25% down · 7.5% · 30yr
- Down + closing
- —
- Monthly P&I
- —
- Monthly cashflow
- —
- DSCR
- —
- Eligible?
- —
Personal DTI + credit; lowest rate.
DSCR
20% down · 8.5% · 30yr
- Down + closing
- —
- Monthly P&I
- —
- Monthly cashflow
- —
- DSCR
- —
- Eligible?
- —
No personal income docs; deal must DSCR.
Hard money
10% down · 12.0% · 12mo
- Down + closing
- —
- Monthly P&I
- —
- Monthly cashflow
- —
- DSCR
- —
- Eligible?
- —
Short-term bridge; refi at stabilization.
Rent comps 6 comps
| Address | Beds | Baths | Sqft | Rent | $/sqft | DOM | Units | Dist |
|---|---|---|---|---|---|---|---|---|
| 284 Ramsey Ln Ballwin, MO | 4.0 | 1.0 | 1296 | $2,300 | $1.77 | 14d | 1 | 0.69mi |
| 302 Brightsand Ct Manchester, MO | 3.0 | 2.0 | 1248 | $2,000 | $1.60 | 1d | 1 | 0.71mi |
| 608 Connie Ln Manchester, MO | 3.0 | 1.5 | 1189 | $1,995 | $1.68 | 7d | 1 | 0.80mi |
| 170 Steamboat Ln Ballwin, MO | 1.0–3.0 | 1.0–2.5 | 1177 | $2,302 | $1.95 | 1d | 10 | 1.22mi |
| 455 Down Hill Dr Ballwin, MO | 3.0 | 2.0 | 1092 | $1,926 | $1.76 | 1d | 1 | 1.31mi |
| 424 Harvest Hill Ct Ballwin, MO | 4.0 | 3.0 | 1307 | $2,880 | $2.20 | 43d | 1 | 1.40mi |
Listing history 16 events
-
2026-06-13statusdays on market $275,000 Pending 62 DOM
-
2026-06-09days on market $275,000 Active Under Contract 61 DOM
-
2026-06-08days on market $275,000 Active Under Contract 60 DOM
-
2026-06-07days on market $275,000 Active Under Contract 59 DOM
-
2026-06-03days on market $275,000 Active Under Contract 55 DOM
-
2026-06-02days on market $275,000 Active Under Contract 54 DOM
-
2026-06-01days on market $275,000 Active Under Contract 53 DOM
-
2026-05-31days on market $275,000 Active Under Contract 52 DOM
-
2026-04-16historical Active Under Contract
-
2026-04-10$275,000 Active
-
2026-04-09historical $275,000
-
2017-05-31soldstatus $180,000
-
2017-05-25soldstatus Closed
-
2017-04-04status Pending
-
2017-03-28$190,000 Active
-
2009-09-11soldstatus $132,500
ⓘ Source: listings_history table (triggers on properties + properties_extension) + one-shot
backfill from property_details.listing_events for pre-trigger history.
Tax reassessment forecast MO · Resets to sale price
- Current annual tax
- $2,770 · $231/mo
- Projected year-2 tax
- $2,770 · $231/mo
- Expected delta
- $0/yr ($0/mo · -0.0%)
ⓘ Screening estimate from a state-policy table — verify with the county assessor before closing.
Climate risk First Street
- Flood 1/10 Low FEMA zone X (unshaded) · 0% chance over 30 yrs
- Wildfire 1/10 Low
- Heat 5/10 Major 7 d/yr ≥107°F today · 20 d/yr by 30 yrs out
- Wind 2/10 Low 100% chance of damaging wind over 30 yrs
- Air quality 2/10 Low 1 unhealthy d/yr today · 1 by 30 yrs out
Nearby sold comps map
Loading sold comps map…
Walkable amenities ~0.75 mi
Loading nearby amenities…
Taxation est. · year 1
- Rental income
- $27,319
- − Mortgage interest
- −$15,404
- − Property taxes
- −$2,770
- − Insurance
- −$1,375
- − Repairs & maintenance
- −$2,186
- − Management
- −$2,186
- − Depreciation
- −$8,000
- Taxable loss
- −$4,601
- Est. tax savings @ 24.0%
- +$1,104
- After-tax cash flow
- $1,236/yr
For passive investors: Depreciation is non-cash, so a rental often shows a tax loss while cash-flowing — sheltering income. Rental losses are passive: they offset passive income freely, and up to $25,000/yr can offset ordinary (W-2) income if you actively participate and your MAGI is under $100k (phasing out to $0 by $150k); unused losses carry forward. On sale, claimed depreciation is recaptured at up to 25%, and gains may owe capital-gains tax (a 1031 exchange can defer both). Figures are a year-1 estimate at your 24.0% rate — not tax advice; consult a CPA.
Schools (NCES district)
- District
- Rockwood R-VI
- NCES district ID
- 2926850
- Math proficiency
- 51% ▼ -7.00%
- Reading proficiency
- 64% ▼ -2.00%
- Median HH income
- $98,721
- Composite
- 53.61/100
- National rank
- #1438
- State rank
- #9 of 324 in MO
Livability — Winchester
- Score
- 73/100
- State rank
- #74
- US rank
- #5099
Category grades
Schools grade is shown separately in the Schools card above.
Census & demographics
- Census place
- Winchester, MO
- County
- Saint Louis County · 888,823 people
- City population
- 91,586
- Metro
- St. Louis, MO-IL
- Population (ZIP)
- 55,666
- Household income
- $120,177
- Rent vs Own
- Severe rent burden
- 932.0
Population outlook (St. Louis County) Hauer SSP2
- Today (2025)
- 1,025,227 people
- By 2030
- 1,028,023 · +0.3%
- By 2040
- 1,020,940 · -0.4%
- By 2050
- 1,007,280 · -1.8%
- By 2075
- 987,277 · -3.7%
- By 2100
- 921,984 · -10.1%
Race, ethnicity, and origin ACS 2023
- Neighborhood character
- Predominantly White (76%)
- Race & ethnicity
- White 76% Asian 10% Two or more races 9% Hispanic / Latino 5% Black 3%
- Hispanic origin (detail)
- Mexican 4%
- Common ancestry
- Lithuanian 3% Romanian 2% Italian 2%
- Foreign-born
- 11% · Canada, China, South Korea
- Languages at home
- 85% English-only · Other Indo-European 4% Spanish 3% Other Asian/Pacific 2%
Political lean MEDSL · St. Louis
- 2024 margin
- Strong D (+23.4) · D 60.8% · R 37.4% · Other 1.7%
- 2008→2024 swing
- +3.5pp toward D · 2008: 19.9pp · 2024: 23.4pp
- All cycles
- 2024: D+23.4 2020: D+24.0 2016: D+16.2 2012: D+13.7 2008: D+19.9
Not yet ingested
- Civics
- —
Market trends
- HPI YoY
- ▼ -209.71%
- Current HPI
- 221.4498
- Rent YoY
- ▲ 1.94%
- Metro
- St. Louis, MO-IL
- State GDP YoY
- ▲ 1.84%
- F500 in state
- 20
Industry mix (Fortune 500 HQ in MO)
| Industry | F500 HQs | Revenue |
|---|---|---|
| Healthcare | 1 | $163B |
|
||
| Insurance | 1 | $21B |
|
||
| Industrial Technology | 1 | $17B |
|
||
| Retail | 1 | $16B |
|
||
| Industrial Distribution | 1 | $10B |
|
||
| Utilities | 1 | $9B |
|
||
Price history
+107.5% since first listed8 events — show timeline
- 2026-04-16 Contingent — MARIS as Distributed by MLS Grid
- 2026-04-10 Listed $275,000 MARIS as Distributed by MLS Grid
- 2026-04-09 Coming Soon $275,000 MARIS as Distributed by MLS Grid
- 2017-05-31 Sold (Public Records) $180,000 Public Records
- 2017-05-25 Sold (MLS) — MARIS as Distributed by MLS Grid
- 2017-04-04 Pending — MARIS as Distributed by MLS Grid
- 2017-03-28 Listed $190,000 MARIS as Distributed by MLS Grid
- 2009-09-11 Sold (Public Records) $132,500 Public Records
Property tax history
+5.7%/yrLatest (2022): $2,770 · +0.7% YoY. Source: county tax records.
Cash-flow waterfall
monthlySold comps — $/sqft
last 12 mo · ≤1 miLoading sold comps…