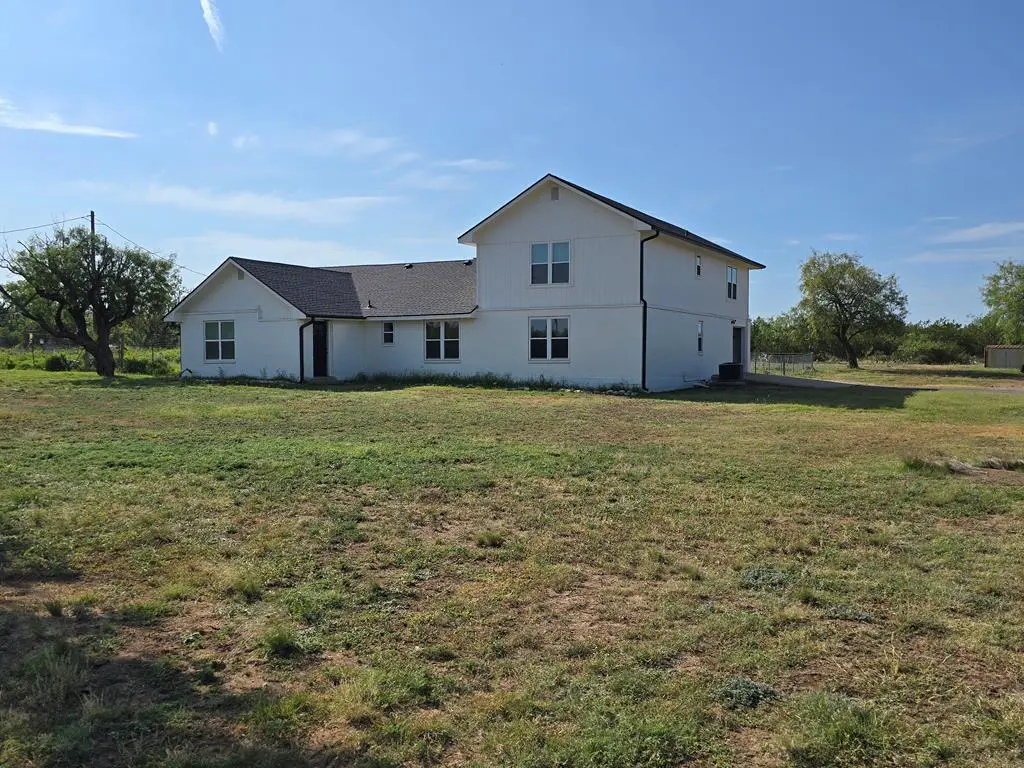
7777 W Rollin Acres Rd · Grape Creek, TX
Flood risk 1/10 · Minimal
- FEMA flood zone
- X (unshaded)
- Chance of flooding over 30 yrs
- 0.0%
- Est. flood insurance / yr
- $507 – $1,088
Fire risk 8/10 · Major
- Est. fire insurance / yr
- $1,222 – $2,270
Heat risk 6/10 · Moderate
- Hot days now (above 103°F)
- 7 days/yr
- Hot days in 30 yrs
- 21 days/yr
Wind risk 4/10 · Minor
- Chance of severe wind over 30 yrs
- 17.0%
Air-quality risk 2/10 · Minimal
- Unhealthy air days now
- 0 days/yr
- Unhealthy air days in 30 yrs
- 1 days/yr
Risk factors via First Street. Map © Google.
Why this score? — see what drove the F grade
The composite is a weighted blend of 9 inputs, each scored 0–100. Each bar is that input's sub-score; the figure is the points it added to the 100-point composite (weight × sub-score).
- Appreciation +10.0/10.0
- ARV discount +7.5/15.0
- Cash flow +4.9/30.0
- Rent growth +3.9/5.0
- Livability +3.4/5.0
- Condition / age +2.5/5.0
- Schools +2.4/10.0
- 1% rule +0.3/10.0
- DSCR +0.0/10.0
$365,000
🖨 Deal sheet (PDF) 📄 Offer letter ✓ Due diligence
Listing remarks MLS
HUGE Price Change. Take a look. This is a great 10+ acre property. It has partially been redone inside, but needs to be finished. The possibilities are endless. Huge den, office and extra room upstairs as well as a half bath. There are 2 large shipping containers with a carport between them. Many amenities. Take a look and see if this can be your next homestead. All carpet has been removed. Some vinyl flooring and some laminate. 4th bedroom is upstairs.
Key facts
- 10.34 acre lot
- 2 garage spots
- Built 1980
Neighborhood map
What this means for you Summary
Snapshot
- This is a 4-bed/2.0-bath single-family listed at $365k.
Deal economics
- At list price, monthly cash flow is $-870 ($-10k/yr) — negative.
- To cash-flow at today's rent, offer at most $211k (42.1% below list).
- To meet the 1% rule (rent ≥ 1% of price), the offer needs to be $194k (46.8% below list).
- Recommended offer: $194k (46.8% below list) — sets the bar for 1% rule.
- Cap rate 3.4% vs local median 2.6% in Grape Creek — top-decile yield for the area; either an underpriced asset or a hidden risk that comps aren't pricing in. Stress-test before assuming the spread holds.
Location & tenants
- Location reads 67/100 on livability (#545 in TX) — a middle-class / working-renter tenant base. Strengths: cost of living A+, housing A+, crime B; Watch: health & safety C-, amenities F, commute F.
- Grape Creek ISD (rural): math 25% / reading 29% proficiency, ranked #675 of 826 in TX (top 82%) — low school quality limits family demand, transient renter base, plan for 1-2y turnover.
- Zoned schools: Grape Creek Pri (316 students, 74% FRL); Grape Creek Middle (math 18% / reading 26%, grade F, #1,360 of 1,662 statewide, top 83%, 270 students, 60% FRL); Grape Creek H S (math 27% / reading 37%, grade F, #1,044 of 1,632 statewide, top 66%, 308 students, 63% FRL).
- Market conditions: Rents rising fast (+5.8%/yr); 334 active listings in the ZIP; 233 units permitted in Tom Green County in 2024 (0 in 5+ unit buildings).
- This rent runs 34% of the median local income ($69k/yr) — at the standard rent-burdened threshold; future hikes will face affordability resistance.
Forward outlook
- In year one you build about $39k of equity ($3k loan paydown + $36k appreciation (10.0% local appreciation)).
- Tom Green County population projected at +35% by 2050 — long-run rental-demand tailwind backs the buy-and-hold thesis.
- By year 2, paydown + projected appreciation supports a ~$63k cash-out refi (75% LTV) — recoverable capital for the next deal without selling this one.
Negotiation context
- It's been on market 289 days — a 12% lower offer ($321k) is reasonable based on typical stale-listing flexibility.
- 2 sale attempts; this cycle's ask has dropped $135k (27%) from the opening price — seller is motivated, your offer sets the floor, not the list.
Risks & watch-outs
- Climate carrying-cost: severe wildfire risk; extreme-heat days projected 7→21/yr by 2055 (HVAC capex compounding) — expect insurance premiums to compound above CPI over the hold.
Questions for the listing agent
- What do current leases actually rent for vs. the listed asking? Can we see a recent rent roll and the last 12 months of T-12 income?
- It's been on market 289 days. Have you received any prior offers? Is the seller open to a 47% concession, seller financing, or rate buy-down credit?
- Why hasn't it sold? Are there any deal-killer items the seller is aware of (foundation, flood, title, zoning, code violations)?
- Is there a deadline driving the sale (1031 exchange, divorce, estate, relocation)? That informs how much negotiation room exists.
- Schools are F-rated, which usually means shorter tenancies and higher turnover. Who's the typical renter profile here, and what's been the actual vacancy rate?
- The area grade is low — what's the realistic commute time and amenity access for the typical tenant pool here? Any planned neighborhood developments (good or bad) we should know about?
- What's the average days-on-market for RENTAL listings here right now (not sales)? A rising rental-DOM trend means longer vacancies and softer asking-rent achievability than the comps imply.
- What's the recent tenant-quality profile in this submarket — average credit score on applications, eviction rate, late-payment / NSF rate, and stable-employment percentage? A property-management company in the area should have these aggregated.
- How much new for-sale + rental construction is in the pipeline within 1–3 miles? Heavy new supply typically softens prices + rents 12–24 months out; constrained supply supports both.
Investment metrics
- 1% rule
- 0.53% ✗
- Cap rate
- 3.43%
- Cash-on-cash
- -10.22%
- DSCR
- 0.55
- GRM
- 15.7
CMA / ARV
- ARV (median comp)
- $802,331
- List price
- $365,000
- Delta
- -54.51%
- Verdict
- UNDERPRICED
- Comps
- 2 within 1.0 mi
Projected returns pro-forma
10.0% appreciation · 5.78% rent growth · sell at horizon
- IRR
- 17.7%
- Equity multiple
- 2.46×
- Total profit
- $148,895
- Equity at exit
- $328,821
- IRR
- 17.1%
- Equity multiple
- 5.84×
- Total profit
- $494,649
- Equity at exit
- $709,115
Cash invested: $102,200 (down + closing). Projections, not guarantees.
Landlord ↔ Tenant lean methodology
- Overall (STATE)
- 87 Strongly Landlord-Friendly
- State Texas
- 87 Strongly Landlord-Friendly · R+5
- County
- — inherits STATE
- City
- — inherits STATE
ZIP-level market 76901
- Home prices YoY
- 6.4%
- Rents YoY
- 5.8%
- Active inventory
- 334
- Price-to-rent
- 15.7×
Monthly cashflow live
- Estimated rent
- $1,942 medium interval (Pro) →
- Mortgage (P&I)
- −$1,914
- Tax from tax record
- −$338 /mo · $4,055/yr
- Insurance
- −$152
- HOA
- −$0
- Vacancy / Maint / Mgmt
- −$408
- Net cashflow
- $-870
Break-even live
Sensitivity live
| Price | -10% $-664 | -5% $-767 | +0% $-870 | +5% $-974 | +10% $-1,077 |
|---|---|---|---|---|---|
| Rent | -10% $-1,024 | -5% $-947 | +0% $-870 | +5% $-794 | +10% $-717 |
| Rate | -1.0pp $-687 | -0.5pp $-777 | base $-870 | +0.5pp $-965 | +1.0pp $-1,061 |
UW: 25.0% down · 7.5% · 30yr · 1.5% tax · 5.0% vac · 8.0% maint · 8.0% mgmt
Financing live
Cash to close
- Down payment
- $91,250
- Closing costs
- $10,950
- Reserves months
- —
- Total cash needed
- —
Loan-product check · same deal, 3 products live
Conventional
25% down · 7.5% · 30yr
- Down + closing
- —
- Monthly P&I
- —
- Monthly cashflow
- —
- DSCR
- —
- Eligible?
- —
Personal DTI + credit; lowest rate.
DSCR
20% down · 8.5% · 30yr
- Down + closing
- —
- Monthly P&I
- —
- Monthly cashflow
- —
- DSCR
- —
- Eligible?
- —
No personal income docs; deal must DSCR.
Hard money
10% down · 12.0% · 12mo
- Down + closing
- —
- Monthly P&I
- —
- Monthly cashflow
- —
- DSCR
- —
- Eligible?
- —
Short-term bridge; refi at stabilization.
Listing history 12 events
-
2026-06-05statusdays on market $365,000 Pending 289 DOM
-
2026-06-03days on market $365,000 Active 288 DOM
-
2026-06-02days on market $365,000 Active 287 DOM
-
2026-06-01days on market $365,000 Active 286 DOM
-
2026-05-31days on market $365,000 Active 285 DOM
-
2026-05-30days on market $365,000 Active 284 DOM
-
2026-04-26price $365,000 457-char remark
Show marketing remark (457 chars)
HUGE Price Change. Take a look. This is a great 10+ acre property. It has partially been redone inside, but needs to be finished. The possibilities are endless. Huge den, office and extra room upstairs as well as a half bath. There are 2 large shipping containers with a carport between them. Many amenities. Take a look and see if this can be your next homestead. All carpet has been removed. Some vinyl flooring and some laminate. 4th bedroom is upstairs.
-
2026-02-12price $380,000 457-char remark
Show marketing remark (457 chars)
HUGE Price Change. Take a look. This is a great 10+ acre property. It has partially been redone inside, but needs to be finished. The possibilities are endless. Huge den, office and extra room upstairs as well as a half bath. There are 2 large shipping containers with a carport between them. Many amenities. Take a look and see if this can be your next homestead. All carpet has been removed. Some vinyl flooring and some laminate. 4th bedroom is upstairs.
-
2026-02-05status Active 457-char remark
Show marketing remark (457 chars)
HUGE Price Change. Take a look. This is a great 10+ acre property. It has partially been redone inside, but needs to be finished. The possibilities are endless. Huge den, office and extra room upstairs as well as a half bath. There are 2 large shipping containers with a carport between them. Many amenities. Take a look and see if this can be your next homestead. All carpet has been removed. Some vinyl flooring and some laminate. 4th bedroom is upstairs.
-
2026-01-08price $425,000 457-char remark
Show marketing remark (457 chars)
HUGE Price Change. Take a look. This is a great 10+ acre property. It has partially been redone inside, but needs to be finished. The possibilities are endless. Huge den, office and extra room upstairs as well as a half bath. There are 2 large shipping containers with a carport between them. Many amenities. Take a look and see if this can be your next homestead. All carpet has been removed. Some vinyl flooring and some laminate. 4th bedroom is upstairs.
-
2025-08-20$499,900 Active 457-char remark
Show marketing remark (457 chars)
HUGE Price Change. Take a look. This is a great 10+ acre property. It has partially been redone inside, but needs to be finished. The possibilities are endless. Huge den, office and extra room upstairs as well as a half bath. There are 2 large shipping containers with a carport between them. Many amenities. Take a look and see if this can be your next homestead. All carpet has been removed. Some vinyl flooring and some laminate. 4th bedroom is upstairs.
-
2018-01-30soldstatus
ⓘ Source: listings_history table (triggers on properties + properties_extension) + one-shot
backfill from property_details.listing_events for pre-trigger history.
Tax reassessment forecast TX · Resets to sale price
- Current annual tax
- $4,055 · $338/mo
- Projected year-2 tax
- $6,680 · $557/mo
- Expected delta
- +$2,624/yr (+$219/mo · 64.7%)
ⓘ Screening estimate from a state-policy table — verify with the county assessor before closing.
Climate risk First Street
- Flood 1/10 Low FEMA zone X (unshaded) · 0% chance over 30 yrs
- Wildfire 8/10 Severe
- Heat 6/10 Major 7 d/yr ≥103°F today · 21 d/yr by 30 yrs out
- Wind 4/10 Moderate 17% chance of damaging wind over 30 yrs
- Air quality 2/10 Low 0 unhealthy d/yr today · 1 by 30 yrs out
Nearby sold comps map
Loading sold comps map…
Walkable amenities ~0.75 mi
Loading nearby amenities…
Taxation est. · year 1
- Rental income
- $23,298
- − Mortgage interest
- −$20,446
- − Property taxes
- −$4,055
- − Insurance
- −$1,825
- − Repairs & maintenance
- −$1,864
- − Management
- −$1,864
- − Depreciation
- −$10,618
- Taxable loss
- −$17,374
- Est. tax savings @ 24.0%
- +$4,170
- After-tax cash flow
- $-6,274/yr
For passive investors: Depreciation is non-cash, so a rental often shows a tax loss while cash-flowing — sheltering income. Rental losses are passive: they offset passive income freely, and up to $25,000/yr can offset ordinary (W-2) income if you actively participate and your MAGI is under $100k (phasing out to $0 by $150k); unused losses carry forward. On sale, claimed depreciation is recaptured at up to 25%, and gains may owe capital-gains tax (a 1031 exchange can defer both). Figures are a year-1 estimate at your 24.0% rate — not tax advice; consult a CPA.
Schools (NCES district)
- District
- Grape Creek ISD
- NCES district ID
- 4821600
- Math proficiency
- 25% ▼ -12.00%
- Reading proficiency
- 29% ▲ 1.00%
- Median HH income
- $48,891
- Composite
- 23.6/100
- National rank
- #7849
- State rank
- #675 of 826 in TX
Livability — Grape Creek
- Score
- 67/100
- State rank
- #545
- US rank
- #10581
Category grades
Schools grade is shown separately in the Schools card above.
Census & demographics
- County
- Tom Green County · 113,188 people
- Metro
- San Angelo, TX
- Population (ZIP)
- 31,831
- Household income
- $69,450
- Rent vs Own
- Severe rent burden
- 1034.0
Population outlook (Tom Green County) Hauer SSP2
- Today (2025)
- 135,110 people
- By 2030
- 144,090 · +6.6%
- By 2040
- 162,561 · +20.3%
- By 2050
- 182,158 · +34.8%
- By 2075
- 232,274 · +71.9%
- By 2100
- 268,218 · +98.5%
Race, ethnicity, and origin ACS 2023
- Neighborhood character
- Majority White (55%)
- Race & ethnicity
- White 55% Hispanic / Latino 41% Two or more races 17% Black 2%
- Hispanic origin (detail)
- Mexican 38%
- Common ancestry
- Lithuanian 3% Slovak 3% Iranian 1%
- Foreign-born
- 5% · Canada
- Languages at home
- 77% English-only · Spanish 21% German/W. Germanic 1%
Political lean MEDSL · Tom Green
- 2024 margin
- Solid R (+48.0) · D 25.5% · R 73.5% · Other 1.0%
- 2008→2024 swing
- -6.3pp toward R · 2008: -41.7pp · 2024: -48.0pp
- All cycles
- 2024: R+48.0 2020: R+44.4 2016: R+47.9 2012: R+47.9 2008: R+41.7
Not yet ingested
- Civics
- —
Market trends
- HPI YoY
- ▲ 47.96%
- Current HPI
- 798.58
- Rent YoY
- ▲ 5.78%
- Metro
- San Angelo, TX
- State GDP YoY
- ▲ 3.95%
- F500 in state
- 110
Industry mix (Fortune 500 HQ in TX)
| Industry | F500 HQs | Revenue |
|---|---|---|
| Energy | 16 | $1,198B |
|
||
| Technology | 5 | $198B |
|
||
| Engineering / Construction | 4 | $72B |
|
||
| Energy Services | 3 | $60B |
|
||
| Utilities | 3 | $41B |
|
||
| Healthcare | 2 | $330B |
|
||
Price history
-27.0% since first listed6 events — show timeline
- 2026-04-26 Price Changed $365,000 SAAR TX
- 2026-02-12 Price Changed $380,000 SAAR TX
- 2026-02-05 Relisted — SAAR TX
- 2026-01-08 Price Changed $425,000 SAAR TX
- 2025-08-20 Listed $499,900 SAAR TX
- 2018-01-30 Sold (Public Records) — Public Records
Property tax history
+4.4%/yrLatest (2025): $4,055 · -17.9% YoY. Source: county tax records.
Cash-flow waterfall
monthlySold comps — $/sqft
last 12 mo · ≤1 miLoading sold comps…