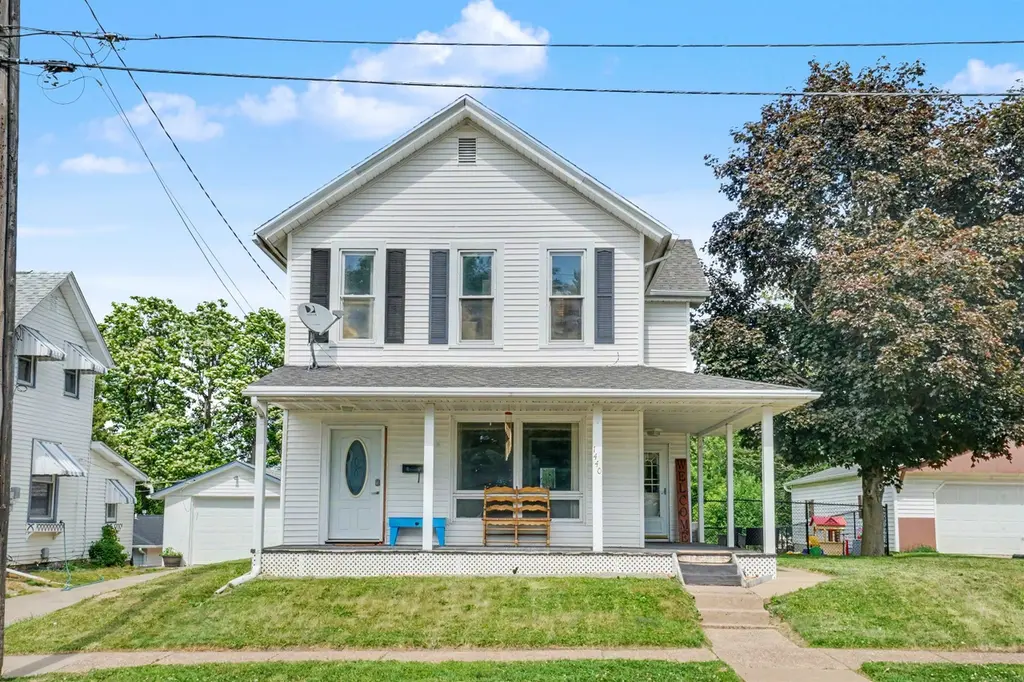
1440 Mount Pleasant St · Dubuque, IA
Flood risk 1/10 · Minimal
- FEMA flood zone
- X (unshaded)
- Chance of flooding over 30 yrs
- 0.0%
- Est. flood insurance / yr
- $473 – $860
Fire risk 1/10 · Minimal
- Est. fire insurance / yr
- $902 – $1,676
Heat risk 3/10 · Minor
- Hot days now (above 101°F)
- 7 days/yr
- Hot days in 30 yrs
- 15 days/yr
Wind risk 2/10 · Minimal
- Chance of severe wind over 30 yrs
- —
Air-quality risk 2/10 · Minimal
- Unhealthy air days now
- 1 days/yr
- Unhealthy air days in 30 yrs
- 2 days/yr
Risk factors via First Street. Map © Google.
Why this score? — see what drove the D+ grade
The composite is a weighted blend of 9 inputs, each scored 0–100. Each bar is that input's sub-score; the figure is the points it added to the 100-point composite (weight × sub-score).
- ARV discount +15.0/15.0
- Cash flow +11.5/30.0
- Schools +5.5/10.0
- Livability +4.5/5.0
- Rent growth +3.9/5.0
- DSCR +3.4/10.0
- 1% rule +3.1/10.0
- Condition / age +2.5/5.0
- Appreciation +0.0/10.0
$170,000
🖨 Deal sheet (PDF) 📄 Offer letter ✓ Due diligence
Listing remarks MLS
Charming and immaculate condition! Loads of character in this 4 bedroom, 1.5 bath 2 story home with a newer roof & windows & all appliances remain. Has newer flooring on the main level, fresh paint, and great curb appeal. Priced to sell!!
Key facts
- Flexible layout
- Built 1896
- Listed 19 days
Tags
Property features AI
Exterior
- Utilities: Public water; Public sewer
- Home design: Single-family detached home; Two levels; Residential zoning
- Construction: Stone foundation
- Exterior features: Deck; Patio; Fenced yard; Shingle roof
Interior
- Kitchen: Refrigerator; Range; Dishwasher
- Bedrooms: One bedroom on the main level
- Bathrooms: One full bathroom; One half bathroom; One bathroom on the main level
- Heating & cooling: Central air conditioning; Forced air heating (natural gas)
- Interior features: Window treatments; No fireplace; Full basement
- Laundry & utility: Washer and dryer included; Main-level laundry
Neighborhood map
What this means for you Summary
Snapshot
- This is a 3-bed/1.5-bath single-family listed at $170k.
Deal economics
- At list price, monthly cash flow is $-57 ($-683/yr) — negative.
- To cash-flow at today's rent, offer at most $160k (5.9% below list).
- To meet the 1% rule (rent ≥ 1% of price), the offer needs to be $137k (19.2% below list).
- Recommended offer: $137k (19.2% below list) — sets the bar for 1% rule.
- Cap rate 5.9% vs local median 3.5% in Dubuque — top-decile yield for the area; either an underpriced asset or a hidden risk that comps aren't pricing in. Stress-test before assuming the spread holds.
Location & tenants
- Location reads 89/100 on livability (#7 in IA, #119 nationally) — a professional / high-income tenant draw. Strengths: amenities A+, commute A+, cost of living A+; Watch: crime C-.
- Dubuque Community School District (urban): math 63% / reading 65% proficiency, ranked #205 of 289 in IA (top 71%) — acceptable for families but not a draw, mixed tenant base, ~2y average lease.
- Zoned schools: Lincoln Elementary School (math 42% / reading 42%, grade F, #563 of 616 statewide, top 93%, 255 students, 68% FRL); George Washington Middle School (math 63% / reading 65%, grade B+, #166 of 246 statewide, top 68%, 624 students, 50% FRL); Dubuque Senior High School (math 63% / reading 74%, grade B, #181 of 336 statewide, top 54%, 1,435 students, 36% FRL) — zoned schools average 51% FRL vs 32% district-wide (20 pts higher); higher-poverty schools than district average — tighter screening recommended.
- Market conditions: Rents rising fast (+5.6%/yr); 237 active listings in the ZIP; 6 comparable units currently listed for rent nearby; rentals lingering (median 46d on market — plan ~5-8 weeks vacancy on turnover, expect pricing pressure); 100% of comp listings sitting > 30 days — soft ceiling on asking rent; 473 units permitted in Dubuque County in 2024 (319 in 5+ unit buildings).
Forward outlook
- Local home prices are declining (-3.0%/yr); year-one equity from $1k of loan paydown is wiped out by about $5k of value loss. Plan a longer hold.
- Dubuque County population projected at +13% by 2050 — modest demand growth; plan on rents tracking national, not racing it.
Negotiation context
- It's been on market 19 days — a 2% lower offer ($167k) is reasonable based on typical stale-listing flexibility.
- 2 sale attempts since 11y ago with the ask held roughly flat each time — persistent listings suggest the price (not the market) is what's stuck; bring a comps-based counter.
- Current owner paid $98k; list at $170k implies a 73% gain — meaningful room to come down on a strong offer.
Risks & watch-outs
- Watch-outs: built in 1896 — expect roof / HVAC / electrical / plumbing capex.
Questions for the listing agent
- What do current leases actually rent for vs. the listed asking? Can we see a recent rent roll and the last 12 months of T-12 income?
- Built in 1896 — when were the roof, HVAC, electrical panel, plumbing, and water heater last replaced?
- Is there a deadline driving the sale (1031 exchange, divorce, estate, relocation)? That informs how much negotiation room exists.
- Schools are B-rated — typically a magnet for longer-tenancy family renters. What's the average tenant stay here, and is there a school-zone premium baked into asking?
- The area grade is low — what's the realistic commute time and amenity access for the typical tenant pool here? Any planned neighborhood developments (good or bad) we should know about?
- What's the average days-on-market for RENTAL listings here right now (not sales)? A rising rental-DOM trend means longer vacancies and softer asking-rent achievability than the comps imply.
- What's the recent tenant-quality profile in this submarket — average credit score on applications, eviction rate, late-payment / NSF rate, and stable-employment percentage? A property-management company in the area should have these aggregated.
- How much new for-sale + rental construction is in the pipeline within 1–3 miles? Heavy new supply typically softens prices + rents 12–24 months out; constrained supply supports both.
Investment metrics
- 1% rule
- 0.81% ✗
- Cap rate
- 5.89%
- Cash-on-cash
- -1.44%
- DSCR
- 0.94
- GRM
- 10.3
CMA / ARV
- ARV (on-the-fly)
- $214,130
- Comps found
- 12
Show comp detail 12 sales within ~0.75 mi
| Address | Dist | Beds/Ba | Sqft | Sold | Price | $/sf | Match |
|---|---|---|---|---|---|---|---|
| 1135 Wood St | 0.17mi | 4/2.0 (+1) | 1,632 (+1%) | 2mo | $231,375 | $142 | 81 |
| 1414 N Algona St | 0.34mi | 3/1.5 | 1,576 (-2%) | 5mo | $269,000 | $171 | 77 |
| 1458 Mount Pleasant St | 0.01mi | 3/1.0 | 1,380 (-14%) | 3mo | $155,500 | $113 | 71 |
| 1511 Adair St | 0.16mi | 3/2.0 | 1,406 (-13%) | 5mo | $180,000 | $128 | 65 |
| 1156 Center Pl | 0.38mi | 3/1.5 | 1,454 (-10%) | 5mo | $176,000 | $121 | 62 |
| 600 Angella St | 0.54mi | 3/1.5 | 1,492 (-7%) | 1mo | $206,550 | $138 | 61 |
| 1776 Grace St | 0.41mi | 3/1.5 | 1,424 (-12%) | 1mo | $220,000 | $154 | 61 |
| 71 Lois St | 0.72mi | 3/1.5 | 1,556 (-3%) | 2mo | $260,000 | $167 | 59 |
| 2155 Decorah St | 0.49mi | 3/1.0 | 1,430 (-11%) | 2mo | $190,000 | $133 | 55 |
| 33 Meadow Ln | 0.73mi | 4/1.5 (+1) | 1,580 (-2%) | 6mo | $132,000 | $84 | 53 |
| 1875 Saint Ambrose St | 0.68mi | 4/1.0 (+1) | 1,784 (+11%) | 1mo | $214,900 | $120 | 42 |
| 2485 Pearl St | 0.73mi | 3/1.5 | 1,814 (+13%) | 4mo | $215,000 | $119 | 41 |
Match score weights: distance 35% · size 25% · config 20% · recency 20%. Top-matched comps best support the ARV.
Projected returns pro-forma
-3.0% appreciation · 5.63% rent growth · sell at horizon
- IRR
- -15.8%
- Equity multiple
- 0.42×
- Total profit
- $-27,443
- Equity at exit
- $25,348
- IRR
- -3.5%
- Equity multiple
- 0.74×
- Total profit
- $-12,408
- Equity at exit
- $14,698
Cash invested: $47,600 (down + closing). Projections, not guarantees.
Landlord ↔ Tenant lean methodology
- Overall (STATE)
- 83 Strongly Landlord-Friendly
- State Iowa
- 83 Strongly Landlord-Friendly · R+6
- County
- — inherits STATE
- City
- — inherits STATE
ZIP-level market 52001
- Rents YoY
- 5.6%
- Active inventory
- 237
- Price-to-rent
- 10.3×
Monthly cashflow live
- Estimated rent
- $1,374 high interval (Pro) →
- Mortgage (P&I)
- −$891
- Tax from tax record
- −$180 /mo · $2,158/yr
- Insurance
- −$71
- HOA
- −$0
- Lot rent
- −$0
- Vacancy / Maint / Mgmt
- −$288
- Net cashflow
- $-57
Break-even live
Sensitivity live
| Price | -10% $39 | -5% $-9 | +0% $-57 | +5% $-105 | +10% $-153 |
|---|---|---|---|---|---|
| Rent | -10% $-165 | -5% $-111 | +0% $-57 | +5% $-3 | +10% $52 |
| Rate | -1.0pp $29 | -0.5pp $-14 | base $-57 | +0.5pp $-101 | +1.0pp $-146 |
UW: 25.0% down · 7.5% · 30yr · 1.5% tax · 5.0% vac · 8.0% maint · 8.0% mgmt
Financing live
Cash to close
- Down payment
- $42,500
- Closing costs
- $5,100
- Reserves months
- —
- Total cash needed
- —
Loan-product check · same deal, 3 products live
Conventional
25% down · 7.5% · 30yr
- Down + closing
- —
- Monthly P&I
- —
- Monthly cashflow
- —
- DSCR
- —
- Eligible?
- —
Personal DTI + credit; lowest rate.
DSCR
20% down · 8.5% · 30yr
- Down + closing
- —
- Monthly P&I
- —
- Monthly cashflow
- —
- DSCR
- —
- Eligible?
- —
No personal income docs; deal must DSCR.
Hard money
10% down · 12.0% · 12mo
- Down + closing
- —
- Monthly P&I
- —
- Monthly cashflow
- —
- DSCR
- —
- Eligible?
- —
Short-term bridge; refi at stabilization.
Rent comps 6 comps
| Address | Beds | Baths | Sqft | Rent | $/sqft | DOM | Units | Dist |
|---|---|---|---|---|---|---|---|---|
| 980 Mount Pleasant St Unit 1 Dubuque, IA | 3.0 | 1.0 | 1236 | $1,150 | $0.93 | 46d | 1 | 0.19mi |
| 1742 Delhi St Dubuque, IA | 2.0 | 1.5 | 1534 | $1,300 | $0.85 | 46d | 1 | 0.40mi |
| 703 Caledonia Pl Dubuque, IA | 3.0 | 1.0 | 1400 | $1,400 | $1.00 | 46d | 1 | 0.62mi |
| 500 Hill St Unit 2 Dubuque, IA | 3.0 | 1.0 | 1900 | $1,910 | $1.01 | 46d | 1 | 0.68mi |
| 1501 Central Ave Unit 1513-1 Dubuque, IA | 3.0 | 1.0 | 1374 | $1,175 | $0.86 | 46d | 1 | 0.92mi |
| 333 E 10th St Dubuque, IA | 2.0 | 2.0 | 1530 | $1,750 | $1.14 | 46d | 3 | 1.15mi |
Listing history 16 events
-
2026-06-23price $170,000 Active 19 DOM
-
2026-06-22days on market $175,000 Active 19 DOM
-
2026-06-21days on market $175,000 Active 18 DOM
-
2026-06-19days on market $175,000 Active 16 DOM
-
2026-06-18days on market $175,000 Active 15 DOM
-
2026-06-17days on market $175,000 Active 14 DOM
-
2026-06-16days on market $175,000 Active 13 DOM
-
2026-06-15days on market $175,000 Active 12 DOM
-
2026-06-14days on market $175,000 Active 10 DOM
-
2026-06-13days on market $175,000 Active 9 DOM
-
2026-06-10days on market $175,000 Active 7 DOM
-
2026-06-09days on market $175,000 Active 6 DOM
-
2026-06-08days on market $175,000 Active 5 DOM
-
2026-06-07days on market $175,000 Active 4 DOM
-
2026-06-03remarks 693-char remark
-
2026-06-03$175,000 Active 1 DOM
ⓘ Source: listings_history table (triggers on properties + properties_extension) + one-shot
backfill from property_details.listing_events for pre-trigger history.
Tax reassessment forecast IA · Partial reset (capped growth)
- Current annual tax
- $2,158 · $180/mo
- Projected year-2 tax
- $2,414 · $201/mo
- Expected delta
- +$256/yr (+$21/mo · 11.8%)
ⓘ Screening estimate from a state-policy table — verify with the county assessor before closing.
Climate risk First Street
- Flood 1/10 Low FEMA zone X (unshaded) · 0% chance over 30 yrs
- Wildfire 1/10 Low
- Heat 3/10 Moderate 7 d/yr ≥101°F today · 15 d/yr by 30 yrs out
- Wind 2/10 Low
- Air quality 2/10 Low 1 unhealthy d/yr today · 2 by 30 yrs out
Nearby sold comps map
Loading sold comps map…
Walkable amenities ~0.75 mi
Loading nearby amenities…
Taxation est. · year 1
- Rental income
- $16,484
- − Mortgage interest
- −$9,523
- − Property taxes
- −$2,158
- − Insurance
- −$850
- − Repairs & maintenance
- −$1,319
- − Management
- −$1,319
- − Depreciation
- −$4,945
- Taxable loss
- −$3,629
- Est. tax savings @ 24.0%
- +$871
- After-tax cash flow
- $188/yr
For passive investors: Depreciation is non-cash, so a rental often shows a tax loss while cash-flowing — sheltering income. Rental losses are passive: they offset passive income freely, and up to $25,000/yr can offset ordinary (W-2) income if you actively participate and your MAGI is under $100k (phasing out to $0 by $150k); unused losses carry forward. On sale, claimed depreciation is recaptured at up to 25%, and gains may owe capital-gains tax (a 1031 exchange can defer both). Figures are a year-1 estimate at your 24.0% rate — not tax advice; consult a CPA.
Schools (NCES district)
- District
- Dubuque Community School District
- NCES district ID
- 1909480
- Math proficiency
- 63% ▼ -7.00%
- Reading proficiency
- 65% ▼ -1.00%
- Median HH income
- $51,237
- Composite
- 54.51/100
- National rank
- #1345
- State rank
- #205 of 289 in IA
Livability — Dubuque
- Score
- 89/100
- State rank
- #7
- US rank
- #119
Category grades
Schools grade is shown separately in the Schools card above.
Census & demographics
- Census place
- Dubuque, IA
- County
- Dubuque County · 60,106 people
- City population
- 60,106
- Metro
- Dubuque, IA
- Population (ZIP)
- 43,101
- Household income
- $61,643
- Rent vs Own
- Severe rent burden
- 1940.0
Population outlook (Dubuque County) Hauer SSP2
- Today (2025)
- 103,359 people
- By 2030
- 106,472 · +3.0%
- By 2040
- 112,043 · +8.4%
- By 2050
- 116,553 · +12.8%
- By 2075
- 128,014 · +23.9%
- By 2100
- 132,892 · +28.6%
Race, ethnicity, and origin ACS 2023
- Neighborhood character
- Predominantly White (84%)
- Race & ethnicity
- White 84% Two or more races 6% Black 5% Hispanic / Latino 4% Asian 1% Pacific Islander 1%
- Common ancestry
- Portuguese 3% Italian 2% Lithuanian 2%
- Foreign-born
- 4% · Canada, China
- Languages at home
- 95% English-only · Spanish 3% Tagalog/Filipino 1% Other Asian/Pacific 1%
Political lean MEDSL · Dubuque
- 2024 margin
- Lean R (+8.6) · D 45.1% · R 53.7% · Other 1.2%
- 2008→2024 swing
- -29.4pp toward R · 2008: 20.8pp · 2024: -8.6pp
- All cycles
- 2024: R+8.6 2020: R+2.9 2016: R+1.2 2012: D+14.5 2008: D+20.8
Not yet ingested
- Civics
- —
Market trends
- HPI YoY
- ▼ -156.36%
- Current HPI
- 173.5536
- Rent YoY
- ▲ 5.63%
- Metro
- Dubuque, IA
- State GDP YoY
- ▲ 2.48%
- F500 in state
- 4
Industry mix (Fortune 500 HQ in IA)
| Industry | F500 HQs | Revenue |
|---|---|---|
| Financial Services | 1 | $16B |
|
||
| Retail / Convenience | 1 | $15B |
|
||
Price history
+75.0% since first listed4 events — show timeline
- 2026-06-03 Listed $175,000 ECIMLS
- 2015-11-30 Sold (Public Records) $98,500 Public Records
- 2015-11-25 Sold (MLS) $98,500 ECIMLS
- 2015-06-16 Listed $100,000 ECIMLS
Property tax history
+2.9%/yrLatest (2025): $2,158 · +3.0% YoY. Source: county tax records.
Cash-flow waterfall
monthlySold comps — $/sqft
last 12 mo · ≤1 miLoading sold comps…