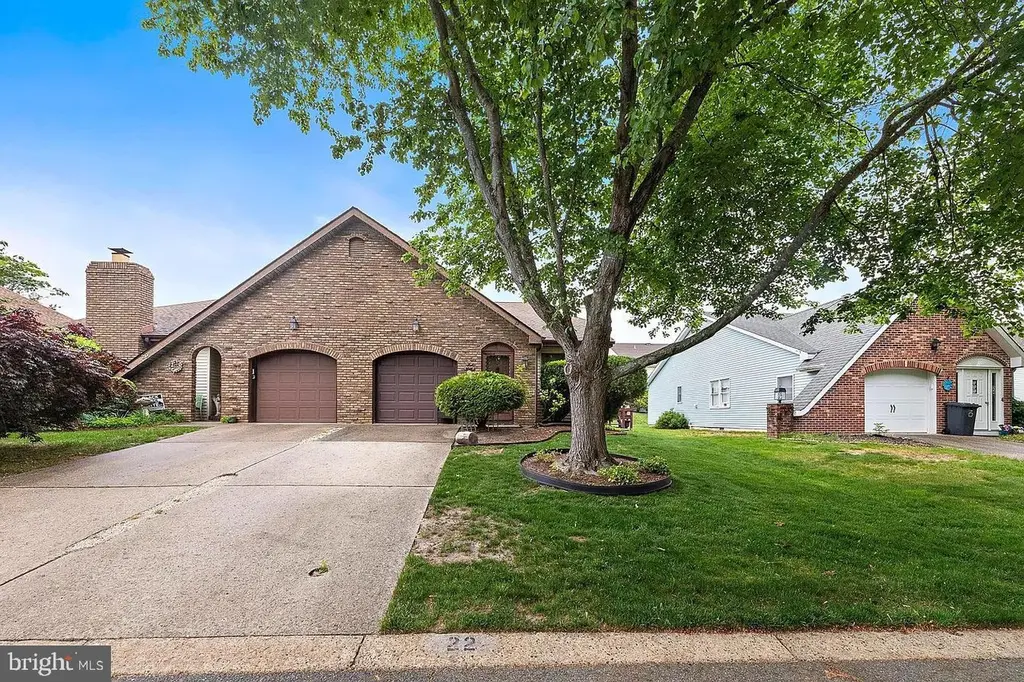
22 Fir Rd · Ocean Acres, NJ
Flood risk 1/10 · Minimal
- FEMA flood zone
- X (unshaded)
- Chance of flooding over 30 yrs
- 0.0%
- Est. flood insurance / yr
- $507 – $1,088
Fire risk 7/10 · Major
- Est. fire insurance / yr
- $526 – $976
Heat risk 7/10 · Major
- Hot days now (above 100°F)
- 7 days/yr
- Hot days in 30 yrs
- 16 days/yr
Wind risk 6/10 · Moderate
- Chance of severe wind over 30 yrs
- 75.0%
Air-quality risk 2/10 · Minimal
- Unhealthy air days now
- 1 days/yr
- Unhealthy air days in 30 yrs
- 3 days/yr
Risk factors via First Street. Map © Google.
Why this score? — see what drove the D- grade
The composite is a weighted blend of 9 inputs, each scored 0–100. Each bar is that input's sub-score; the figure is the points it added to the 100-point composite (weight × sub-score).
- Cash flow +12.5/30.0
- 1% rule +4.7/10.0
- ARV discount +4.7/15.0
- DSCR +3.7/10.0
- Schools +3.4/10.0
- Livability +3.2/5.0
- Rent growth +2.5/5.0
- Condition / age +2.5/5.0
- Appreciation +0.0/10.0
$244,999
🖨 Deal sheet (PDF) 📄 Offer letter ✓ Due diligence
Listing remarks
Owner Motivated & Ready to Make a Deal! Welcome to 22 Fir Rd in the highly sought-after Fawn Lakes 55+ Community — where comfort, connection, and easy coastal living come together. This charming twin/semi-detached home offers 1,214 sq. ft. of thoughtfully designed living space with generously sized rooms and numerous updates throughout, including the kitchen, bathrooms, flooring, and interior doors. From the moment you step inside, you’ll notice this homes unique personality — or bring your own vision and make it yours. Features Include: • Entry-level bedrooms • Updated bathrooms with walk-in/stall showers • Crown moldings throughout • Spacious,
Key facts
- Active clubhouse
- Heated outdoor pool
- Near parks
Tags
Property features AI
Finance
- HOA & community: Quarterly HOA fee ($659); One-time condo/co-op fee ($1,450); One-time other fee ($450); HOA covers common area maintenance, exterior building maintenance, lawn care, pool(s), recreation facility, snow removal and trash; Community amenities include outdoor pool and clubhouse
Exterior
- Parking: Attached built-in garage (1 space)
- Utilities: Public water; Public sewer; Electric hot water; Natural gas available; Cable TV available
- Home design: Condominium; Semi-detached structure; Estimated year built; Middle-of-block location; 55+ senior community
- Construction: Brick front with frame construction; Shingle roof; Crawl space foundation
- Exterior features: Community outdoor pool; Pets allowed (cats and dogs OK; size/weight restrictions apply)
Interior
- Bedrooms: Two main-level bedrooms
- Flooring: Engineered wood flooring
- Bathrooms: Two full bathrooms (both on the main level)
- Heating & cooling: Baseboard electric heat; Central air conditioning
- Interior features: Stall shower and tub/shower combination; Walk-in shower in bathroom; Crown molding; Dining area; No basement; No stairs (accessible)
- Laundry & utility: In-unit laundry available
Neighborhood map
What this means for you Summary
Snapshot
- This is a 2-bed/2.0-bath townhouse listed at $245k.
Deal economics
- At list price, monthly cash flow is $-34 ($-406/yr) — negative.
- To cash-flow at today's rent, offer at most $240k (2.0% below list).
- To meet the 1% rule (rent ≥ 1% of price), the offer needs to be $238k (2.9% below list).
- Recommended offer: $238k (2.9% below list) — sets the bar for 1% rule.
- Cap rate 6.1% vs local median 3.1% in Ocean Acres — top-decile yield for the area; either an underpriced asset or a hidden risk that comps aren't pricing in. Stress-test before assuming the spread holds.
Location & tenants
- Location reads 63/100 on livability (#425 in NJ) — a middle-class / working-renter tenant base. Strengths: employment A+, housing A+; Watch: amenities F, commute F, cost of living F.
- Southern Regional School District (suburban): math 22% / reading 52% proficiency, ranked #251 of 472 in NJ (top 53%) — families likely to look elsewhere, expect single-tenant / working-renter base with shorter leases; only 17% free/reduced lunch — higher-income household profile.
- Zoned schools: Ocean Acres Elementary School (665 students, 21% FRL); Southern Regional Middle School (math 21% / reading 53%, grade F, #221 of 431 statewide, top 52%, 905 students, 22% FRL); Southern Regional High School (math 23% / reading 51%, grade F, #217 of 399 statewide, top 57%, 1,845 students, 17% FRL) — zoned schools at 20% FRL track the district average.
- Market conditions: 216 active listings in the ZIP; 4,434 units permitted in Ocean County in 2024 (868 in 5+ unit buildings).
Forward outlook
- Local home prices are declining (-3.0%/yr); year-one equity from $2k of loan paydown is wiped out by about $7k of value loss. Plan a longer hold.
- Ocean County population projected to shrink 8% by 2050 — rents likely to lag national; underwrite the cash flow, not the appreciation.
Negotiation context
- It's been on market 26 days — a 2% lower offer ($241k) is reasonable based on typical stale-listing flexibility.
- 3 sale attempts with the ask held roughly flat each time — persistent listings suggest the price (not the market) is what's stuck; bring a comps-based counter.
Risks & watch-outs
- Climate carrying-cost: major wind risk, 75% chance of damaging wind over 30y; major wildfire risk; extreme-heat days projected 7→16/yr by 2055 (HVAC capex compounding) — expect insurance premiums to compound above CPI over the hold.
Questions for the listing agent
- What do current leases actually rent for vs. the listed asking? Can we see a recent rent roll and the last 12 months of T-12 income?
- What does the HOA fee cover, when was the last increase, and are there any pending special assessments or reserve-fund shortfalls?
- Is there a deadline driving the sale (1031 exchange, divorce, estate, relocation)? That informs how much negotiation room exists.
- The area grade is low — what's the realistic commute time and amenity access for the typical tenant pool here? Any planned neighborhood developments (good or bad) we should know about?
- What's the average days-on-market for RENTAL listings here right now (not sales)? A rising rental-DOM trend means longer vacancies and softer asking-rent achievability than the comps imply.
- What's the recent tenant-quality profile in this submarket — average credit score on applications, eviction rate, late-payment / NSF rate, and stable-employment percentage? A property-management company in the area should have these aggregated.
- How much new for-sale + rental construction is in the pipeline within 1–3 miles? Heavy new supply typically softens prices + rents 12–24 months out; constrained supply supports both.
Investment metrics
- 1% rule
- 0.97% ✗
- Cap rate
- 6.13%
- Cash-on-cash
- -0.59%
- DSCR
- 0.97
- GRM
- 8.6
CMA / ARV
- ARV (on-the-fly)
- $230,660
- Comps found
- 12
Show comp detail 12 sales within ~0.75 mi
| Address | Dist | Beds/Ba | Sqft | Sold | Price | $/sf | Match |
|---|---|---|---|---|---|---|---|
| 18 Magnolia Rd | 0.10mi | 2/2.0 | 1,126 (-7%) | 4mo | $220,000 | $195 | 80 |
| 29 Sycamore Rd | 0.15mi | 2/2.0 | 1,126 (-7%) | 4mo | $190,000 | $169 | 78 |
| 10 Acorn Rd | 0.19mi | 2/2.0 | 1,126 (-7%) | 2mo | $165,000 | $147 | 78 |
| 65 Sycamore Rd | 0.09mi | 2/2.0 | 1,126 (-7%) | 9mo | $264,500 | $235 | 76 |
| 2-B Magnolia Rd | 0.19mi | 2/2.0 | 1,126 (-7%) | 8mo | $222,000 | $197 | 72 |
| 28 Sycamore Rd #45 | 0.11mi | 2/2.0 | 1,112 (-8%) | 11mo | $305,000 | $274 | 72 |
| 22 Magnolia Rd | 0.09mi | 2/2.0 | 1,126 (-7%) | 15mo | $150,125 | $133 | 71 |
| 48 Sycamore Rd | 0.05mi | 2/2.0 | 1,112 (-8%) | 19mo | $299,900 | $270 | 68 |
| 13-B Walnut Rd | 0.26mi | 2/1.5 | 1,075 (-11%) | 1mo | $200,000 | $186 | 66 |
| 6-B Magnolia Rd | 0.16mi | 2/2.0 | 1,126 (-7%) | 19mo | $192,000 | $171 | 64 |
| 43-B Sycamore Rd | 0.09mi | 2/1.0 | 1,075 (-11%) | 11mo | $184,000 | $171 | 64 |
| 18B Acorn Rd | 0.21mi | 2/1.0 | 1,075 (-11%) | 16mo | $204,000 | $190 | 54 |
Match score weights: distance 35% · size 25% · config 20% · recency 20%. Top-matched comps best support the ARV.
Projected returns pro-forma
-3.0% appreciation · 3.0% rent growth · sell at horizon
- IRR
- -17.2%
- Equity multiple
- 0.39×
- Total profit
- $-41,683
- Equity at exit
- $36,530
- IRR
- -9.0%
- Equity multiple
- 0.44×
- Total profit
- $-38,375
- Equity at exit
- $21,183
Cash invested: $68,600 (down + closing). Projections, not guarantees.
Landlord ↔ Tenant lean methodology
- Overall (STATE)
- 21 Tenant-Leaning
- State New Jersey
- 21 Tenant-Leaning · D+6
- County
- — inherits STATE
- City
- — inherits STATE
ZIP-level market 08050
- Active inventory
- 216
- Price-to-rent
- 8.6×
Monthly cashflow live
- Estimated rent
- $2,379 medium interval (Pro) →
- Mortgage (P&I)
- −$1,285
- Tax est. 1.5%
- −$306 /mo · $3,675/yr
- Insurance
- −$102
- HOA
- −$220
- Vacancy / Maint / Mgmt
- −$500
- Net cashflow
- $-34
Break-even live
Sensitivity live
| Price | -10% $135 | -5% $51 | +0% $-34 | +5% $-118 | +10% $-203 |
|---|---|---|---|---|---|
| Rent | -10% $-222 | -5% $-128 | +0% $-34 | +5% $60 | +10% $154 |
| Rate | -1.0pp $90 | -0.5pp $28 | base $-34 | +0.5pp $-97 | +1.0pp $-162 |
UW: 25.0% down · 7.5% · 30yr · 1.5% tax · 5.0% vac · 8.0% maint · 8.0% mgmt
Financing live
Cash to close
- Down payment
- $61,250
- Closing costs
- $7,350
- Reserves months
- —
- Total cash needed
- —
Loan-product check · same deal, 3 products live
Conventional
25% down · 7.5% · 30yr
- Down + closing
- —
- Monthly P&I
- —
- Monthly cashflow
- —
- DSCR
- —
- Eligible?
- —
Personal DTI + credit; lowest rate.
DSCR
20% down · 8.5% · 30yr
- Down + closing
- —
- Monthly P&I
- —
- Monthly cashflow
- —
- DSCR
- —
- Eligible?
- —
No personal income docs; deal must DSCR.
Hard money
10% down · 12.0% · 12mo
- Down + closing
- —
- Monthly P&I
- —
- Monthly cashflow
- —
- DSCR
- —
- Eligible?
- —
Short-term bridge; refi at stabilization.
HOA detail
- Monthly dues
- $220 · $2,640/yr
Listing history 25 events
-
2026-06-21days on market $244,999 Active 26 DOM
-
2026-06-18days on market $244,999 Active 23 DOM
-
2026-06-17days on market $244,999 Active 22 DOM
-
2026-06-16days on market $244,999 Active 21 DOM
-
2026-06-15days on market $244,999 Active 20 DOM
-
2026-06-13days on market $244,999 Active 18 DOM
-
2026-06-13days on market $244,999 Active 17 DOM
-
2026-06-09days on market $244,999 Active 14 DOM
-
2026-06-08days on market $244,999 Active 13 DOM
-
2026-06-07days on market $244,999 Active 12 DOM
-
2026-06-04days on market $244,999 Active 9 DOM
-
2026-06-03days on market $244,999 Active 8 DOM
-
2026-06-02days on market $244,999 Active 7 DOM
-
2026-06-01days on market $244,999 Active 6 DOM
-
2026-05-31days on market $244,999 Active 5 DOM
-
2026-05-26$244,999 Active
-
2025-12-30historical
-
2025-10-20price $255,000
-
2025-10-13price $265,000
-
2025-10-06status Active
-
2025-10-01status Pending
-
2025-08-28historical Active Under Contract
-
2025-08-05price $268,900
-
2025-07-17price $275,000
-
2025-05-13$300,000 Active
ⓘ Source: listings_history table (triggers on properties + properties_extension) + one-shot
backfill from property_details.listing_events for pre-trigger history.
Climate risk First Street
- Flood 1/10 Low FEMA zone X (unshaded) · 0% chance over 30 yrs
- Wildfire 7/10 Severe
- Heat 7/10 Severe 7 d/yr ≥100°F today · 16 d/yr by 30 yrs out
- Wind 6/10 Major 75% chance of damaging wind over 30 yrs
- Air quality 2/10 Low 1 unhealthy d/yr today · 3 by 30 yrs out
Nearby sold comps map
Loading sold comps map…
Walkable amenities ~0.75 mi
Loading nearby amenities…
Taxation est. · year 1
- Rental income
- $28,547
- − Mortgage interest
- −$13,724
- − Property taxes
- −$3,675
- − Insurance
- −$1,225
- − Repairs & maintenance
- −$2,284
- − Management
- −$2,284
- − HOA
- −$2,640
- − Depreciation
- −$7,127
- Taxable loss
- −$4,412
- Est. tax savings @ 24.0%
- +$1,059
- After-tax cash flow
- $653/yr
For passive investors: Depreciation is non-cash, so a rental often shows a tax loss while cash-flowing — sheltering income. Rental losses are passive: they offset passive income freely, and up to $25,000/yr can offset ordinary (W-2) income if you actively participate and your MAGI is under $100k (phasing out to $0 by $150k); unused losses carry forward. On sale, claimed depreciation is recaptured at up to 25%, and gains may owe capital-gains tax (a 1031 exchange can defer both). Figures are a year-1 estimate at your 24.0% rate — not tax advice; consult a CPA.
Schools (NCES district)
- District
- Southern Regional School District
- NCES district ID
- 3415480
- Math proficiency
- 22% ▼ -17.00%
- Reading proficiency
- 52% ▼ -2.00%
- Median HH income
- $70,588
- Composite
- 33.85/100
- National rank
- #5355
- State rank
- #251 of 472 in NJ
Livability — Ocean Acres
- Score
- 63/100
- State rank
- #425
- US rank
- #15187
Category grades
Schools grade is shown separately in the Schools card above.
Census & demographics
- Census place
- Ocean Acres, NJ
- City population
- 25,936
- Population (ZIP)
- 27,599
Population outlook (Ocean County) Hauer SSP2
- Today (2025)
- 586,991 people
- By 2030
- 581,403 · -1.0%
- By 2040
- 564,913 · -3.8%
- By 2050
- 538,149 · -8.3%
- By 2075
- 468,845 · -20.1%
- By 2100
- 350,297 · -40.3%
Race, ethnicity, and origin ACS 2023
- Neighborhood character
- Predominantly White (87%)
- Race & ethnicity
- White 87% Hispanic / Latino 9% Two or more races 6%
- Hispanic origin (detail)
- Mexican 2% Puerto Rican 2%
- Common ancestry
- Romanian 8% Lithuanian 1% Subsaharan African 1%
- Foreign-born
- 6% · Canada, Jamaica
- Languages at home
- 92% English-only · Spanish 5% Other Indo-European 2% Russian/Polish/Slavic 1%
Political lean MEDSL · Ocean
- 2024 margin
- Solid R (+36.0) · D 31.4% · R 67.4% · Other 1.2%
- 2008→2024 swing
- -17.6pp toward R · 2008: -18.4pp · 2024: -36.0pp
- All cycles
- 2024: R+36.0 2020: R+28.7 2016: R+34.0 2012: R+17.7 2008: R+18.4
Not yet ingested
- Civics
- —
Market trends
- HPI YoY
- ▼ -404.12%
- Current HPI
- 369.8706
- Rent YoY
- —
- Metro
- —
- State GDP YoY
- ▲ 2.05%
- F500 in state
- 34
Industry mix (Fortune 500 HQ in NJ)
| Industry | F500 HQs | Revenue |
|---|---|---|
| Consumer Goods | 3 | $31B |
|
||
| Pharmaceuticals | 2 | $153B |
|
||
| Technology | 2 | $21B |
|
||
| Insurance | 2 | $20B |
|
||
| Healthcare | 2 | $19B |
|
||
| Financial Services | 1 | $70B |
|
||
Price history
-18.3% since first listed10 events — show timeline
- 2026-05-26 Listed $244,999 BRIGHT MLS
- 2025-12-30 Listing Removed — BRIGHT MLS
- 2025-10-20 Price Changed $255,000 BRIGHT MLS
- 2025-10-13 Price Changed $265,000 BRIGHT MLS
- 2025-10-06 Relisted — BRIGHT MLS
- 2025-10-01 Pending — BRIGHT MLS
- 2025-08-28 Contingent — BRIGHT MLS
- 2025-08-05 Price Changed $268,900 BRIGHT MLS
- 2025-07-17 Price Changed $275,000 BRIGHT MLS
- 2025-05-13 Listed $300,000 BRIGHT MLS
Cash-flow waterfall
monthlySold comps — $/sqft
last 12 mo · ≤1 miLoading sold comps…