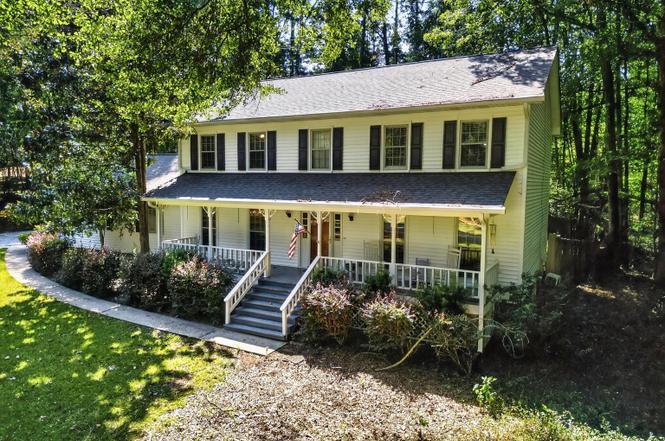
110 Greenway Ct · Fayetteville, GA
Flood risk 1/10 · Minimal
- FEMA flood zone
- X (unshaded)
- Chance of flooding over 30 yrs
- 0.0%
- Est. flood insurance / yr
- $507 – $1,088
Fire risk 4/10 · Minor
- Est. fire insurance / yr
- $963 – $1,789
Heat risk 6/10 · Moderate
- Hot days now (above 106°F)
- 7 days/yr
- Hot days in 30 yrs
- 18 days/yr
Wind risk 6/10 · Moderate
- Chance of severe wind over 30 yrs
- 27.0%
Air-quality risk 3/10 · Minor
- Unhealthy air days now
- 3 days/yr
- Unhealthy air days in 30 yrs
- 4 days/yr
Risk factors via First Street. Map © Google.
Why this score? — see what drove the D+ grade
The composite is a weighted blend of 9 inputs, each scored 0–100. Each bar is that input's sub-score; the figure is the points it added to the 100-point composite (weight × sub-score).
- ARV discount +12.6/15.0
- Cash flow +11.9/30.0
- Schools +5.1/10.0
- Livability +3.6/5.0
- DSCR +3.5/10.0
- Rent growth +3.3/5.0
- 1% rule +2.7/10.0
- Condition / age +2.5/5.0
- Appreciation +0.0/10.0
$399,000
🖨 Deal sheet (PDF) 📄 Offer letter ✓ Due diligence
Listing remarks
Welcome to this spacious 3-bedroom, 2.5-bath home located in the sought-after Whitewater/Sara Harp school district of Fayette County. Thoughtfully updated, the main level features LVP flooring for a seamless, modern feel. A large dining room leads into the kitchen, which offers plenty of cabinet and counter space, a cooktop, wall oven, dishwasher, breakfast bar, and room for a kitchen table. A walk-in pantry adds extra storage, making this kitchen a great canvas for your personal touch. The oversized living room is the perfect gathering space, complete with a brick fireplace with gas starter. A half bath and multiple storage closets round out the main level. Upstairs, the owner's suite boas
Key facts
- Large dining room
- Brick fireplace
- Lvp flooring
Tags
Neighborhood map
What this means for you Summary
Snapshot
- This is a 3-bed/4.0-bath single-family listed at $399k.
Deal economics
- At list price, monthly cash flow is $-105 ($-1k/yr) — negative.
- To cash-flow at today's rent, offer at most $381k (4.6% below list).
- To meet the 1% rule (rent ≥ 1% of price), the offer needs to be $306k (23.4% below list).
- Recommended offer: $306k (23.4% below list) — sets the bar for 1% rule.
- Cap rate 6.0% vs local median 4.3% in Fayetteville — top-decile yield for the area; either an underpriced asset or a hidden risk that comps aren't pricing in. Stress-test before assuming the spread holds.
Location & tenants
- Location reads 71/100 on livability (#86 in GA) — a middle-class / working-renter tenant base. Strengths: housing A+, health & safety B+, employment B; Watch: amenities F, commute F.
- Fayette County (suburban): math 52% / reading 60% proficiency, ranked #7 of 174 in GA (top 4%) — acceptable for families but not a draw, mixed tenant base, ~2y average lease.
- Zoned schools: Sara Harp Minter Elementary School (math 61% / reading 62%, grade B, #114 of 1,228 statewide, top 9%, 783 students, 18% FRL); Whitewater Middle School (math 55% / reading 65%, grade B, #41 of 470 statewide, top 9%, 864 students, 20% FRL); Whitewater High School (math 32% / reading 62%, grade D-, #37 of 424 statewide, top 9%, 1,387 students, 18% FRL) — zoned schools at 19% FRL track the district average.
- Market conditions: Rents rising (+3.2%/yr); 311 active listings in the ZIP; 10 comparable units currently listed for rent nearby; rentals at typical pace (median 26d on market — plan ~3-4 weeks tenant-placement turnaround); 40% of comp listings sitting > 30 days — soft ceiling on asking rent; high-income renter base; 323 units permitted in Fayette County in 2024 (0 in 5+ unit buildings).
- This rent runs 31% of the median local income ($118k/yr) — at the standard rent-burdened threshold; future hikes will face affordability resistance.
Forward outlook
- Local home prices are declining (-3.0%/yr); year-one equity from $3k of loan paydown is wiped out by about $12k of value loss. Plan a longer hold.
- Fayette County population projected at +13% by 2050 — modest demand growth; plan on rents tracking national, not racing it.
Negotiation context
- It's been on market 216 days — a 12% lower offer ($351k) is reasonable based on typical stale-listing flexibility.
- Current owner paid $205k; list at $399k implies a 95% gain — meaningful room to come down on a strong offer.
Risks & watch-outs
- Climate carrying-cost: major wind risk, 27% chance of damaging wind over 30y; extreme-heat days projected 7→18/yr by 2055 (HVAC capex compounding) — expect insurance premiums to compound above CPI over the hold.
Questions for the listing agent
- What do current leases actually rent for vs. the listed asking? Can we see a recent rent roll and the last 12 months of T-12 income?
- It's been on market 216 days. Have you received any prior offers? Is the seller open to a 23% concession, seller financing, or rate buy-down credit?
- Why hasn't it sold? Are there any deal-killer items the seller is aware of (foundation, flood, title, zoning, code violations)?
- Is there a deadline driving the sale (1031 exchange, divorce, estate, relocation)? That informs how much negotiation room exists.
- Schools are B-rated — typically a magnet for longer-tenancy family renters. What's the average tenant stay here, and is there a school-zone premium baked into asking?
- The area grade is low — what's the realistic commute time and amenity access for the typical tenant pool here? Any planned neighborhood developments (good or bad) we should know about?
- What's the average days-on-market for RENTAL listings here right now (not sales)? A rising rental-DOM trend means longer vacancies and softer asking-rent achievability than the comps imply.
- What's the recent tenant-quality profile in this submarket — average credit score on applications, eviction rate, late-payment / NSF rate, and stable-employment percentage? A property-management company in the area should have these aggregated.
- How much new for-sale + rental construction is in the pipeline within 1–3 miles? Heavy new supply typically softens prices + rents 12–24 months out; constrained supply supports both.
Investment metrics
- 1% rule
- 0.77% ✗
- Cap rate
- 5.98%
- Cash-on-cash
- -1.12%
- DSCR
- 0.95
- GRM
- 10.9
CMA / ARV
- ARV (on-the-fly)
- $450,072
- Comps found
- 6
Show comp detail 6 sales within ~0.75 mi
| Address | Dist | Beds/Ba | Sqft | Sold | Price | $/sf | Match |
|---|---|---|---|---|---|---|---|
| 110 Greenway Ct | 0.00mi | 3/2.5 | 2,394 (0%) | 1mo | $375,000 | $157 | 93 |
| 170 Perry Creek Dr | 0.41mi | 4/2.5 (+1) | 2,376 (-1%) | 2mo | $457,000 | $192 | 67 |
| 120 Greenfield Cir | 0.34mi | 3/2.0 | 2,400 (+0%) | 16mo | $450,000 | $188 | 62 |
| 170 Royal Ridge Way | 0.43mi | 3/2.0 | 2,302 (-4%) | 9mo | $475,000 | $206 | 58 |
| 240 Greenfield Cir | 0.12mi | 4/3.0 (+1) | 2,740 (+14%) | 19mo | $447,500 | $163 | 45 |
| 215 Kingswood Dr | 0.74mi | 4/2.5 (+1) | 2,484 (+4%) | 13mo | $365,000 | $147 | 38 |
Match score weights: distance 35% · size 25% · config 20% · recency 20%. Top-matched comps best support the ARV.
Projected returns pro-forma
-3.0% appreciation · 3.22% rent growth · sell at horizon
- IRR
- -18.0%
- Equity multiple
- 0.37×
- Total profit
- $-70,741
- Equity at exit
- $59,492
- IRR
- -9.8%
- Equity multiple
- 0.39×
- Total profit
- $-67,793
- Equity at exit
- $34,498
Cash invested: $111,720 (down + closing). Projections, not guarantees.
Landlord ↔ Tenant lean methodology
- Overall (STATE)
- 90 Strongly Landlord-Friendly
- State Georgia
- 90 Strongly Landlord-Friendly · R+3
- County
- — inherits STATE
- City
- — inherits STATE
ZIP-level market 30215
- Rents YoY
- 3.2%
- Active inventory
- 311
- Price-to-rent
- 10.9×
Monthly cashflow live
- Estimated rent
- $3,056 high interval (Pro) →
- Mortgage (P&I)
- −$2,092
- Tax from tax record
- −$261 /mo · $3,127/yr
- Insurance
- −$166
- HOA
- −$0
- Vacancy / Maint / Mgmt
- −$642
- Net cashflow
- $-105
Break-even live
Sensitivity live
| Price | -10% $121 | -5% $8 | +0% $-105 | +5% $-218 | +10% $-330 |
|---|---|---|---|---|---|
| Rent | -10% $-346 | -5% $-225 | +0% $-105 | +5% $16 | +10% $137 |
| Rate | -1.0pp $96 | -0.5pp $-3 | base $-105 | +0.5pp $-208 | +1.0pp $-313 |
UW: 25.0% down · 7.5% · 30yr · 1.5% tax · 5.0% vac · 8.0% maint · 8.0% mgmt
Financing live
Cash to close
- Down payment
- $99,750
- Closing costs
- $11,970
- Reserves months
- —
- Total cash needed
- —
Loan-product check · same deal, 3 products live
Conventional
25% down · 7.5% · 30yr
- Down + closing
- —
- Monthly P&I
- —
- Monthly cashflow
- —
- DSCR
- —
- Eligible?
- —
Personal DTI + credit; lowest rate.
DSCR
20% down · 8.5% · 30yr
- Down + closing
- —
- Monthly P&I
- —
- Monthly cashflow
- —
- DSCR
- —
- Eligible?
- —
No personal income docs; deal must DSCR.
Hard money
10% down · 12.0% · 12mo
- Down + closing
- —
- Monthly P&I
- —
- Monthly cashflow
- —
- DSCR
- —
- Eligible?
- —
Short-term bridge; refi at stabilization.
Rent comps 10 comps
| Address | Beds | Baths | Sqft | Rent | $/sqft | DOM | Units | Dist |
|---|---|---|---|---|---|---|---|---|
| 170 Perry Creek Dr Fayetteville, GA | 4.0 | 2.5 | 2295 | $3,350 | $1.46 | 13d | 1 | 0.44mi |
| 205 Kingswood Dr Fayetteville, GA | 3.0 | 2.0 | 1820 | $2,600 | $1.43 | 45d | 1 | 0.74mi |
| 165 Redspire Ln Fayetteville, GA | 4.0 | 2.5 | 2494 | $3,399 | $1.36 | 45d | 1 | 0.76mi |
| 495 Plainfield St Fayetteville, GA | 4.0 | 3.0 | 2591 | $3,590 | $1.39 | 45d | 1 | 1.07mi |
| 135 Overlook Ct Fayetteville, GA | 4.0 | 2.5 | 2249 | $2,495 | $1.11 | 18d | 1 | 1.08mi |
| 135 Overlook Ct Fayetteville, GA | 4.0 | 2.5 | 2249 | $2,495 | $1.11 | 0d | 1 | 1.08mi |
| 245 Lockmeade Way Fayetteville, GA | 4.0 | 2.5 | 3067 | $2,899 | $0.95 | 20d | 1 | 1.26mi |
| 200 Ridge Way Fayetteville, GA | 4.0 | 3.0 | 2209 | $2,036 | $0.92 | 0d | 1 | 1.29mi |
| 240 Hollis St Fayetteville, GA | 4.0 | 3.0 | 2740 | $3,490 | $1.27 | 45d | 1 | 1.35mi |
| 165 Keaton Dr Fayetteville, GA | 4.0 | 4.0 | 3264 | $3,500 | $1.07 | 26d | 1 | 1.46mi |
Listing history 7 events
-
2026-04-16status Under Contract
-
2026-01-28price $399,000
-
2025-10-29price $415,000
-
2025-08-26$425,000 New
-
2005-05-09soldstatus $204,900
-
1987-07-31soldstatus $114,000
-
1986-08-01soldstatus $117,000
ⓘ Source: listings_history table (triggers on properties + properties_extension) + one-shot
backfill from property_details.listing_events for pre-trigger history.
Tax reassessment forecast GA · Resets to sale price
- Current annual tax
- $3,127 · $261/mo
- Projected year-2 tax
- $3,671 · $306/mo
- Expected delta
- +$543/yr (+$45/mo · 17.4%)
ⓘ Screening estimate from a state-policy table — verify with the county assessor before closing.
Climate risk First Street
- Flood 1/10 Low FEMA zone X (unshaded) · 0% chance over 30 yrs
- Wildfire 4/10 Moderate
- Heat 6/10 Major 7 d/yr ≥106°F today · 18 d/yr by 30 yrs out
- Wind 6/10 Major 27% chance of damaging wind over 30 yrs
- Air quality 3/10 Moderate 3 unhealthy d/yr today · 4 by 30 yrs out
Nearby sold comps map
Loading sold comps map…
Walkable amenities ~0.75 mi
Loading nearby amenities…
Taxation est. · year 1
- Rental income
- $36,678
- − Mortgage interest
- −$22,350
- − Property taxes
- −$3,127
- − Insurance
- −$1,995
- − Repairs & maintenance
- −$2,934
- − Management
- −$2,934
- − Depreciation
- −$11,607
- Taxable loss
- −$8,270
- Est. tax savings @ 24.0%
- +$1,985
- After-tax cash flow
- $729/yr
For passive investors: Depreciation is non-cash, so a rental often shows a tax loss while cash-flowing — sheltering income. Rental losses are passive: they offset passive income freely, and up to $25,000/yr can offset ordinary (W-2) income if you actively participate and your MAGI is under $100k (phasing out to $0 by $150k); unused losses carry forward. On sale, claimed depreciation is recaptured at up to 25%, and gains may owe capital-gains tax (a 1031 exchange can defer both). Figures are a year-1 estimate at your 24.0% rate — not tax advice; consult a CPA.
Schools (NCES district)
- District
- Fayette County
- NCES district ID
- 1302130
- Math proficiency
- 52% ▼ -12.00%
- Reading proficiency
- 60% ▼ -7.00%
- Median HH income
- $80,746
- Composite
- 50.67/100
- National rank
- #1824
- State rank
- #7 of 174 in GA
Livability — Fayetteville
- Score
- 71/100
- State rank
- #86
- US rank
- #7167
Category grades
Schools grade is shown separately in the Schools card above.
Census & demographics
- County
- Fayette County · 112,821 people
- City population
- 72,287
- Metro
- Atlanta-Sandy Springs-Alpharetta, GA
- Population (ZIP)
- 40,476
- Household income
- $118,436
- Rent vs Own
- Severe rent burden
- 415.0
Population outlook (Fayette County) Hauer SSP2
- Today (2025)
- 120,914 people
- By 2030
- 125,439 · +3.7%
- By 2040
- 132,378 · +9.5%
- By 2050
- 137,123 · +13.4%
- By 2075
- 156,091 · +29.1%
- By 2100
- 163,102 · +34.9%
Race, ethnicity, and origin ACS 2023
- Neighborhood character
- Diverse neighborhood (Simpson 0.60)
- Race & ethnicity
- White 57% Black 26% Two or more races 7% Hispanic / Latino 6% Asian 3%
- Hispanic origin (detail)
- Mexican 2% Puerto Rican 1%
- Common ancestry
- Slovak 3% Italian 2% Lithuanian 2%
- Foreign-born
- 7% · Canada, China, Vietnam
- Languages at home
- 90% English-only · Spanish 5% Other Indo-European 1% German/W. Germanic 1%
Political lean MEDSL · Fayette
- 2024 margin
- Toss-up / Even · D 48.0% · R 51.1%
- 2008→2024 swing
- +27.5pp toward D · 2008: -30.7pp · 2024: -3.1pp
- All cycles
- 2024: R+3.1 2020: R+6.8 2016: R+19.5 2012: R+31.4 2008: R+30.7
Not yet ingested
- Civics
- —
Market trends
- HPI YoY
- ▼ -146.38%
- Current HPI
- 238.3395
- Rent YoY
- ▲ 3.22%
- Metro
- Atlanta-Sandy Springs-Alpharetta, GA
- State GDP YoY
- ▲ 2.66%
- F500 in state
- 28
Industry mix (Fortune 500 HQ in GA)
| Industry | F500 HQs | Revenue |
|---|---|---|
| Paper / Packaging | 2 | $29B |
|
||
| Retail | 1 | $160B |
|
||
| Transportation / Logistics | 1 | $91B |
|
||
| Airlines | 1 | $62B |
|
||
| Consumer Goods | 1 | $47B |
|
||
| Utilities | 1 | $25B |
|
||
Price history
+241.0% since first listed7 events — show timeline
- 2026-04-16 Pending — GAMLS
- 2026-01-28 Price Changed $399,000 GAMLS
- 2025-10-29 Price Changed $415,000 GAMLS
- 2025-08-26 Listed $425,000 GAMLS
- 2005-05-09 Sold (Public Records) $204,900 Public Records
- 1987-07-31 Sold (Public Records) $114,000 Public Records
- 1986-08-01 Sold (Public Records) $117,000 Public Records
Property tax history
+1.7%/yrLatest (2025): $3,127 · +3.1% YoY. Source: county tax records.
Cash-flow waterfall
monthlySold comps — $/sqft
last 12 mo · ≤1 miLoading sold comps…