7074 Wildwood Cir Apt 165 · Louisville/Jefferson County metro government (balance), KY
Flood risk 1/10 · Minimal
- FEMA flood zone
- X (unshaded)
- Chance of flooding over 30 yrs
- 0.0%
- Est. flood insurance / yr
- $507 – $1,088
Fire risk 1/10 · Minimal
- Est. fire insurance / yr
- $839 – $1,559
Heat risk 5/10 · Moderate
- Hot days now (above 104°F)
- 7 days/yr
- Hot days in 30 yrs
- 20 days/yr
Wind risk 2/10 · Minimal
- Chance of severe wind over 30 yrs
- 3.0%
Air-quality risk 3/10 · Minor
- Unhealthy air days now
- 2 days/yr
- Unhealthy air days in 30 yrs
- 5 days/yr
Risk factors via First Street. Map © Google.
Why this score? — see what drove the D grade
The composite is a weighted blend of 9 inputs, each scored 0–100. Each bar is that input's sub-score; the figure is the points it added to the 100-point composite (weight × sub-score).
- Cash flow +12.9/30.0
- ARV discount +7.5/15.0
- 1% rule +6.1/10.0
- Rent growth +5.0/5.0
- DSCR +3.9/10.0
- Livability +2.5/5.0
- Condition / age +2.5/5.0
- Schools +2.3/10.0
- Appreciation +0.0/10.0
$148,000
🖨 Deal sheet (PDF) 📄 Offer letter ✓ Due diligence
Listing remarks MLS
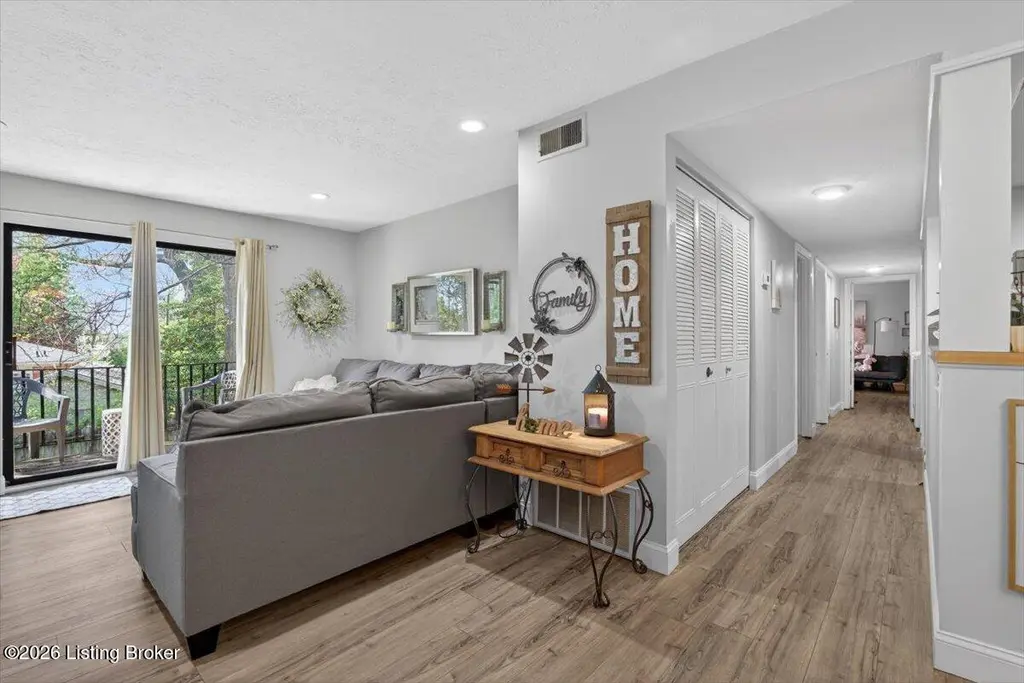
This adorable condo is minutes from shopping and entertainment! 3 bedrooms and 2 full baths. Cute balcony! At this price, this home won't last long! Call today for your private showing!
Key facts
- Newer flooring
- Nice vanities
- In unit washer dryer
Tags
Neighborhood map
What this means for you Summary
Snapshot
- This is a 3-bed/2.0-bath condo listed at $148k.
Deal economics
- At list price, monthly cash flow is $-10 ($-118/yr) — negative.
- To cash-flow at today's rent, offer at most $146k (1.2% below list).
- Meets the 1% rule at list price ($2k rent vs $148k).
- Recommended offer: $146k (1.2% below list) — sets the bar for cash-flow.
- Cap rate 6.2% vs local median 4.0% in Louisville/Jefferson County metro government (balance) — top-decile yield for the area; either an underpriced asset or a hidden risk that comps aren't pricing in. Stress-test before assuming the spread holds.
Location & tenants
- Location reads: area grade D — affects rentability + tenant quality, not the cash-flow math above.
- Jefferson County (urban): math 19% / reading 35% proficiency, ranked #121 of 165 in KY (top 73%) — low school quality limits family demand, transient renter base, plan for 1-2y turnover.
- Zoned schools: Fern Creek Elementary (math 11% / reading 27%, grade F, #599 of 676 statewide, top 89%, 712 students, 66% FRL); Newburg Middle (math 14% / reading 36%, grade F, #184 of 217 statewide, top 87%, 941 students, 64% FRL); Fern Creek High (math 20% / reading 27%, grade F, #199 of 254 statewide, top 78%, 1,688 students, 60% FRL).
- Market conditions: Rents rising fast (+15.0%/yr); 294 active listings in the ZIP; 13 comparable units currently listed for rent nearby; rentals at typical pace (median 17d on market — plan ~3-4 weeks tenant-placement turnaround); solid renter incomes; 2,836 units permitted in Jefferson County in 2024 (1,558 in 5+ unit buildings).
Forward outlook
- Local home prices are declining (-3.0%/yr); year-one equity from $1k of loan paydown is wiped out by about $4k of value loss. Plan a longer hold.
- Jefferson County population projected at +13% by 2050 — modest demand growth; plan on rents tracking national, not racing it.
Negotiation context
- Only 4 days on market — expect competitive offers; lowballing is unlikely to land.
- 4 sale attempts since 8y ago with the ask held roughly flat each time — persistent listings suggest the price (not the market) is what's stuck; bring a comps-based counter.
- Current owner paid $100k; 48% above their basis — modest negotiation headroom, anchor on the comps not their cost.
Risks & watch-outs
- Watch-outs: HOA is 20% of rent.
- Climate carrying-cost: extreme-heat days projected 7→20/yr by 2055 (HVAC capex compounding) — expect insurance premiums to compound above CPI over the hold.
Questions for the listing agent
- What do current leases actually rent for vs. the listed asking? Can we see a recent rent roll and the last 12 months of T-12 income?
- Built in 1979 — when were the roof, HVAC, electrical panel, plumbing, and water heater last replaced?
- What does the HOA fee cover, when was the last increase, and are there any pending special assessments or reserve-fund shortfalls?
- Any open or pending special assessments — roof, HVAC, plumbing, elevator, façade? What's the per-unit balance and payoff schedule, and is the seller paying it off at close or rolling it to the buyer?
- Is there a deadline driving the sale (1031 exchange, divorce, estate, relocation)? That informs how much negotiation room exists.
- The area grade is low — what's the realistic commute time and amenity access for the typical tenant pool here? Any planned neighborhood developments (good or bad) we should know about?
- What's the average days-on-market for RENTAL listings here right now (not sales)? A rising rental-DOM trend means longer vacancies and softer asking-rent achievability than the comps imply.
- What's the recent tenant-quality profile in this submarket — average credit score on applications, eviction rate, late-payment / NSF rate, and stable-employment percentage? A property-management company in the area should have these aggregated.
- How much new apartment / multifamily construction is in the pipeline within 1–3 miles? Heavy new supply (>2% of stock underway) typically softens rents 12–24 months out; light construction supports rent growth.
Investment metrics
- 1% rule
- 1.11% ✓
- Cap rate
- 6.21%
- Cash-on-cash
- -0.29%
- DSCR
- 0.99
- GRM
- 7.5
CMA / ARV
No comps found within radius.
Projected returns pro-forma
-3.0% appreciation · 8.0% rent growth · sell at horizon
- IRR
- -9.8%
- Equity multiple
- 0.62×
- Total profit
- $-15,754
- Equity at exit
- $22,067
- IRR
- 6.5%
- Equity multiple
- 1.62×
- Total profit
- $25,691
- Equity at exit
- $12,796
Cash invested: $41,440 (down + closing). Projections, not guarantees.
Landlord ↔ Tenant lean methodology
- Overall (STATE)
- 83 Strongly Landlord-Friendly
- State Kentucky
- 83 Strongly Landlord-Friendly · R+16
- County
- — inherits STATE
- City
- — inherits STATE
ZIP-level market 40291
- Rents YoY
- 15.0%
- Active inventory
- 294
- Price-to-rent
- 7.5×
Monthly cashflow live
- Estimated rent
- $1,639 high interval (Pro) →
- Mortgage (P&I)
- −$776
- Tax from tax record
- −$139 /mo · $1,663/yr
- Insurance
- −$62
- HOA
- −$328
- Vacancy / Maint / Mgmt
- −$344
- Net cashflow
- $-10
Break-even live
Sensitivity live
| Price | -10% $74 | -5% $32 | +0% $-10 | +5% $-52 | +10% $-94 |
|---|---|---|---|---|---|
| Rent | -10% $-139 | -5% $-75 | +0% $-10 | +5% $55 | +10% $120 |
| Rate | -1.0pp $65 | -0.5pp $28 | base $-10 | +0.5pp $-48 | +1.0pp $-87 |
UW: 25.0% down · 7.5% · 30yr · 1.5% tax · 5.0% vac · 8.0% maint · 8.0% mgmt
Financing live
Cash to close
- Down payment
- $37,000
- Closing costs
- $4,440
- Reserves months
- —
- Total cash needed
- —
Loan-product check · same deal, 3 products live
Conventional
25% down · 7.5% · 30yr
- Down + closing
- —
- Monthly P&I
- —
- Monthly cashflow
- —
- DSCR
- —
- Eligible?
- —
Personal DTI + credit; lowest rate.
DSCR
20% down · 8.5% · 30yr
- Down + closing
- —
- Monthly P&I
- —
- Monthly cashflow
- —
- DSCR
- —
- Eligible?
- —
No personal income docs; deal must DSCR.
Hard money
10% down · 12.0% · 12mo
- Down + closing
- —
- Monthly P&I
- —
- Monthly cashflow
- —
- DSCR
- —
- Eligible?
- —
Short-term bridge; refi at stabilization.
Rent comps 13 comps
| Address | Beds | Baths | Sqft | Rent | $/sqft | DOM | Units | Dist |
|---|---|---|---|---|---|---|---|---|
| 7008 Wildwood Cir #60 Louisville, KY | 3.0 | 2.0 | 1250 | $1,299 | $1.04 | 5d | 1 | 0.16mi |
| 5706 Bannon Crossings Dr Louisville, KY | 3.0 | 2.0 | 1255 | $2,000 | $1.59 | 25d | 1 | 0.47mi |
| 7025 Bronner Cir Louisville, KY | 1.0–2.0 | 1.0–2.5 | 1050 | $1,403 | $1.34 | 13d | 9 | 0.67mi |
| 4313 Norbrook Dr Unit 4 Louisville, KY | 2.0 | 1.0 | 725 | $950 | $1.31 | 25d | 1 | 0.89mi |
| 226 Granvil Dr Louisville, KY | 3.0 | 1.0 | 1050 | $1,800 | $1.71 | 5d | 1 | 0.97mi |
| 6003 Jo Danielle Pl Louisville, KY | 1.0–2.0 | 1.0–2.0 | 888 | $1,250 | $1.41 | 18d | 7 | 1.19mi |
| 7610 Chelsea Gardens Cir Louisville, KY | 2.0–3.0 | 2.0 | 1220 | $2,011 | $1.65 | 4d | 21 | 1.24mi |
| 5312 Poindexter Dr Louisville, KY | 1.0–3.0 | 1.0–2.0 | 824 | $1,314 | $1.59 | 4d | 7 | 1.26mi |
| 279 Granvil Dr Louisville, KY | 3.0 | 1.0 | 1280 | $1,625 | $1.27 | 22d | 1 | 1.29mi |
| 2106 Buechel Bank Rd Louisville, KY | 1.0–3.0 | 1.0 | 1000 | $1,399 | $1.40 | 5d | 7 | 1.39mi |
| 2041 Shady Grove Way Louisville, KY | 3.0 | 1.0–2.0 | 754 | $1,435 | $1.90 | 25d | 4 | 1.41mi |
| 6710 Six Mile Ln Louisville, KY | 2.0 | 1.0 | 1005 | $1,275 | $1.27 | 25d | 1 | 1.47mi |
| 6710 Six Mile Ln Louisville, KY | 2.0 | 1.0 | 1005 | $1,275 | $1.27 | 16d | 1 | 1.47mi |
HOA detail condo
- Monthly dues
- $328 · $3,936/yr
- Assessments
- None detected in remarks — confirm with the listing agent.
Listing history 14 events
-
2026-04-15status Pending
-
2026-04-10$148,000 Active
-
2021-01-05soldstatus $99,900
-
2020-12-30soldstatus $99,900 Closed 185-char remark
Show marketing remark (185 chars)
This adorable condo is minutes from shopping and entertainment! 3 bedrooms and 2 full baths. Cute balcony! At this price, this home won't last long! Call today for your private showing!
-
2020-11-28historical Active Under Contract 185-char remark
Show marketing remark (185 chars)
This adorable condo is minutes from shopping and entertainment! 3 bedrooms and 2 full baths. Cute balcony! At this price, this home won't last long! Call today for your private showing!
-
2020-11-09historical
Show marketing remark (185 chars)
This adorable condo is minutes from shopping and entertainment! 3 bedrooms and 2 full baths. Cute balcony! At this price, this home won't last long! Call today for your private showing!
-
2020-11-09price $99,900 185-char remark
Show marketing remark (185 chars)
This adorable condo is minutes from shopping and entertainment! 3 bedrooms and 2 full baths. Cute balcony! At this price, this home won't last long! Call today for your private showing!
-
2020-10-27$109,900 Active
-
2020-10-26$109,900 Active 185-char remark
Show marketing remark (185 chars)
This adorable condo is minutes from shopping and entertainment! 3 bedrooms and 2 full baths. Cute balcony! At this price, this home won't last long! Call today for your private showing!
-
2018-08-23soldstatus $92,500
-
2018-08-17soldstatus $92,500 Closed
-
2018-07-16status Pending
-
2018-06-15historical Active Under Contract
-
2018-06-13$89,900 Active
ⓘ Source: listings_history table (triggers on properties + properties_extension) + one-shot
backfill from property_details.listing_events for pre-trigger history.
Tax reassessment forecast KY · Resets to sale price
- Current annual tax
- $1,663 · $139/mo
- Projected year-2 tax
- $1,663 · $139/mo
- Expected delta
- $0/yr ($0/mo · 0.0%)
ⓘ Screening estimate from a state-policy table — verify with the county assessor before closing.
Climate risk First Street
- Flood 1/10 Low FEMA zone X (unshaded) · 0% chance over 30 yrs
- Wildfire 1/10 Low
- Heat 5/10 Major 7 d/yr ≥104°F today · 20 d/yr by 30 yrs out
- Wind 2/10 Low 3% chance of damaging wind over 30 yrs
- Air quality 3/10 Moderate 2 unhealthy d/yr today · 5 by 30 yrs out
Nearby sold comps map
Loading sold comps map…
Walkable amenities ~0.75 mi
Loading nearby amenities…
Taxation est. · year 1
- Rental income
- $19,664
- − Mortgage interest
- −$8,290
- − Property taxes
- −$1,663
- − Insurance
- −$740
- − Repairs & maintenance
- −$1,573
- − Management
- −$1,573
- − HOA
- −$3,936
- − Depreciation
- −$4,305
- Taxable loss
- −$2,418
- Est. tax savings @ 24.0%
- +$580
- After-tax cash flow
- $462/yr
For passive investors: Depreciation is non-cash, so a rental often shows a tax loss while cash-flowing — sheltering income. Rental losses are passive: they offset passive income freely, and up to $25,000/yr can offset ordinary (W-2) income if you actively participate and your MAGI is under $100k (phasing out to $0 by $150k); unused losses carry forward. On sale, claimed depreciation is recaptured at up to 25%, and gains may owe capital-gains tax (a 1031 exchange can defer both). Figures are a year-1 estimate at your 24.0% rate — not tax advice; consult a CPA.
Schools (NCES district)
- District
- Jefferson County
- NCES district ID
- 2102990
- Math proficiency
- 19% ▼ -17.00%
- Reading proficiency
- 35% ▼ -11.00%
- Median HH income
- $47,885
- Composite
- 23.45/100
- National rank
- #7884
- State rank
- #121 of 165 in KY
Livability — Louisville/Jefferson County metro government (balance)
No livability data for this city. (Only ~50 U.S. cities are tracked.)
Census & demographics
- Census place
- Louisville/Jefferson County metro government (balance), KY
- County
- Jefferson County · 790,184 people
- City population
- 419,741
- Metro
- Louisville/Jefferson County, KY-IN
- Population (ZIP)
- 41,222
- Household income
- $81,267
- Rent vs Own
- Severe rent burden
- 790.0
Population outlook (Jefferson County) Hauer SSP2
- Today (2025)
- 823,112 people
- By 2030
- 849,343 · +3.2%
- By 2040
- 895,696 · +8.8%
- By 2050
- 933,630 · +13.4%
- By 2075
- 1,028,262 · +24.9%
- By 2100
- 1,072,675 · +30.3%
Race, ethnicity, and origin ACS 2023
- Neighborhood character
- Predominantly White (66%)
- Race & ethnicity
- White 66% Black 19% Two or more races 8% Hispanic / Latino 8% Asian 3%
- Hispanic origin (detail)
- Mexican 4%
- Common ancestry
- Italian 4% Slovak 3% Lithuanian 2%
- Foreign-born
- 7% · Canada, India, Vietnam
- Languages at home
- 89% English-only · Spanish 4% Russian/Polish/Slavic 1% French/Haitian/Cajun 1%
Political lean MEDSL · Jefferson
- 2024 margin
- D (+16.6) · D 57.4% · R 40.9% · Other 1.7%
- 2008→2024 swing
- +4.5pp toward D · 2008: 12.0pp · 2024: 16.6pp
- All cycles
- 2024: D+16.6 2020: D+20.1 2016: D+13.3 2012: D+11.1 2008: D+12.0
Not yet ingested
- Civics
- —
Market trends
- HPI YoY
- ▼ -279.15%
- Current HPI
- 218.0784
- Rent YoY
- ▲ 14.96%
- Metro
- Louisville/Jefferson County, KY-IN
- State GDP YoY
- ▲ 1.81%
- F500 in state
- 4
Industry mix (Fortune 500 HQ in KY)
| Industry | F500 HQs | Revenue |
|---|---|---|
| Healthcare | 1 | $118B |
|
||
| Food / Beverage | 1 | $7B |
|
||
Price history
+64.6% since first listed14 events — show timeline
- 2026-04-15 Pending — Metro Search MLS
- 2026-04-10 Listed $148,000 Metro Search MLS
- 2021-01-05 Sold (Public Records) $99,900 Public Records
- 2020-12-30 Sold (MLS) $99,900 Metro Search MLS
- 2020-11-28 Contingent — Metro Search MLS
- 2020-11-09 Price Changed $99,900 Metro Search MLS
- 2020-11-09 Listing Removed — Metro Search MLS
- 2020-10-27 Listed $109,900 Metro Search MLS
- 2020-10-26 Listed $109,900 Metro Search MLS
- 2018-08-23 Sold (Public Records) $92,500 Public Records
- 2018-08-17 Sold (MLS) $92,500 Metro Search MLS
- 2018-07-16 Pending — Metro Search MLS
- 2018-06-15 Contingent — Metro Search MLS
- 2018-06-13 Listed $89,900 Metro Search MLS
Property tax history
+13.2%/yrLatest (2025): $1,663 · +45.4% YoY. Source: county tax records.
Cash-flow waterfall
monthlySold comps — $/sqft
last 12 mo · ≤1 miLoading sold comps…