12611 NE 145th Pl Unit H90 · Kirkland, WA
Flood risk 1/10 · Minimal
- FEMA flood zone
- X (unshaded)
- Chance of flooding over 30 yrs
- 0.0%
- Est. flood insurance / yr
- $507 – $1,088
Fire risk 1/10 · Minimal
- Est. fire insurance / yr
- $604 – $1,122
Heat risk 3/10 · Minor
- Hot days now (above 86°F)
- 7 days/yr
- Hot days in 30 yrs
- 15 days/yr
Wind risk 1/10 · Minimal
- Chance of severe wind over 30 yrs
- —
Air-quality risk 7/10 · Major
- Unhealthy air days now
- 9 days/yr
- Unhealthy air days in 30 yrs
- 10 days/yr
Risk factors via First Street. Map © Google.
Why this score? — see what drove the D- grade
The composite is a weighted blend of 9 inputs, each scored 0–100. Each bar is that input's sub-score; the figure is the points it added to the 100-point composite (weight × sub-score).
- ARV discount +15.0/15.0
- Schools +6.7/10.0
- Cash flow +4.9/30.0
- Livability +4.2/5.0
- 1% rule +3.8/10.0
- Rent growth +2.8/5.0
- Condition / age +2.5/5.0
- DSCR +0.0/10.0
- Appreciation +0.0/10.0
$269,999
🖨 Deal sheet (PDF) 📄 Offer letter ✓ Due diligence
Listing remarks
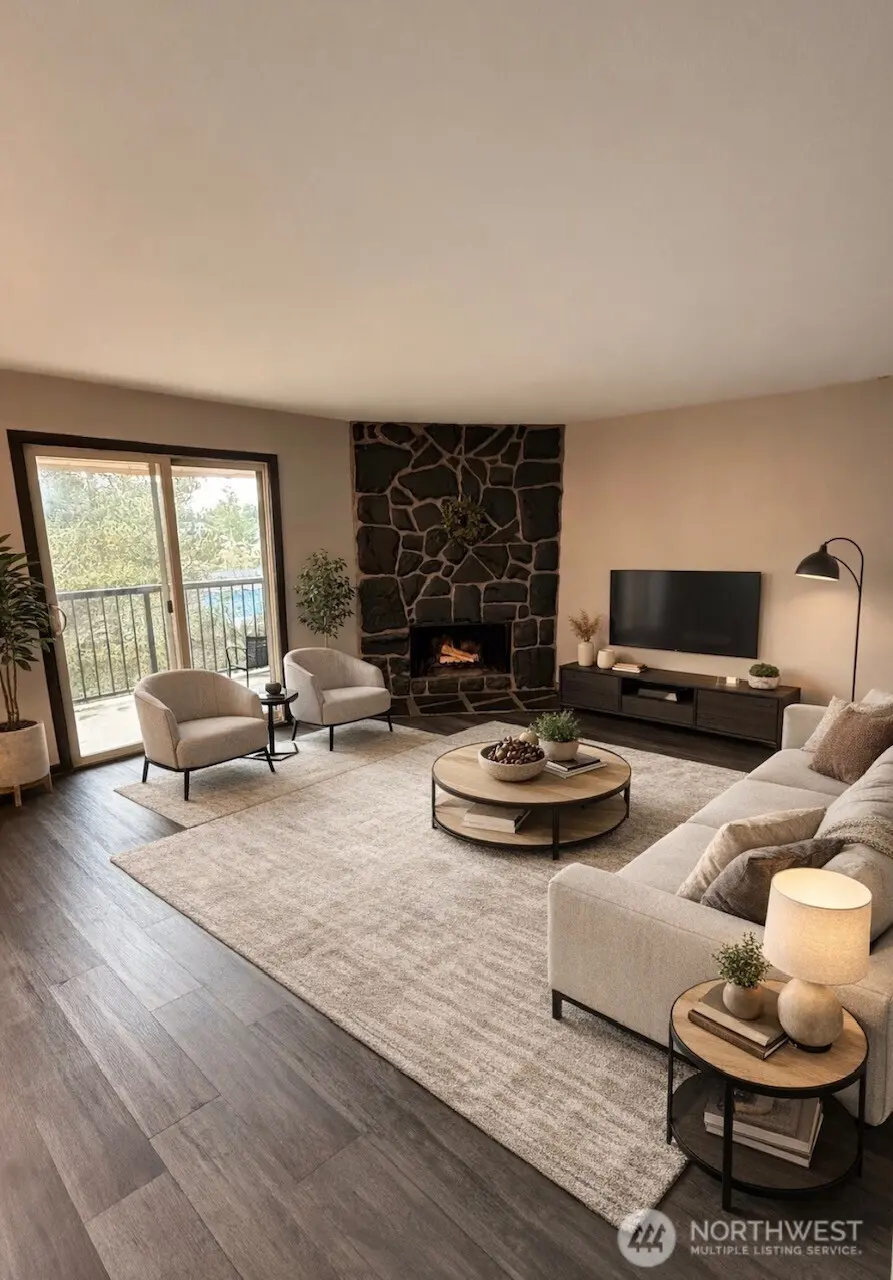
Ideal for first-time buyers or investors. Functional layout includes a wood-burning fireplace, private balcony, and washer/dryer hookups. Step into this bright, stylishly updated 2-bedroom condo in the heart of Kingsgate. Enjoy storage on the deck and in a secure storage room. The updated kitchen and bathroom shine, and walk to shopping, dining, transit, EvergreenHealth, and top-rated Northshore schools. One assigned parking spot plus guest parking. Pet-friendly, no rental cap, and well-managed community with clubhouse and play area. - MOTIVATED SELLER
Key facts
- Water heater
- Washer & dryer
- New refrigerator
Tags
Neighborhood map
What this means for you Summary
Snapshot
- This is a 2-bed/1.0-bath condo listed at $270k.
Deal economics
- At list price, monthly cash flow is $-646 ($-8k/yr) — negative.
- To cash-flow at today's rent, offer at most $177k (34.6% below list).
- To meet the 1% rule (rent ≥ 1% of price), the offer needs to be $238k (11.8% below list).
- Recommended offer: $177k (34.6% below list) — sets the bar for cash-flow.
- Cap rate 3.4% vs local median 1.1% in Kirkland — top-decile yield for the area; either an underpriced asset or a hidden risk that comps aren't pricing in. Stress-test before assuming the spread holds.
Location & tenants
- Location reads 84/100 on livability (#46 in WA, #792 nationally) — a professional / high-income tenant draw. Strengths: schools A+, commute A+, employment A+; Watch: cost of living F.
- Northshore School District (suburban): math 69% / reading 78% proficiency, ranked #9 of 291 in WA (top 3%) — strong family-tenant draw, lease renewals of 3-5y typical; only 12% free/reduced lunch — higher-income household profile.
- Market conditions: Rents rising (+1.1%/yr); 338 active listings in the ZIP; 35 comparable units currently listed for rent nearby; rentals leasing fast (median 6d on market — plan ~1-2 weeks tenant-placement turnaround); high-income renter base; 10,555 units permitted in King County in 2024 (7,119 in 5+ unit buildings).
Forward outlook
- Local home prices are declining (-3.0%/yr); year-one equity from $2k of loan paydown is wiped out by about $8k of value loss. Plan a longer hold.
- King County population projected at +44% by 2050 — long-run rental-demand tailwind backs the buy-and-hold thesis.
Negotiation context
- It's been on market 133 days — a 12% lower offer ($238k) is reasonable based on typical stale-listing flexibility.
- 7 sale attempts since 26y ago; this cycle's ask has dropped $45k (14%) from the opening price — seller is motivated, your offer sets the floor, not the list.
- Current owner paid $215k; 26% above their basis — modest negotiation headroom, anchor on the comps not their cost.
Risks & watch-outs
- Watch-outs: HOA is 28% of rent.
Questions for the listing agent
- What do current leases actually rent for vs. the listed asking? Can we see a recent rent roll and the last 12 months of T-12 income?
- It's been on market 133 days. Have you received any prior offers? Is the seller open to a 35% concession, seller financing, or rate buy-down credit?
- Built in 1979 — when were the roof, HVAC, electrical panel, plumbing, and water heater last replaced?
- What does the HOA fee cover, when was the last increase, and are there any pending special assessments or reserve-fund shortfalls?
- Any open or pending special assessments — roof, HVAC, plumbing, elevator, façade? What's the per-unit balance and payoff schedule, and is the seller paying it off at close or rolling it to the buyer?
- Why hasn't it sold? Are there any deal-killer items the seller is aware of (foundation, flood, title, zoning, code violations)?
- Is there a deadline driving the sale (1031 exchange, divorce, estate, relocation)? That informs how much negotiation room exists.
- Schools are A-rated — typically a magnet for longer-tenancy family renters. What's the average tenant stay here, and is there a school-zone premium baked into asking?
- The area grade is low — what's the realistic commute time and amenity access for the typical tenant pool here? Any planned neighborhood developments (good or bad) we should know about?
- What's the average days-on-market for RENTAL listings here right now (not sales)? A rising rental-DOM trend means longer vacancies and softer asking-rent achievability than the comps imply.
- What's the recent tenant-quality profile in this submarket — average credit score on applications, eviction rate, late-payment / NSF rate, and stable-employment percentage? A property-management company in the area should have these aggregated.
- How much new apartment / multifamily construction is in the pipeline within 1–3 miles? Heavy new supply (>2% of stock underway) typically softens rents 12–24 months out; light construction supports rent growth.
Investment metrics
- 1% rule
- 0.88% ✗
- Cap rate
- 3.42%
- Cash-on-cash
- -10.26%
- DSCR
- 0.54
- GRM
- 9.4
CMA / ARV
- ARV (median comp)
- $330,092
- List price
- $269,999
- Delta
- -18.20%
- Verdict
- UNDERPRICED
- Comps
- 20 within 1.0 mi
Projected returns pro-forma
-3.0% appreciation · 1.14% rent growth · sell at horizon
- IRR
- -37.6%
- Equity multiple
- -0.18×
- Total profit
- $-88,835
- Equity at exit
- $40,258
- IRR
- -75.5%
- Equity multiple
- -0.93×
- Total profit
- $-145,846
- Equity at exit
- $23,345
Cash invested: $75,600 (down + closing). Projections, not guarantees.
Landlord ↔ Tenant lean methodology
- Overall (STATE)
- 28 Tenant-Leaning
- State Washington
- 28 Tenant-Leaning · D+8
- County
- — inherits STATE
- City
- — inherits STATE
ZIP-level market 98034
- Rents YoY
- 1.1%
- Active inventory
- 338
- Price-to-rent
- 9.4×
Monthly cashflow live
- Estimated rent
- $2,382 high interval (Pro) →
- Mortgage (P&I)
- −$1,416
- Tax est. 1.5%
- −$337 /mo · $4,050/yr
- Insurance
- −$112
- HOA
- −$662
- Vacancy / Maint / Mgmt
- −$500
- Net cashflow
- $-646
Break-even live
Sensitivity live
| Price | -10% $-460 | -5% $-553 | +0% $-646 | +5% $-739 | +10% $-833 |
|---|---|---|---|---|---|
| Rent | -10% $-834 | -5% $-740 | +0% $-646 | +5% $-552 | +10% $-458 |
| Rate | -1.0pp $-510 | -0.5pp $-577 | base $-646 | +0.5pp $-716 | +1.0pp $-787 |
UW: 25.0% down · 7.5% · 30yr · 1.5% tax · 5.0% vac · 8.0% maint · 8.0% mgmt
Financing live
Cash to close
- Down payment
- $67,500
- Closing costs
- $8,100
- Reserves months
- —
- Total cash needed
- —
Loan-product check · same deal, 3 products live
Conventional
25% down · 7.5% · 30yr
- Down + closing
- —
- Monthly P&I
- —
- Monthly cashflow
- —
- DSCR
- —
- Eligible?
- —
Personal DTI + credit; lowest rate.
DSCR
20% down · 8.5% · 30yr
- Down + closing
- —
- Monthly P&I
- —
- Monthly cashflow
- —
- DSCR
- —
- Eligible?
- —
No personal income docs; deal must DSCR.
Hard money
10% down · 12.0% · 12mo
- Down + closing
- —
- Monthly P&I
- —
- Monthly cashflow
- —
- DSCR
- —
- Eligible?
- —
Short-term bridge; refi at stabilization.
Rent comps 35 comps
| Address | Beds | Baths | Sqft | Rent | $/sqft | DOM | Units | Dist |
|---|---|---|---|---|---|---|---|---|
| 14510 124th Ave NE Unit W64 Kirkland, WA | 2.0 | 1.0 | 923 | $2,000 | $2.17 | 21d | 1 | 0.05mi |
| 12424 NE 145th St Unit C 25 Kirkland, WA | 3.0 | 1.5 | 1052 | $2,650 | $2.52 | 44d | 1 | 0.08mi |
| 12648 NE 144th St Kirkland, WA | 1.0–2.0 | 1.0–2.0 | 812 | $2,598 | $3.20 | 2d | 9 | 0.14mi |
| 14447 127th Ln NE Kirkland, WA | 1.0 | 1.0 | 640 | $1,920 | $3.00 | 5d | 1 | 0.14mi |
| 14443 127th Ln NE Unit S7 Kirkland, WA | 1.0 | 1.0 | 640 | $1,900 | $2.97 | 44d | 1 | 0.14mi |
| 14441 127th Ln NE Unit S-2 Kirkland, WA | 2.0 | 1.0 | 923 | $2,100 | $2.28 | 25d | 1 | 0.15mi |
| 14334 126th Ave NE Unit B302 Kirkland, WA | 2.0 | 1.0 | 930 | $2,300 | $2.47 | 25d | 1 | 0.21mi |
| 12423 NE 143rd St Kirkland, WA | 2.0 | 1.0 | 846 | $2,075 | $2.45 | 5d | 2 | 0.32mi |
| 16125 Juanita Woodinville Way NE Bothell, WA | 1.0–2.0 | 1.0–2.5 | 921 | $2,800 | $3.04 | 44d | 4 | 0.99mi |
| 15515 Juanita Woodinville Way NE Bothell, WA | 1.0–2.0 | 1.0–2.0 | 999 | $2,913 | $2.91 | 0d | 12 | 1.01mi |
| 10826 NE 148th Ln Unit H102 Bothell, WA | 3.0 | 2.0 | 1084 | $2,795 | $2.58 | 44d | 1 | 1.04mi |
| 12515 NE 132nd Ct Unit A302 Kirkland, WA | 1.0 | 1.0 | 714 | $1,895 | $2.65 | 5d | 1 | 1.10mi |
| 12233 NE 131st Way Kirkland, WA | 1.0–2.0 | 1.0–2.0 | 875 | $2,539 | $2.90 | 2d | 11 | 1.14mi |
| 12429 NE 130th Ct Unit G101 Kirkland, WA | 2.0 | 1.0 | 853 | $2,600 | $3.05 | 25d | 1 | 1.18mi |
| 12904 126th Ct NE Unit J103 Kirkland, WA | 2.0 | 2.0 | 1066 | $1,950 | $1.83 | 18d | 1 | 1.21mi |
| 12717 NE 171st Ln Unit O Woodinville, WA | 2.0 | 2.0 | 950 | $2,375 | $2.50 | 11d | 1 | 1.23mi |
| 12717 NE 171st Ln Unit O Woodinville, WA | 2.0 | 2.0 | 950 | $2,375 | $2.50 | 2d | 1 | 1.23mi |
| 11400 NE 132nd St Kirkland, WA | 1.0–2.0 | 1.0–2.0 | 781 | $2,579 | $3.30 | 2d | 26 | 1.23mi |
| 12821 126th Way NE Kirkland, WA | 2.0 | 1.0 | 627 | $2,357 | $3.76 | 3d | 9 | 1.26mi |
| 13305 NE 171st St Woodinville, WA | 1.0–2.0 | 1.0–2.0 | 798 | $2,750 | $3.44 | 0d | 24 | 1.26mi |
| 11733 NE 131st Pl Kirkland, WA | 1.0–2.0 | 1.0 | 648 | $2,467 | $3.80 | 3d | 14 | 1.27mi |
| 17101 123rd Pl NE Bothell, WA | 2.0 | 2.0 | 957 | $2,500 | $2.61 | 44d | 1 | 1.27mi |
| 11903 NE 128th St #758 Kirkland, WA | 1.0 | 2.0 | 782 | $2,710 | $3.47 | 21d | 1 | 1.39mi |
| 17255 135th Ave NE Woodinville, WA | 2.0 | 1.0–2.0 | 842 | $3,704 | $4.40 | 0d | 28 | 1.40mi |
| 12414 NE 127th Ct Kirkland, WA | 1.0–2.0 | 1.0–2.0 | 821 | $2,749 | $3.35 | 25d | 1 | 1.41mi |
| 11903 NE 128th St Kirkland, WA | 1.0–2.0 | 1.0–2.0 | 772 | $3,400 | $4.40 | 25d | 2 | 1.41mi |
| 11903 NE 128th St Kirkland, WA | 1.0–2.0 | 2.0 | 919 | $3,400 | $3.70 | 44d | 1 | 1.41mi |
| 11811 NE 128th St Kirkland, WA | 1.0–2.0 | 1.0 | 818 | $3,114 | $3.81 | 2d | 13 | 1.42mi |
| 12315 NE Woodinville Dr Woodinville, WA | 1.0 | 1.0 | 610 | $1,725 | $2.83 | 3d | 2 | 1.44mi |
| 11506 NE 128th St #17 Kirkland, WA | 2.0 | 2.0 | 1095 | $2,800 | $2.56 | 11d | 1 | 1.45mi |
| 12410 NE Totem Lake Way Kirkland, WA | 4.0 | 1.0–2.0 | 745 | $1,988 | $2.67 | 44d | 1 | 1.46mi |
| 12670 120th Ave NE Kirkland, WA | 1.0–2.0 | 1.0–2.0 | 987 | $3,890 | $3.94 | 3d | 12 | 1.46mi |
| 17409 133rd Ave NE Woodinville, WA | 1.0–3.0 | 1.0–2.0 | 1178 | $3,199 | $2.71 | 0d | 26 | 1.46mi |
| 12655 120th Ave NE Kirkland, WA | 2.0 | 1.0–2.0 | 760 | $3,505 | $4.61 | 2d | 9 | 1.47mi |
| 12109 Woodinville Dr Bothell, WA | 1.0–3.0 | 1.0–2.0 | 965 | $2,322 | $2.41 | 5d | 7 | 1.49mi |
HOA detail condo
- Monthly dues
- $662 · $7,944/yr
- Likely covers
- parking
- Assessments
- None detected in remarks — confirm with the listing agent.
Listing history 38 events
-
2026-06-18days on market $269,999 Active 133 DOM
-
2026-06-17days on market $269,999 Active 132 DOM
-
2026-06-16days on market $269,999 Active 131 DOM
-
2026-06-15days on market $269,999 Active 130 DOM
-
2026-06-13days on market $269,999 Active 128 DOM
-
2026-06-13pricedays on market $269,999 Active 127 DOM
-
2026-06-09days on market $280,000 Active 124 DOM
-
2026-06-08days on market $280,000 Active 123 DOM
-
2026-06-07days on market $280,000 Active 122 DOM
-
2026-06-04days on market $280,000 Active 119 DOM
-
2026-06-03days on market $280,000 Active 118 DOM
-
2026-06-02days on market $280,000 Active 117 DOM
-
2026-06-01days on market $280,000 Active 116 DOM
-
2026-05-31days on market $280,000 Active 115 DOM
-
2026-04-27price $280,000
-
2026-03-20price $304,000
-
2026-03-16price $309,000
-
2026-03-06price $309,999
-
2026-02-05$314,999 Active
-
2019-10-03soldstatus $215,000 Sold
-
2019-08-31status Pending
-
2019-08-19price $215,000
-
2019-07-24status Active
-
2019-07-04status Pending
-
2019-07-04historical Taken Off Market
-
2019-06-20price $229,950
-
2019-06-05$239,950 Active
-
2015-09-16soldstatus $127,720 Sold
-
2015-07-27status Pending
-
2015-07-21price $124,000
-
2015-07-21status Active
-
2015-07-08status Pending Inspection
-
2015-06-29$120,000 Active
-
2005-02-24soldstatus $104,000 Closed
-
2005-01-26historical
-
2005-01-14$104,888
-
2000-12-21soldstatus $99,500
-
2000-11-20$99,500
ⓘ Source: listings_history table (triggers on properties + properties_extension) + one-shot
backfill from property_details.listing_events for pre-trigger history.
Climate risk First Street
- Flood 1/10 Low FEMA zone X (unshaded) · 0% chance over 30 yrs
- Wildfire 1/10 Low
- Heat 3/10 Moderate 7 d/yr ≥86°F today · 15 d/yr by 30 yrs out
- Wind 1/10 Low
- Air quality 7/10 Severe 9 unhealthy d/yr today · 10 by 30 yrs out
Nearby sold comps map
Loading sold comps map…
Walkable amenities ~0.75 mi
Loading nearby amenities…
Taxation est. · year 1
- Rental income
- $28,584
- − Mortgage interest
- −$15,124
- − Property taxes
- −$4,050
- − Insurance
- −$1,350
- − Repairs & maintenance
- −$2,287
- − Management
- −$2,287
- − HOA
- −$7,944
- − Depreciation
- −$7,855
- Taxable loss
- −$12,312
- Est. tax savings @ 24.0%
- +$2,955
- After-tax cash flow
- $-4,798/yr
For passive investors: Depreciation is non-cash, so a rental often shows a tax loss while cash-flowing — sheltering income. Rental losses are passive: they offset passive income freely, and up to $25,000/yr can offset ordinary (W-2) income if you actively participate and your MAGI is under $100k (phasing out to $0 by $150k); unused losses carry forward. On sale, claimed depreciation is recaptured at up to 25%, and gains may owe capital-gains tax (a 1031 exchange can defer both). Figures are a year-1 estimate at your 24.0% rate — not tax advice; consult a CPA.
Schools (NCES district)
- District
- Northshore School District
- NCES district ID
- 5305910
- Math proficiency
- 69% ▼ -3.00%
- Reading proficiency
- 78% ▼ -1.00%
- Median HH income
- $92,951
- Composite
- 67.41/100
- National rank
- #826
- State rank
- #9 of 291 in WA
Livability — Kirkland
- Score
- 84/100
- State rank
- #46
- US rank
- #792
Category grades
Schools grade is shown separately in the Schools card above.
Census & demographics
- Census place
- Kirkland, WA
- County
- King County · 2,251,916 people
- City population
- 93,513
- Metro
- Seattle-Tacoma-Bellevue, WA
- Population (ZIP)
- 52,531
- Household income
- $135,219
- Rent vs Own
- Severe rent burden
- 1830.0
Population outlook (King County) Hauer SSP2
- Today (2025)
- 2,576,485 people
- By 2030
- 2,803,316 · +8.8%
- By 2040
- 3,255,921 · +26.4%
- By 2050
- 3,706,444 · +43.9%
- By 2075
- 4,746,063 · +84.2%
- By 2100
- 5,407,730 · +109.9%
Race, ethnicity, and origin ACS 2023
- Neighborhood character
- Diverse neighborhood (Simpson 0.56)
- Race & ethnicity
- White 64% Asian 17% Two or more races 10% Hispanic / Latino 9% Black 2%
- Hispanic origin (detail)
- Mexican 6%
- Common ancestry
- Italian 3% Portuguese 3% Lithuanian 3%
- Foreign-born
- 26% · Canada, China, Vietnam
- Languages at home
- 70% English-only · Other Indo-European 8% Spanish 7% Chinese 5%
Political lean MEDSL · King
- 2024 margin
- Solid D (+51.7) · D 74.2% · R 22.5% · Other 3.4%
- 2008→2024 swing
- +9.6pp toward D · 2008: 42.1pp · 2024: 51.7pp
- All cycles
- 2024: D+51.7 2020: D+52.7 2016: D+50.4 2012: D+39.9 2008: D+42.1
Not yet ingested
- Civics
- —
Market trends
- HPI YoY
- ▼ -1281.53%
- Current HPI
- 442.5372
- Rent YoY
- ▲ 1.14%
- Metro
- Seattle-Tacoma-Bellevue, WA
- State GDP YoY
- ▲ 4.65%
- F500 in state
- 22
Industry mix (Fortune 500 HQ in WA)
| Industry | F500 HQs | Revenue |
|---|---|---|
| Retail | 2 | $269B |
|
||
| Technology / Retail | 1 | $638B |
|
||
| Technology | 1 | $245B |
|
||
| Telecommunications | 1 | $38B |
|
||
| Food / Beverage | 1 | $36B |
|
||
| Automotive / Trucks | 1 | $34B |
|
||
Price history
+181.4% since first listed24 events — show timeline
- 2026-04-27 Price Changed $280,000 NWMLS as Distributed by MLS Grid
- 2026-03-20 Price Changed $304,000 NWMLS as Distributed by MLS Grid
- 2026-03-16 Price Changed $309,000 NWMLS as Distributed by MLS Grid
- 2026-03-06 Price Changed $309,999 NWMLS as Distributed by MLS Grid
- 2026-02-05 Listed $314,999 NWMLS as Distributed by MLS Grid
- 2019-10-03 Sold (MLS) $215,000 NWMLS as Distributed by MLS Grid
- 2019-08-31 Pending — NWMLS as Distributed by MLS Grid
- 2019-08-19 Price Changed $215,000 NWMLS as Distributed by MLS Grid
- 2019-07-24 Relisted — NWMLS as Distributed by MLS Grid
- 2019-07-04 Pending — NWMLS as Distributed by MLS Grid
- 2019-07-04 Delisted — NWMLS as Distributed by MLS Grid
- 2019-06-20 Price Changed $229,950 NWMLS as Distributed by MLS Grid
- 2019-06-05 Listed $239,950 NWMLS as Distributed by MLS Grid
- 2015-09-16 Sold (MLS) $127,720 NWMLS as Distributed by MLS Grid
- 2015-07-27 Pending — NWMLS as Distributed by MLS Grid
- 2015-07-21 Relisted — NWMLS as Distributed by MLS Grid
- 2015-07-21 Price Changed $124,000 NWMLS as Distributed by MLS Grid
- 2015-07-08 Pending — NWMLS as Distributed by MLS Grid
- 2015-06-29 Listed $120,000 NWMLS as Distributed by MLS Grid
- 2005-02-24 Sold (MLS) $104,000 NWMLS as Distributed by MLS Grid
- 2005-01-26 Delisted — NWMLS as Distributed by MLS Grid
- 2005-01-14 Listed $104,888 NWMLS as Distributed by MLS Grid
- 2000-12-21 Sold (MLS) $99,500 NWMLS as Distributed by MLS Grid
- 2000-11-20 Listed $99,500 NWMLS as Distributed by MLS Grid
Cash-flow waterfall
monthlySold comps — $/sqft
last 12 mo · ≤1 miLoading sold comps…