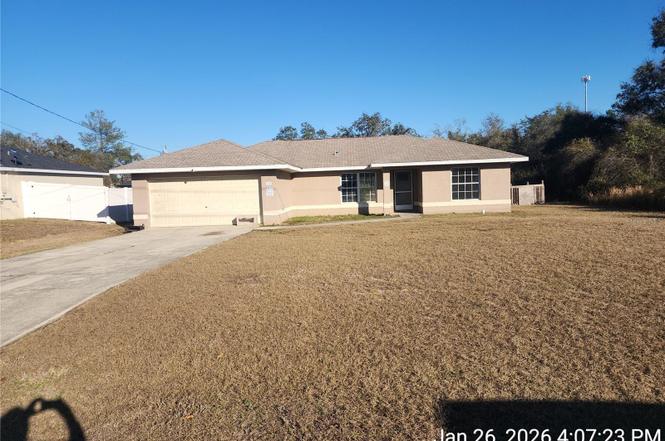
32 Cypress Rd · Silver Springs Shores, FL
Flood risk 1/10 · Minimal
- FEMA flood zone
- X (unshaded)
- Chance of flooding over 30 yrs
- 0.0%
- Est. flood insurance / yr
- $507 – $1,088
Fire risk 5/10 · Moderate
- Est. fire insurance / yr
- $947 – $1,759
Heat risk 8/10 · Major
- Hot days now (above 108°F)
- 7 days/yr
- Hot days in 30 yrs
- 21 days/yr
Wind risk 9/10 · Severe
- Chance of severe wind over 30 yrs
- 99.0%
Air-quality risk 3/10 · Minor
- Unhealthy air days now
- 3 days/yr
- Unhealthy air days in 30 yrs
- 4 days/yr
Risk factors via First Street. Map © Google.
Why this score? — see what drove the C+ grade
The composite is a weighted blend of 9 inputs, each scored 0–100. Each bar is that input's sub-score; the figure is the points it added to the 100-point composite (weight × sub-score).
- Cash flow +16.4/30.0
- ARV discount +15.0/15.0
- Appreciation +8.0/10.0
- DSCR +5.1/10.0
- 1% rule +4.9/10.0
- Schools +3.6/10.0
- Livability +3.4/5.0
- Rent growth +2.5/5.0
- Condition / age +2.5/5.0
$184,900
🖨 Deal sheet 📄 Offer letter ✓ Due diligence
Listing remarks MLS
APPROVED SHORT SALE ON THIS 2007 BUILT 3/2/2, NICE LOT, PRIVATE SETTING. SPLIT BEDROOM PLAN WITH OPEN KITCHEN TO DINNING AND LIVING ROOM. INSIDE LAUNDRY, HIGH CEILINGS, 2 CAR GARAGE.
Key facts
- Open floor plan
- Easy access
- Large backyard
Tags
Neighborhood map
What this means for you Summary
Snapshot
- This is a 3-bed/2.0-bath single-family listed at $185k.
Deal economics
- At list price, monthly cash flow is $104 ($1k/yr) — positive.
- The deal already cash-flows at list — no discount required.
- To meet the 1% rule (rent ≥ 1% of price), the offer needs to be $182k (1.4% below list).
- Recommended offer: $182k (1.5% below list) — sets the bar for market timing.
Location & tenants
- Location reads 68/100 on livability (#527 in FL) — a middle-class / working-renter tenant base. Strengths: cost of living A+, housing A+, health & safety A-; Watch: crime C-, employment D, amenities F.
- Marion (rural): math 42% / reading 43% proficiency, ranked #61 of 73 in FL (top 84%) — families likely to look elsewhere, expect single-tenant / working-renter base with shorter leases; 61% free/reduced lunch — lower-income household profile, screen leases tightly.
- Zoned schools: Emerald Shores Elementary School (math 30% / reading 34%, grade F, #1,797 of 2,144 statewide, top 86%, 666 students, 74% FRL); Lake Weir High School (math 23% / reading 34%, grade F, #458 of 667 statewide, top 69%, 1,483 students, 68% FRL).
- Zoned-school proficiency averages 30% at this address vs 42% district-wide (-12 pts) — the specific schools serving this property underperform the Marion average; the district grade overstates school quality for this exact location.
- Market conditions: Rents flat; 674 active listings in the ZIP; 9 comparable units currently listed for rent nearby; rentals leasing fast (median 14d on market — plan ~1-2 weeks tenant-placement turnaround); 7,071 units permitted in Marion County in 2024 (534 in 5+ unit buildings).
Forward outlook
- In year one you build about $12k of equity ($1k loan paydown + $11k appreciation (5.9% local appreciation)).
- Marion County population projected at +13% by 2050 — modest demand growth; plan on rents tracking national, not racing it.
- At projected returns (5.9% appreciation + 0.2% rent growth), your $52k cash investment doubles in ~4 years — after that, you're playing with house money.
- By year 3, paydown + projected appreciation supports a ~$30k cash-out refi (75% LTV) — recoverable capital for the next deal without selling this one.
Negotiation context
- It's been on market 19 days — a 2% lower offer ($182k) is reasonable based on typical stale-listing flexibility.
- 3 sale attempts since 23y ago with the ask held roughly flat each time — persistent listings suggest the price (not the market) is what's stuck; bring a comps-based counter.
- Current owner paid $73k; list at $185k implies a 153% gain — meaningful room to come down on a strong offer.
Risks & watch-outs
- Climate carrying-cost: severe wind risk, 99% chance of damaging wind over 30y; moderate wildfire risk; extreme-heat days projected 7→21/yr by 2055 (HVAC capex compounding) — expect insurance premiums to compound above CPI over the hold.
Questions for the listing agent
- Is there a deadline driving the sale (1031 exchange, divorce, estate, relocation)? That informs how much negotiation room exists.
- Schools are F-rated, which usually means shorter tenancies and higher turnover. Who's the typical renter profile here, and what's been the actual vacancy rate?
- What's the average days-on-market for RENTAL listings here right now (not sales)? A rising rental-DOM trend means longer vacancies and softer asking-rent achievability than the comps imply.
- What's the recent tenant-quality profile in this submarket — average credit score on applications, eviction rate, late-payment / NSF rate, and stable-employment percentage? A property-management company in the area should have these aggregated.
- How much new for-sale + rental construction is in the pipeline within 1–3 miles? Heavy new supply typically softens prices + rents 12–24 months out; constrained supply supports both.
Investment metrics
- 1% rule
- 0.99% ✗
- Cap rate
- 6.97%
- Cash-on-cash
- 2.41%
- DSCR
- 1.11
- GRM
- 8.5
CMA / ARV
- ARV (on-the-fly)
- $256,056
- Comps found
- 12
Show comp detail 12 sales within ~0.75 mi
| Address | Dist | Beds/Ba | Sqft | Sold | Price | $/sf | Match |
|---|---|---|---|---|---|---|---|
| 200 Oak Lane Cir | 0.13mi | 3/2.0 | 1,331 (-2%) | 3mo | $249,900 | $188 | 88 |
| 42 Olive Dr | 0.40mi | 3/2.0 | 1,336 (-2%) | 2mo | $196,000 | $147 | 76 |
| 80 Olive Dr | 0.30mi | 3/2.0 | 1,400 (+3%) | 7mo | $265,000 | $189 | 75 |
| 21 Holly Rd | 0.06mi | 3/2.0 | 1,471 (+8%) | 18mo | $279,900 | $190 | 69 |
| 73 Olive Rd | 0.44mi | 3/2.0 | 1,361 (-0%) | 13mo | $245,000 | $180 | 69 |
| 6 Emerald Trail Run | 0.36mi | 3/2.0 | 1,232 (-10%) | 1mo | $218,000 | $177 | 66 |
| 216 Oak Ln | 0.12mi | 3/2.0 | 1,232 (-10%) | 21mo | $236,000 | $192 | 61 |
| 11 Elm Loop | 0.42mi | 3/2.0 | 1,232 (-10%) | 17mo | $232,500 | $189 | 50 |
| 23 Oak Pass Loop | 0.38mi | 3/2.0 | 1,557 (+14%) | 11mo | $269,000 | $173 | 49 |
| 8 Oak Circle Crse | 0.69mi | 3/2.0 | 1,342 (-2%) | 24mo | $215,000 | $160 | 46 |
| 17 Oak Trl | 0.58mi | 3/2.0 | 1,453 (+7%) | 21mo | $285,400 | $196 | 44 |
| 49 Oak Pass Loop | 0.53mi | 3/2.0 | 1,192 (-12%) | 14mo | $195,000 | $164 | 43 |
Match score weights: distance 35% · size 25% · config 20% · recency 20%. Top-matched comps best support the ARV.
Projected returns pro-forma
5.93% appreciation · 0.17% rent growth · sell at horizon
- IRR
- 15.9%
- Equity multiple
- 2.05×
- Total profit
- $54,295
- Equity at exit
- $115,448
- IRR
- 14.9%
- Equity multiple
- 3.81×
- Total profit
- $145,709
- Equity at exit
- $208,684
Cash invested: $51,772 (down + closing). Projections, not guarantees.
Landlord ↔ Tenant lean methodology
- Overall (STATE)
- 87 Strongly Landlord-Friendly
- State Florida
- 87 Strongly Landlord-Friendly · R+3
- County
- — inherits STATE
- City
- — inherits STATE
ZIP-level market 34472
- Home prices YoY
- 2.4%
- Rents YoY
- 0.2%
- Active inventory
- 674
- Price-to-rent
- 8.5×
Monthly cashflow live
- Estimated rent
- $1,823 high interval (Pro) →
- Mortgage (P&I)
- −$970
- Tax from tax record
- −$289 /mo · $3,470/yr
- Insurance
- −$77
- HOA
- −$0
- Vacancy / Maint / Mgmt
- −$383
- Net cashflow
- $104
Break-even live
UW: 25.0% down · 7.5% · 30yr · 1.5% tax · 5.0% vac · 8.0% maint · 8.0% mgmt
Financing live
Cash to close
- Down payment
- $46,225
- Closing costs
- $5,547
- Reserves months
- —
- Total cash needed
- —
Loan-product check · same deal, 3 products live
Conventional
25% down · 7.5% · 30yr
- Down + closing
- —
- Monthly P&I
- —
- Monthly cashflow
- —
- DSCR
- —
- Eligible?
- —
Personal DTI + credit; lowest rate.
DSCR
20% down · 8.5% · 30yr
- Down + closing
- —
- Monthly P&I
- —
- Monthly cashflow
- —
- DSCR
- —
- Eligible?
- —
No personal income docs; deal must DSCR.
Hard money
10% down · 12.0% · 12mo
- Down + closing
- —
- Monthly P&I
- —
- Monthly cashflow
- —
- DSCR
- —
- Eligible?
- —
Short-term bridge; refi at stabilization.
Rent comps 9 comps
| Address | Beds | Baths | Sqft | Rent | $/sqft | DOM | Units | Dist |
|---|---|---|---|---|---|---|---|---|
| 226 Oak Cir Ocala, FL | 3.0 | 2.0 | 1406 | $1,675 | $1.19 | 13d | 1 | 0.13mi |
| 2 Ash Dr Ocala, FL | 3.0 | 2.0 | 1083 | $1,750 | $1.62 | 13d | 1 | 0.25mi |
| 8 Ash Pass Run Ocala, FL | 3.0 | 2.0 | 1128 | $1,650 | $1.46 | 21d | 1 | 0.36mi |
| 5 Olive Dr Ocala, FL | 3.0 | 2.0 | 1450 | $1,800 | $1.24 | 21d | 1 | 0.65mi |
| 106 Oak Cir Ocala, FL | 3.0 | 2.0 | 1453 | $1,795 | $1.24 | 13d | 1 | 0.74mi |
| 21 Olive Cir Ocala, FL | 3.0 | 2.0 | 1459 | $1,800 | $1.23 | 13d | 1 | 0.83mi |
| 60 Bahia Court Trak Ocala, FL | 3.0 | 2.0 | 1413 | $1,695 | $1.20 | 21d | 1 | 1.12mi |
| 12 Spring Loop Ocala, FL | 2.0 | 1.0 | 900 | $1,350 | $1.50 | 13d | 1 | 1.12mi |
| 27 Sapphire Run Ocala, FL | 3.0 | 2.0 | 1255 | $1,500 | $1.20 | 21d | 1 | 1.21mi |
Listing history 9 events
-
2026-04-01status Pending
-
2026-03-13$184,900 Active
-
2016-12-22soldstatus $73,000
-
2010-09-27soldstatus $62,000
-
2010-09-24soldstatus $62,000 182-char remark
Show marketing remark (182 chars)
APPROVED SHORT SALE ON THIS 2007 BUILT 3/2/2, NICE LOT, PRIVATE SETTING. SPLIT BEDROOM PLAN WITH OPEN KITCHEN TO DINNING AND LIVING ROOM. INSIDE LAUNDRY, HIGH CEILINGS, 2 CAR GARAGE.
-
2010-03-08$68,000 182-char remark
Show marketing remark (182 chars)
APPROVED SHORT SALE ON THIS 2007 BUILT 3/2/2, NICE LOT, PRIVATE SETTING. SPLIT BEDROOM PLAN WITH OPEN KITCHEN TO DINNING AND LIVING ROOM. INSIDE LAUNDRY, HIGH CEILINGS, 2 CAR GARAGE.
-
2005-08-26soldstatus $191,400
-
2004-01-30historical
-
2003-02-27$4,800
ⓘ Source: listings_history table (triggers on properties + properties_extension) + one-shot
backfill from property_details.listing_events for pre-trigger history.
Tax reassessment forecast FL · Resets to sale price
- Current annual tax
- $3,470 · $289/mo
- Projected year-2 tax
- $3,470 · $289/mo
- Expected delta
- $0/yr ($0/mo · 0.0%)
ⓘ Screening estimate from a state-policy table — verify with the county assessor before closing.
Climate risk First Street
- Flood 1/10 Low FEMA zone X (unshaded) · 0% chance over 30 yrs
- Wildfire 5/10 Major
- Heat 8/10 Severe 7 d/yr ≥108°F today · 21 d/yr by 30 yrs out
- Wind 9/10 Extreme 99% chance of damaging wind over 30 yrs
- Air quality 3/10 Moderate 3 unhealthy d/yr today · 4 by 30 yrs out
Nearby sold comps map
Loading sold comps map…
Walkable amenities ~0.75 mi
Loading nearby amenities…
Taxation est. · year 1
- Rental income
- $21,873
- − Mortgage interest
- −$10,357
- − Property taxes
- −$3,470
- − Insurance
- −$924
- − Repairs & maintenance
- −$1,750
- − Management
- −$1,750
- − Depreciation
- −$5,379
- Taxable loss
- −$1,757
- Est. tax savings @ 24.0%
- +$422
- After-tax cash flow
- $1,672/yr
For passive investors: Depreciation is non-cash, so a rental often shows a tax loss while cash-flowing — sheltering income. Rental losses are passive: they offset passive income freely, and up to $25,000/yr can offset ordinary (W-2) income if you actively participate and your MAGI is under $100k (phasing out to $0 by $150k); unused losses carry forward. On sale, claimed depreciation is recaptured at up to 25%, and gains may owe capital-gains tax (a 1031 exchange can defer both). Figures are a year-1 estimate at your 24.0% rate — not tax advice; consult a CPA.
Schools (NCES district)
- District
- Marion
- NCES district ID
- 1201260
- Math proficiency
- 42% ▼ -7.00%
- Reading proficiency
- 43% ▼ -4.00%
- Median HH income
- $40,015
- Composite
- 35.61/100
- National rank
- #4890
- State rank
- #61 of 73 in FL
Livability — Silver Springs Shores
- Score
- 68/100
- State rank
- #527
- US rank
- #9854
Category grades
Schools grade is shown separately in the Schools card above.
Census & demographics
- Census place
- Silver Springs Shores, FL
- County
- Marion County · 315,796 people
- City population
- 34,665
- Metro
- Ocala, FL
- Population (ZIP)
- 35,851
- Household income
- $64,208
- Rent vs Own
- Severe rent burden
- 655.0
Population outlook (Marion County) Hauer SSP2
- Today (2025)
- 365,905 people
- By 2030
- 376,768 · +3.0%
- By 2040
- 396,555 · +8.4%
- By 2050
- 412,723 · +12.8%
- By 2075
- 446,090 · +21.9%
- By 2100
- 436,193 · +19.2%
Race, ethnicity, and origin ACS 2023
- Neighborhood character
- Diverse neighborhood (Simpson 0.65)
- Race & ethnicity
- White 50% Hispanic / Latino 25% Black 21% Two or more races 18% Asian 2%
- Hispanic origin (detail)
- Mexican 2% Puerto Rican 14% Cuban 3%
- Common ancestry
- Romanian 2% Iranian 1% Lithuanian 1%
- Foreign-born
- 11% · Canada, Jamaica, China
- Languages at home
- 78% English-only · Spanish 19% Other Indo-European 1%
Political lean MEDSL · Marion
- 2024 margin
- Solid R (+31.6) · D 33.8% · R 65.5%
- 2008→2024 swing
- -20.0pp toward R · 2008: -11.6pp · 2024: -31.6pp
- All cycles
- 2024: R+31.6 2020: R+25.9 2016: R+26.2 2012: R+16.2 2008: R+11.6
Not yet ingested
- Civics
- —
Market trends
- HPI YoY
- ▲ 5.93%
- Current HPI
- 255.0714
- Rent YoY
- ▲ 0.17%
- Metro
- Ocala, FL
- State GDP YoY
- ▲ 3.28%
- F500 in state
- 36
Industry mix (Fortune 500 HQ in FL)
| Industry | F500 HQs | Revenue |
|---|---|---|
| Industrial Technology | 2 | $29B |
|
||
| Insurance | 2 | $17B |
|
||
| Retail | 1 | $60B |
|
||
| Technology Distribution | 1 | $58B |
|
||
| Homebuilding | 1 | $35B |
|
||
| Technology Manufacturing | 1 | $35B |
|
||
Price history
+3752.1% since first listed9 events — show timeline
- 2026-04-01 Pending — Stellar MLS as Distributed by MLS Grid
- 2026-03-13 Listed $184,900 Stellar MLS as Distributed by MLS Grid
- 2016-12-22 Sold (Public Records) $73,000 Public Records
- 2010-09-27 Sold (Public Records) $62,000 Public Records
- 2010-09-24 Sold (MLS) $62,000 Stellar MLS as Distributed by MLS Grid
- 2010-03-08 Listed $68,000 Stellar MLS as Distributed by MLS Grid
- 2005-08-26 Sold (Public Records) $191,400 Public Records
- 2004-01-30 Listing Removed — Stellar MLS as Distributed by MLS Grid
- 2003-02-27 Listed $4,800 Stellar MLS as Distributed by MLS Grid
Property tax history
+14.0%/yrLatest (2025): $3,470 · +14.8% YoY. Source: county tax records.
Cash-flow waterfall
monthlySold comps — $/sqft
last 12 mo · ≤1 miLoading sold comps…