709-711 Fruit Way · McKees Rocks, PA
Flood risk 1/10 · Minimal
- FEMA flood zone
- X (unshaded)
- Chance of flooding over 30 yrs
- 0.0%
- Est. flood insurance / yr
- $473 – $860
Fire risk 1/10 · Minimal
- Est. fire insurance / yr
- $511 – $949
Heat risk 4/10 · Minor
- Hot days now (above 98°F)
- 7 days/yr
- Hot days in 30 yrs
- 17 days/yr
Wind risk 2/10 · Minimal
- Chance of severe wind over 30 yrs
- —
Air-quality risk 3/10 · Minor
- Unhealthy air days now
- 3 days/yr
- Unhealthy air days in 30 yrs
- 3 days/yr
Risk factors via First Street. Map © Google.
Why this score? — see what drove the C+ grade
The composite is a weighted blend of 9 inputs, each scored 0–100. Each bar is that input's sub-score; the figure is the points it added to the 100-point composite (weight × sub-score).
- Cash flow +30.0/30.0
- 1% rule +10.0/10.0
- DSCR +10.0/10.0
- Rent growth +5.0/5.0
- Livability +4.1/5.0
- Condition / age +2.5/5.0
- Schools +0.9/10.0
- ARV discount +0.0/15.0
- Appreciation +0.0/10.0
$59,900
🖨 Deal sheet (PDF) 📄 Offer letter ✓ Due diligence
Listing remarks MLS
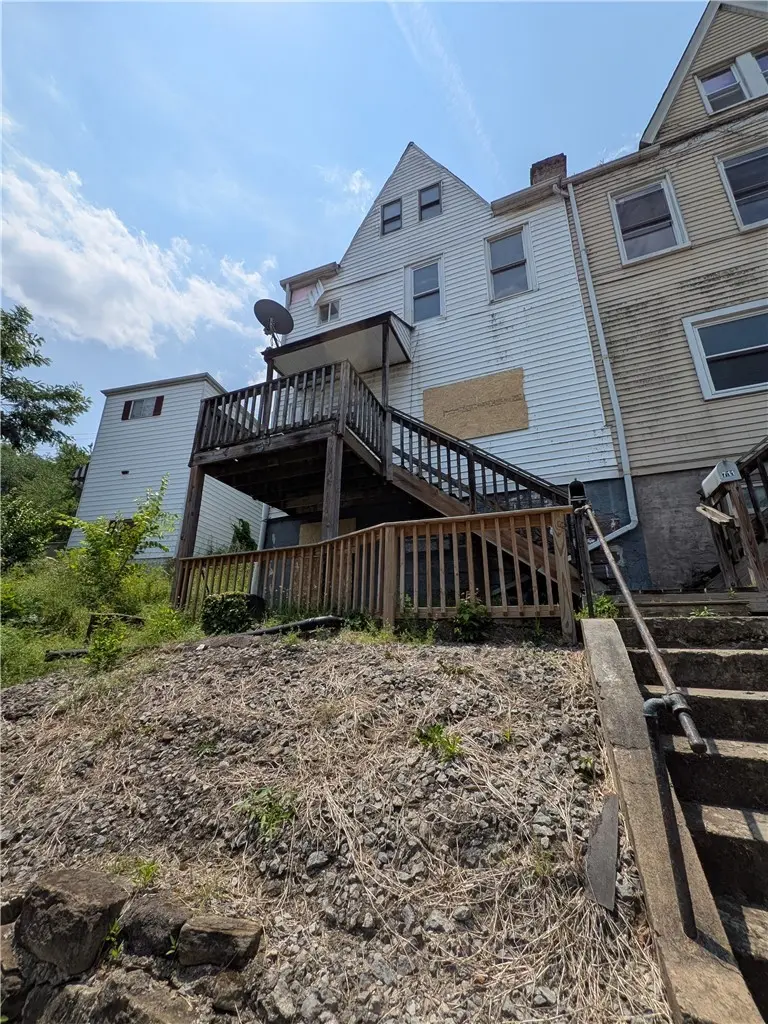
Total of 3 units within 2 building. Being sold as-is. Could be a cash cow for the right buyer. Each unit is a 3-bed, 1-bath. Property is NOT zoned as a 3-unit. Buyer is responsible for all municipal requirements and zoning.
Key facts
- 3,824 sq ft lot
- Parking
- Built 1900
Neighborhood map
What this means for you Summary
Snapshot
- This is a 3-bed/1.5-bath single-family listed at $60k.
Deal economics
- At list price, monthly cash flow is $705 ($8k/yr) — positive.
- The deal already cash-flows at list — no discount required.
- Meets the 1% rule at list price ($2k rent vs $60k).
- Recommended offer: $55k (9.0% below list) — sets the bar for market timing.
- Cap rate 20.4% vs local median 10.0% in McKees Rocks — top-decile yield for the area; either an underpriced asset or a hidden risk that comps aren't pricing in. Stress-test before assuming the spread holds.
Location & tenants
- Location reads 82/100 on livability (#143 in PA, #1,154 nationally) — a professional / high-income tenant draw. Strengths: amenities A+, commute A+, cost of living A+; Watch: schools F, employment F.
- Sto-Rox SD (suburban): math 4% / reading 18% proficiency, ranked #532 of 539 in PA (top 99%) — low school quality limits family demand, transient renter base, plan for 1-2y turnover; 77% free/reduced lunch — lower-income household profile, screen leases tightly.
- Market conditions: Rents rising fast (+13.1%/yr); 127 active listings in the ZIP; 9 comparable units currently listed for rent nearby; rentals at typical pace (median 25d on market — plan ~3-4 weeks tenant-placement turnaround); 2,996 units permitted in Allegheny County in 2024 (1,588 in 5+ unit buildings).
Forward outlook
- Local home prices are declining (-3.0%/yr); year-one equity from $414 of loan paydown is wiped out by about $2k of value loss. Plan a longer hold.
- At projected returns (-3.0% appreciation + 8.0% rent growth), your $17k cash investment doubles in ~3 years — after that, you're playing with house money.
Negotiation context
- It's been on market 91 days — a 9% lower offer ($55k) is reasonable based on typical stale-listing flexibility.
- 7 sale attempts since 32y ago; this cycle's ask has dropped $15k (20%) from the opening price — seller is motivated, your offer sets the floor, not the list.
- Current owner paid $37k; list at $60k implies a 62% gain — meaningful room to come down on a strong offer.
Risks & watch-outs
- Watch-outs: property tax is 2.9% of price; built in 1900 — expect roof / HVAC / electrical / plumbing capex.
Questions for the listing agent
- It's been on market 91 days. Have you received any prior offers? Is the seller open to a 9% concession, seller financing, or rate buy-down credit?
- Built in 1900 — when were the roof, HVAC, electrical panel, plumbing, and water heater last replaced?
- Property tax is high relative to price — has the assessment been appealed recently, and will the sale trigger a re-assessment?
- Why hasn't it sold? Are there any deal-killer items the seller is aware of (foundation, flood, title, zoning, code violations)?
- Is there a deadline driving the sale (1031 exchange, divorce, estate, relocation)? That informs how much negotiation room exists.
- Schools are F-rated, which usually means shorter tenancies and higher turnover. Who's the typical renter profile here, and what's been the actual vacancy rate?
- What's the average days-on-market for RENTAL listings here right now (not sales)? A rising rental-DOM trend means longer vacancies and softer asking-rent achievability than the comps imply.
- What's the recent tenant-quality profile in this submarket — average credit score on applications, eviction rate, late-payment / NSF rate, and stable-employment percentage? A property-management company in the area should have these aggregated.
- How much new for-sale + rental construction is in the pipeline within 1–3 miles? Heavy new supply typically softens prices + rents 12–24 months out; constrained supply supports both.
Investment metrics
- 1% rule
- 2.52% ✓
- Cap rate
- 20.41%
- Cash-on-cash
- 50.42%
- DSCR
- 3.24
- GRM
- 3.3
CMA / ARV
- ARV (median comp)
- $48,278
- List price
- $59,900
- Delta
- 24.07%
- Verdict
- OVERPRICED
- Comps
- 4 within 1.0 mi
Show comp detail 12 sales within ~0.75 mi
| Address | Dist | Beds/Ba | Sqft | Sold | Price | $/sf | Match |
|---|---|---|---|---|---|---|---|
| 338 Catherine St | 0.43mi | 3/2.0 | 1,940 (-1%) | 4mo | $50,000 | $26 | 73 |
| 764 Mary St | 0.39mi | 4/2.0 (+1) | 2,016 (+3%) | 2mo | $66,500 | $33 | 68 |
| 54 Harlem Ave | 0.33mi | 3/2.0 | 2,000 (+2%) | 15mo | $155,500 | $78 | 66 |
| 13 Schoen St | 0.56mi | 3/1.5 | 1,926 (-1%) | 8mo | $84,900 | $44 | 65 |
| 439 Alexander St | 0.19mi | 4/2.0 (+1) | 1,750 (-10%) | 3mo | $10,500 | $6 | 64 |
| 500 Marwood Ave | 0.52mi | 3/2.0 | 2,040 (+4%) | 9mo | $73,000 | $36 | 59 |
| 322 Russellwood Ave | 0.42mi | 3/1.5 | 1,835 (-6%) | 14mo | $70,850 | $39 | 58 |
| 916 2nd St | 0.39mi | 4/2.0 (+1) | 1,766 (-10%) | 6mo | $90,000 | $51 | 54 |
| 522 Woodward Ave | 0.35mi | 3/1.5 | 1,743 (-11%) | 14mo | $60,000 | $34 | 53 |
| 106 Shingiss St | 0.53mi | 4/2.0 (+1) | 1,744 (-11%) | 3mo | $155,000 | $89 | 48 |
| 902 Woodward Ave | 0.69mi | 4/1.5 (+1) | 1,664 (-15%) | 10mo | $142,500 | $86 | 30 |
| 209 Greydon Ave | 0.68mi | 4/2.5 (+1) | 1,660 (-15%) | 8mo | $269,900 | $163 | 28 |
Match score weights: distance 35% · size 25% · config 20% · recency 20%. Top-matched comps best support the ARV.
Projected returns pro-forma
-3.0% appreciation · 8.0% rent growth · sell at horizon
- IRR
- 54.1%
- Equity multiple
- 3.58×
- Total profit
- $43,205
- Equity at exit
- $8,931
- IRR
- 61.3%
- Equity multiple
- 8.87×
- Total profit
- $131,934
- Equity at exit
- $5,179
Cash invested: $16,772 (down + closing). Projections, not guarantees.
Landlord ↔ Tenant lean methodology
- Overall (STATE)
- 62 Landlord-Friendly
- State Pennsylvania
- 62 Landlord-Friendly · EVEN
- County
- — inherits STATE
- City
- — inherits STATE
ZIP-level market 15136
- Home prices YoY
- -30.4%
- Rents YoY
- 13.1%
- Active inventory
- 127
- Price-to-rent
- 3.3×
Monthly cashflow live
- Estimated rent
- $1,507 high interval (Pro) →
- Mortgage (P&I)
- −$314
- Tax from tax record
- −$147 /mo · $1,762/yr
- Insurance
- −$25
- HOA
- −$0
- Vacancy / Maint / Mgmt
- −$316
- Net cashflow
- $705
Break-even live
Sensitivity live
| Price | -10% $739 | -5% $722 | +0% $705 | +5% $688 | +10% $671 |
|---|---|---|---|---|---|
| Rent | -10% $586 | -5% $645 | +0% $705 | +5% $764 | +10% $824 |
| Rate | -1.0pp $735 | -0.5pp $720 | base $705 | +0.5pp $689 | +1.0pp $673 |
UW: 25.0% down · 7.5% · 30yr · 1.5% tax · 5.0% vac · 8.0% maint · 8.0% mgmt
Financing live
Cash to close
- Down payment
- $14,975
- Closing costs
- $1,797
- Reserves months
- —
- Total cash needed
- —
Loan-product check · same deal, 3 products live
Conventional
25% down · 7.5% · 30yr
- Down + closing
- —
- Monthly P&I
- —
- Monthly cashflow
- —
- DSCR
- —
- Eligible?
- —
Personal DTI + credit; lowest rate.
DSCR
20% down · 8.5% · 30yr
- Down + closing
- —
- Monthly P&I
- —
- Monthly cashflow
- —
- DSCR
- —
- Eligible?
- —
No personal income docs; deal must DSCR.
Hard money
10% down · 12.0% · 12mo
- Down + closing
- —
- Monthly P&I
- —
- Monthly cashflow
- —
- DSCR
- —
- Eligible?
- —
Short-term bridge; refi at stabilization.
Rent comps 9 comps
| Address | Beds | Baths | Sqft | Rent | $/sqft | DOM | Units | Dist |
|---|---|---|---|---|---|---|---|---|
| 27 Highland Ave Mc Kees Rocks, PA | 3.0 | 1.0 | 1488 | $1,425 | $0.96 | 24d | 1 | 0.18mi |
| 22 Harlem Ave #1 McKees Rocks, PA | 2.0 | 1.0 | 1944 | $745 | $0.38 | 22d | 1 | 0.28mi |
| 504 Fair Oaks St Mc Kees Rocks, PA | 4.0 | 1.0 | 1480 | $1,195 | $0.81 | 24d | 1 | 0.30mi |
| 135 Dunn St Mc Kees Rocks, PA | 3.0 | 2.0 | 1600 | $1,599 | $1.00 | 21d | 1 | 0.44mi |
| 720 Mary St Mc Kees Rocks, PA | 4.0 | 2.0 | 1800 | $1,795 | $1.00 | 8d | 1 | 0.47mi |
| 500 Marwood Ave Unit NA McKees Rocks, PA | 3.0 | 2.0 | 2040 | $1,500 | $0.74 | 24d | 1 | 0.54mi |
| 500 Marwood Ave Mc Kees Rocks, PA | 3.0 | 2.0 | 2040 | $1,600 | $0.78 | 24d | 1 | 0.54mi |
| 207 Singer Ave Mc Kees Rocks, PA | 3.0 | 2.0 | 1728 | $1,700 | $0.98 | 44d | 1 | 0.78mi |
| 115 Meade Ave Pittsburgh, PA | 4.0 | 1.0 | 1392 | $1,600 | $1.15 | 44d | 1 | 1.42mi |
Listing history 25 events
-
2026-06-08statusdays on market $59,900 Pending 91 DOM
-
2026-06-07days on market $59,900 Active 90 DOM
-
2026-06-05days on market $59,900 Active 87 DOM
-
2026-06-03days on market $59,900 Active 86 DOM
-
2026-06-02days on market $59,900 Active 85 DOM
-
2026-06-01days on market $59,900 Active 84 DOM
-
2026-05-31days on market $59,900 Active 83 DOM
-
2026-05-18price $59,900 223-char remark
Show marketing remark (223 chars)
Total of 3 units within 2 building. Being sold as-is. Could be a cash cow for the right buyer. Each unit is a 3-bed, 1-bath. Property is NOT zoned as a 3-unit. Buyer is responsible for all municipal requirements and zoning.
-
2026-04-08price $64,900 223-char remark
Show marketing remark (223 chars)
Total of 3 units within 2 building. Being sold as-is. Could be a cash cow for the right buyer. Each unit is a 3-bed, 1-bath. Property is NOT zoned as a 3-unit. Buyer is responsible for all municipal requirements and zoning.
-
2026-04-08status Active 223-char remark
Show marketing remark (223 chars)
Total of 3 units within 2 building. Being sold as-is. Could be a cash cow for the right buyer. Each unit is a 3-bed, 1-bath. Property is NOT zoned as a 3-unit. Buyer is responsible for all municipal requirements and zoning.
-
2026-03-04status Pending 223-char remark
Show marketing remark (223 chars)
Total of 3 units within 2 building. Being sold as-is. Could be a cash cow for the right buyer. Each unit is a 3-bed, 1-bath. Property is NOT zoned as a 3-unit. Buyer is responsible for all municipal requirements and zoning.
-
2026-02-17price $69,000 223-char remark
Show marketing remark (223 chars)
Total of 3 units within 2 building. Being sold as-is. Could be a cash cow for the right buyer. Each unit is a 3-bed, 1-bath. Property is NOT zoned as a 3-unit. Buyer is responsible for all municipal requirements and zoning.
-
2026-02-09status Active 223-char remark
Show marketing remark (223 chars)
Total of 3 units within 2 building. Being sold as-is. Could be a cash cow for the right buyer. Each unit is a 3-bed, 1-bath. Property is NOT zoned as a 3-unit. Buyer is responsible for all municipal requirements and zoning.
-
2025-12-08status Pending 223-char remark
Show marketing remark (223 chars)
Total of 3 units within 2 building. Being sold as-is. Could be a cash cow for the right buyer. Each unit is a 3-bed, 1-bath. Property is NOT zoned as a 3-unit. Buyer is responsible for all municipal requirements and zoning.
-
2025-12-01$75,000 Active 223-char remark
Show marketing remark (118 chars)
This place smells like opportunity! 3 bedrooms, 1.5 bathrooms. Needs some TLC. Good bones, good potential. Sold as-is.
-
2025-12-01historical Expired 118-char remark
Show marketing remark (118 chars)
This place smells like opportunity! 3 bedrooms, 1.5 bathrooms. Needs some TLC. Good bones, good potential. Sold as-is.
-
2025-09-09status Active 118-char remark
Show marketing remark (118 chars)
This place smells like opportunity! 3 bedrooms, 1.5 bathrooms. Needs some TLC. Good bones, good potential. Sold as-is.
-
2025-06-23status Pending 118-char remark
Show marketing remark (118 chars)
This place smells like opportunity! 3 bedrooms, 1.5 bathrooms. Needs some TLC. Good bones, good potential. Sold as-is.
-
2025-06-19status Active 118-char remark
Show marketing remark (118 chars)
This place smells like opportunity! 3 bedrooms, 1.5 bathrooms. Needs some TLC. Good bones, good potential. Sold as-is.
-
2025-06-16status Pending 118-char remark
Show marketing remark (118 chars)
This place smells like opportunity! 3 bedrooms, 1.5 bathrooms. Needs some TLC. Good bones, good potential. Sold as-is.
-
2025-06-13$35,000 Active 118-char remark
Show marketing remark (118 chars)
This place smells like opportunity! 3 bedrooms, 1.5 bathrooms. Needs some TLC. Good bones, good potential. Sold as-is.
-
2023-08-21soldstatus $37,000
-
1995-03-30soldstatus $12,000
-
1995-03-29soldstatus $12,000
-
1994-12-06$17,500
ⓘ Source: listings_history table (triggers on properties + properties_extension) + one-shot
backfill from property_details.listing_events for pre-trigger history.
Tax reassessment forecast PA · Partial reset (capped growth)
- Current annual tax
- $1,762 · $147/mo
- Projected year-2 tax
- $1,762 · $147/mo
- Expected delta
- $0/yr ($0/mo · 0.0%)
ⓘ Screening estimate from a state-policy table — verify with the county assessor before closing.
Climate risk First Street
- Flood 1/10 Low FEMA zone X (unshaded) · 0% chance over 30 yrs
- Wildfire 1/10 Low
- Heat 4/10 Moderate 7 d/yr ≥98°F today · 17 d/yr by 30 yrs out
- Wind 2/10 Low
- Air quality 3/10 Moderate 3 unhealthy d/yr today · 3 by 30 yrs out
Nearby sold comps map
Loading sold comps map…
Walkable amenities ~0.75 mi
Loading nearby amenities…
Taxation est. · year 1
- Rental income
- $18,084
- − Mortgage interest
- −$3,355
- − Property taxes
- −$1,762
- − Insurance
- −$300
- − Repairs & maintenance
- −$1,447
- − Management
- −$1,447
- − Depreciation
- −$1,743
- Taxable income
- $8,032
- Est. tax owed @ 24.0%
- −$1,928
- After-tax cash flow
- $6,528/yr
For passive investors: Depreciation is non-cash, so a rental often shows a tax loss while cash-flowing — sheltering income. Rental losses are passive: they offset passive income freely, and up to $25,000/yr can offset ordinary (W-2) income if you actively participate and your MAGI is under $100k (phasing out to $0 by $150k); unused losses carry forward. On sale, claimed depreciation is recaptured at up to 25%, and gains may owe capital-gains tax (a 1031 exchange can defer both). Figures are a year-1 estimate at your 24.0% rate — not tax advice; consult a CPA.
Schools (NCES district)
- District
- Sto-Rox SD
- NCES district ID
- 4222830
- Math proficiency
- 4% ▼ -5.00%
- Reading proficiency
- 18% ▼ -4.00%
- Median HH income
- $30,268
- Composite
- 8.51/100
- National rank
- #9904
- State rank
- #532 of 539 in PA
Livability — McKees Rocks
- Score
- 82/100
- State rank
- #143
- US rank
- #1154
Category grades
Schools grade is shown separately in the Schools card above.
Census & demographics
- Census place
- McKees Rocks, PA
- County
- Allegheny County · 1,022,028 people
- City population
- 22,623
- Metro
- Pittsburgh, PA
- Population (ZIP)
- 22,623
- Household income
- $69,099
- Rent vs Own
- Severe rent burden
- 768.0
Population outlook (Allegheny County) Hauer SSP2
- Today (2025)
- 1,250,282 people
- By 2030
- 1,256,482 · +0.5%
- By 2040
- 1,256,318 · +0.5%
- By 2050
- 1,244,169 · -0.5%
- By 2075
- 1,197,693 · -4.2%
- By 2100
- 1,093,187 · -12.6%
Race, ethnicity, and origin ACS 2023
- Neighborhood character
- Predominantly White (75%)
- Race & ethnicity
- White 75% Black 18% Two or more races 4% Hispanic / Latino 2%
- Common ancestry
- Romanian 10% Subsaharan African 3% Scotch-Irish 2%
- Foreign-born
- 3% · Canada
- Languages at home
- 96% English-only · Spanish 1% Other Indo-European 1%
Political lean MEDSL · Allegheny
- 2024 margin
- Strong D (+20.3) · D 59.7% · R 39.4%
- 2008→2024 swing
- +4.8pp toward D · 2008: 15.5pp · 2024: 20.3pp
- All cycles
- 2024: D+20.3 2020: D+20.4 2016: D+16.4 2012: D+14.4 2008: D+15.5
Not yet ingested
- Civics
- —
Market trends
- HPI YoY
- ▼ -107.07%
- Current HPI
- 244.6934
- Rent YoY
- ▲ 13.12%
- Metro
- Pittsburgh, PA
- State GDP YoY
- ▲ 1.68%
- F500 in state
- 34
Industry mix (Fortune 500 HQ in PA)
| Industry | F500 HQs | Revenue |
|---|---|---|
| Healthcare | 2 | $309B |
|
||
| Insurance | 2 | $27B |
|
||
| Telecommunications / Media | 1 | $124B |
|
||
| Industrial Distribution | 1 | $22B |
|
||
| Financial Services | 1 | $20B |
|
||
| Chemicals / Materials | 1 | $18B |
|
||
Price history
+242.3% since first listed18 events — show timeline
- 2026-05-18 Price Changed $59,900 West Penn MLS
- 2026-04-08 Price Changed $64,900 West Penn MLS
- 2026-04-08 Relisted — West Penn MLS
- 2026-03-04 Pending — West Penn MLS
- 2026-02-17 Price Changed $69,000 West Penn MLS
- 2026-02-09 Relisted — West Penn MLS
- 2025-12-08 Pending — West Penn MLS
- 2025-12-01 Delisted — West Penn MLS
- 2025-12-01 Listed $75,000 West Penn MLS
- 2025-09-09 Relisted — West Penn MLS
- 2025-06-23 Pending — West Penn MLS
- 2025-06-19 Relisted — West Penn MLS
- 2025-06-16 Pending — West Penn MLS
- 2025-06-13 Listed $35,000 West Penn MLS
- 2023-08-21 Sold (Public Records) $37,000 Public Records
- 1995-03-30 Sold (Public Records) $12,000 Public Records
- 1995-03-29 Sold (MLS) $12,000 West Penn MLS
- 1994-12-06 Listed $17,500 West Penn MLS
Property tax history
+2.4%/yrLatest (2026): $1,762 · +4.1% YoY. Source: county tax records.
Cash-flow waterfall
monthlySold comps — $/sqft
last 12 mo · ≤1 miLoading sold comps…