 🏗️ New Construction
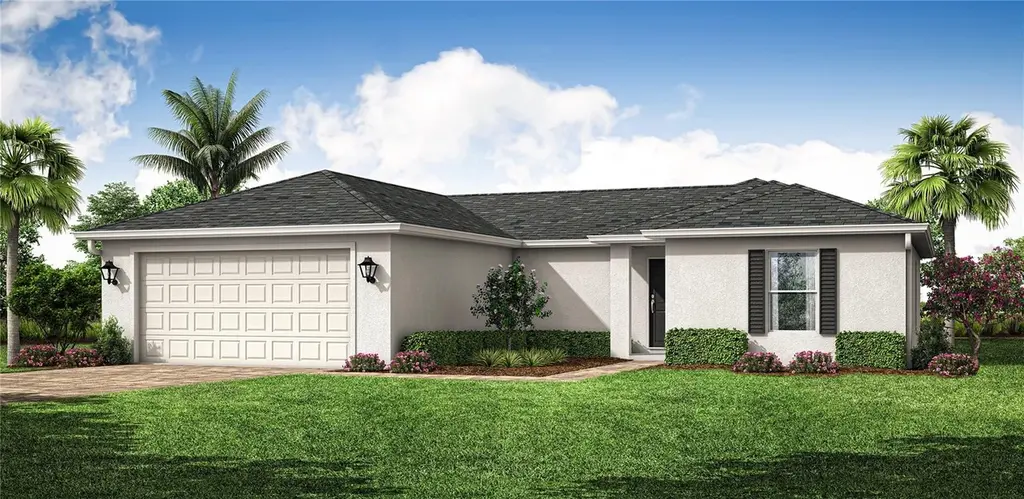
258 Santom Ln · North Port, FL
Flood risk 7/10 · Major
- FEMA flood zone
- X (shaded)
- Chance of flooding over 30 yrs
- 0.92%
- Est. flood insurance / yr
- $507 – $1,088
Fire risk 1/10 · Minimal
- Est. fire insurance / yr
- $947 – $1,759
Heat risk 10/10 · Severe
- Hot days now (above 108°F)
- 7 days/yr
- Hot days in 30 yrs
- 28 days/yr
Wind risk 10/10 · Severe
- Chance of severe wind over 30 yrs
- 99.0%
Air-quality risk 3/10 · Minor
- Unhealthy air days now
- 2 days/yr
- Unhealthy air days in 30 yrs
- 3 days/yr
Risk factors via First Street. Map © Google.
Why this score? — see what drove the F grade
The composite is a weighted blend of 9 inputs, each scored 0–100. Each bar is that input's sub-score; the figure is the points it added to the 100-point composite (weight × sub-score).
- Cash flow +7.9/30.0
- ARV discount +7.5/15.0
- Schools +4.6/10.0
- Livability +3.8/5.0
- Condition / age +2.5/5.0
- 1% rule +2.4/10.0
- DSCR +2.0/10.0
- Rent growth +1.6/5.0
- Appreciation +0.0/10.0
$290,990
🖨 Deal sheet (PDF) 📄 Offer letter ✓ Due diligence
Listing remarks MLS
Nice building lot in the north Port Charlotte area close to North Port. Lot is located outside of the flood zone in zone X. Lot is zoned for single family development and is 80x125. Central water is available along with power. Septic required. Great area to build your next house or use as an investment.
Key facts
- Open floor plan
- Quartz countertops
- Vaulted ceilings
Tags
Property features AI
Finance
- Other: Property type: Residential, single family; Zoning: RSF3.5; Lot size: 0.23 acres (about 0 to less than 1/4 acre)
- HOA & community: No association listed
Exterior
- Parking: Attached 2-car garage
- Utilities: Public water; Septic tank sewer; Cable available
- Home design: Single family residence; One story; Southwest facing; Under construction (projected completion May 1, 2027)
- Construction: Block, concrete and stucco construction; Shingle roof; Slab foundation; New construction; Builder: Coaston Homes (Windsor model); Builder license CBC1262095; Permit number 20260101538; Built/area details provided by builder/appraiser
- Exterior features: Paved road access; Lot dimensions approximately 80 x 125
Interior
- Kitchen: Dishwasher; Range; Microwave; Refrigerator; Solid surface counters
- Bedrooms: 4 bedrooms
- Flooring: Carpet; Ceramic tile
- Bathrooms: 2 full bathrooms
- Heating & cooling: Central heating; Central air conditioning
- Interior features: Open floorplan; Solid surface counters; Split bedroom layout; Vaulted ceilings; Walk-in closets
- Laundry & utility: Washer; Dryer; Laundry closet
Neighborhood map
What this means for you Summary
Snapshot
- This is a 4-bed/2.0-bath land listed at $291k.
Deal economics
- At list price, monthly cash flow is $-376 ($-5k/yr) — negative.
- To cash-flow at today's rent, offer at most $237k (18.7% below list).
- To meet the 1% rule (rent ≥ 1% of price), the offer needs to be $215k (26.0% below list).
- Recommended offer: $215k (26.0% below list) — sets the bar for 1% rule.
- Cap rate 5.0% vs local median 3.8% in North Port — top-decile yield for the area; either an underpriced asset or a hidden risk that comps aren't pricing in. Stress-test before assuming the spread holds.
Location & tenants
- Location reads 75/100 on livability (#252 in FL, #3,975 nationally) — a middle-class / working-renter tenant base. Strengths: crime A+, housing A+, health & safety A+; Watch: amenities F, commute F.
- Charlotte (suburban): math 54% / reading 54% proficiency, ranked #22 of 73 in FL (top 30%) — acceptable for families but not a draw, mixed tenant base, ~2y average lease.
- Zoned schools: Liberty Elementary School (math 56% / reading 56%, grade C+, #832 of 2,144 statewide, top 40%, 622 students, 56% FRL); Murdock Middle School (math 50% / reading 45%, grade C-, #288 of 571 statewide, top 51%, 577 students, 56% FRL); Port Charlotte High School (math 23% / reading 38%, grade F, #434 of 667 statewide, top 66%, 1,649 students, 43% FRL) — zoned schools at 52% FRL track the district average.
- Market conditions: Rents falling (-3.5%/yr); 695 active listings in the ZIP; 13 comparable units currently listed for rent nearby; rentals at typical pace (median 16d on market — plan ~3-4 weeks tenant-placement turnaround); solid renter incomes; 4,585 units permitted in Charlotte County in 2024 (703 in 5+ unit buildings).
- This rent runs 33% of the median local income ($78k/yr) — at the standard rent-burdened threshold; future hikes will face affordability resistance.
Forward outlook
- Local home prices are declining (-3.0%/yr); year-one equity from $2k of loan paydown is wiped out by about $9k of value loss. Plan a longer hold.
- Charlotte County population projected at +24% by 2050 — long-run rental-demand tailwind backs the buy-and-hold thesis.
Negotiation context
- It's been on market 37 days — a 3% lower offer ($282k) is reasonable based on typical stale-listing flexibility.
- 4 sale attempts since 22y ago with the ask held roughly flat each time — persistent listings suggest the price (not the market) is what's stuck; bring a comps-based counter.
- Current owner paid $16k; list at $291k implies a 1719% gain — meaningful room to come down on a strong offer.
Risks & watch-outs
- Watch-outs: flood insurance adds $66/mo.
- Climate carrying-cost: major flood risk; severe wind risk, 99% chance of damaging wind over 30y; extreme-heat days projected 7→28/yr by 2055 (HVAC capex compounding) — expect insurance premiums to compound above CPI over the hold.
Questions for the listing agent
- What do current leases actually rent for vs. the listed asking? Can we see a recent rent roll and the last 12 months of T-12 income?
- It's been on market 37 days. Have you received any prior offers? Is the seller open to a 26% concession, seller financing, or rate buy-down credit?
- What's the actual annual flood-insurance premium (NFIP or private), and is the property in a SFHA with mandatory coverage?
- Is there a deadline driving the sale (1031 exchange, divorce, estate, relocation)? That informs how much negotiation room exists.
- Schools are B-rated — typically a magnet for longer-tenancy family renters. What's the average tenant stay here, and is there a school-zone premium baked into asking?
- The area grade is low — what's the realistic commute time and amenity access for the typical tenant pool here? Any planned neighborhood developments (good or bad) we should know about?
- What's the average days-on-market for RENTAL listings here right now (not sales)? A rising rental-DOM trend means longer vacancies and softer asking-rent achievability than the comps imply.
- What's the recent tenant-quality profile in this submarket — average credit score on applications, eviction rate, late-payment / NSF rate, and stable-employment percentage? A property-management company in the area should have these aggregated.
- How much new for-sale + rental construction is in the pipeline within 1–3 miles? Heavy new supply typically softens prices + rents 12–24 months out; constrained supply supports both.
Investment metrics
- 1% rule
- 0.74% ✗
- Cap rate
- 5.02%
- Cash-on-cash
- -4.56%
- DSCR
- 0.80
- GRM
- 11.3
CMA / ARV
No comps found within radius.
Projected returns pro-forma
-3.0% appreciation · 0.0% rent growth · sell at horizon
- IRR
- -29.3%
- Equity multiple
- 0.05×
- Total profit
- $-77,336
- Equity at exit
- $43,388
- IRR
- -48.8%
- Equity multiple
- -0.50×
- Total profit
- $-122,270
- Equity at exit
- $25,159
Cash invested: $81,477 (down + closing). Projections, not guarantees.
Landlord ↔ Tenant lean methodology
- Overall (STATE)
- 87 Strongly Landlord-Friendly
- State Florida
- 87 Strongly Landlord-Friendly · R+3
- County
- — inherits STATE
- City
- — inherits STATE
ZIP-level market 33954
- Home prices YoY
- -13.3%
- Rents YoY
- -3.5%
- Active inventory
- 695
- Price-to-rent
- 11.3×
Monthly cashflow live
- Estimated rent
- $2,154 high interval (Pro) →
- Mortgage (P&I)
- −$1,526
- Tax est. 1.5%
- −$364 /mo · $4,365/yr
- Insurance
- −$121
- Flood insurance flood zone
- −$66 /mo · $798/yr
- HOA
- −$0
- Vacancy / Maint / Mgmt
- −$452
- Net cashflow
- $-376
Break-even live
Sensitivity live
| Price | -10% $-175 | -5% $-275 | +0% $-376 | +5% $-477 | +10% $-577 |
|---|---|---|---|---|---|
| Rent | -10% $-546 | -5% $-461 | +0% $-376 | +5% $-291 | +10% $-206 |
| Rate | -1.0pp $-229 | -0.5pp $-302 | base $-376 | +0.5pp $-451 | +1.0pp $-528 |
UW: 25.0% down · 7.5% · 30yr · 1.5% tax · 5.0% vac · 8.0% maint · 8.0% mgmt
Financing live
Cash to close
- Down payment
- $72,748
- Closing costs
- $8,730
- Reserves months
- —
- Total cash needed
- —
Loan-product check · same deal, 3 products live
Conventional
25% down · 7.5% · 30yr
- Down + closing
- —
- Monthly P&I
- —
- Monthly cashflow
- —
- DSCR
- —
- Eligible?
- —
Personal DTI + credit; lowest rate.
DSCR
20% down · 8.5% · 30yr
- Down + closing
- —
- Monthly P&I
- —
- Monthly cashflow
- —
- DSCR
- —
- Eligible?
- —
No personal income docs; deal must DSCR.
Hard money
10% down · 12.0% · 12mo
- Down + closing
- —
- Monthly P&I
- —
- Monthly cashflow
- —
- DSCR
- —
- Eligible?
- —
Short-term bridge; refi at stabilization.
Rent comps 13 comps
| Address | Beds | Baths | Sqft | Rent | $/sqft | DOM | Units | Dist |
|---|---|---|---|---|---|---|---|---|
| 312 Bamboo Dr Port Charlotte, FL | 3.0 | 2.0 | 1200 | $2,300 | $1.92 | 23d | 1 | 0.11mi |
| 232 Bamboo Dr Unit A Port Charlotte, FL | 3.0 | 2.0 | 1018 | $1,395 | $1.37 | 15d | 1 | 0.19mi |
| 385 Bowman Ter Unit 387 Port Charlotte, FL | 3.0 | 2.0 | 1200 | $1,900 | $1.58 | 23d | 1 | 0.31mi |
| 15476 Chamberlain Blvd Port Charlotte, FL | 3.0 | 2.0 | 1521 | $2,159 | $1.42 | 15d | 1 | 0.57mi |
| 96 Westview Pl Port Charlotte, FL | 1.0–3.0 | 1.0–2.0 | 1120 | $2,303 | $2.06 | 15d | 38 | 0.59mi |
| 1080 West Port Blvd Port Charlotte, FL | 3.0 | 1.0–2.0 | 935 | $2,061 | $2.20 | 15d | 25 | 0.91mi |
| 16325 Franklin Ave Port Charlotte, FL | 1.0–3.0 | 1.0–2.0 | 989 | $1,904 | $1.92 | 15d | 30 | 1.01mi |
| 16466 Bauers Ave Port Charlotte, FL | 3.0 | 2.0 | 1610 | $2,100 | $1.30 | 23d | 1 | 1.05mi |
| 73 Flamingo Blvd Port Charlotte, FL | 3.0 | 2.0 | 1656 | $2,150 | $1.30 | 23d | 1 | 1.20mi |
| 470 Venango St Port Charlotte, FL | 3.0 | 2.0 | 1234 | $1,900 | $1.54 | 15d | 1 | 1.22mi |
| 17031 Hillsborough Blvd Port Charlotte, FL | 3.0 | 2.0 | 1751 | $1,850 | $1.06 | 23d | 1 | 1.27mi |
| 17070 Byron Ave Unit 17072 Port Charlotte, FL | 3.0 | 2.0 | 1162 | $1,625 | $1.40 | 23d | 1 | 1.37mi |
| 1394 Sunset Preserve Way Port Charlotte, FL | 3.0 | 2.0 | 1857 | $2,445 | $1.32 | 15d | 1 | 1.38mi |
Listing history 13 events
-
2026-05-21price $290,990
-
2026-05-13price $292,990
-
2026-04-14$294,990 Active
-
2025-12-27soldstatus $16,000
-
2025-12-23soldstatus $16,000 Closed 305-char remark
Show marketing remark (305 chars)
Nice building lot in the north Port Charlotte area close to North Port. Lot is located outside of the flood zone in zone X. Lot is zoned for single family development and is 80x125. Central water is available along with power. Septic required. Great area to build your next house or use as an investment.
-
2025-11-05historical 305-char remark
Show marketing remark (305 chars)
Nice building lot in the north Port Charlotte area close to North Port. Lot is located outside of the flood zone in zone X. Lot is zoned for single family development and is 80x125. Central water is available along with power. Septic required. Great area to build your next house or use as an investment.
-
2025-11-03$18,000 305-char remark
Show marketing remark (305 chars)
Nice building lot in the north Port Charlotte area close to North Port. Lot is located outside of the flood zone in zone X. Lot is zoned for single family development and is 80x125. Central water is available along with power. Septic required. Great area to build your next house or use as an investment.
-
2009-06-19soldstatus $211,000
-
2007-06-28$20,900
-
2004-11-03soldstatus $932,100
-
2004-08-26soldstatus $19,900
-
2004-06-21$19,900
-
2004-04-27soldstatus $19,500
ⓘ Source: listings_history table (triggers on properties + properties_extension) + one-shot
backfill from property_details.listing_events for pre-trigger history.
Climate risk First Street
- Flood 7/10 Severe FEMA zone X (shaded) · 92% chance over 30 yrs
- Wildfire 1/10 Low
- Heat 10/10 Extreme 7 d/yr ≥108°F today · 28 d/yr by 30 yrs out
- Wind 10/10 Extreme 99% chance of damaging wind over 30 yrs
- Air quality 3/10 Moderate 2 unhealthy d/yr today · 3 by 30 yrs out
Nearby sold comps map
Loading sold comps map…
Walkable amenities ~0.75 mi
Loading nearby amenities…
Taxation est. · year 1
- Rental income
- $25,845
- − Mortgage interest
- −$16,300
- − Property taxes
- −$4,365
- − Insurance
- −$2,252
- − Repairs & maintenance
- −$2,068
- − Management
- −$2,068
- − Depreciation
- −$8,465
- Taxable loss
- −$9,673
- Est. tax savings @ 24.0%
- +$2,321
- After-tax cash flow
- $-2,190/yr
For passive investors: Depreciation is non-cash, so a rental often shows a tax loss while cash-flowing — sheltering income. Rental losses are passive: they offset passive income freely, and up to $25,000/yr can offset ordinary (W-2) income if you actively participate and your MAGI is under $100k (phasing out to $0 by $150k); unused losses carry forward. On sale, claimed depreciation is recaptured at up to 25%, and gains may owe capital-gains tax (a 1031 exchange can defer both). Figures are a year-1 estimate at your 24.0% rate — not tax advice; consult a CPA.
Schools (NCES district)
- District
- Charlotte
- NCES district ID
- 1200240
- Math proficiency
- 54% ▼ -6.00%
- Reading proficiency
- 54% ▼ -1.00%
- Median HH income
- $44,864
- Composite
- 45.62/100
- National rank
- #2586
- State rank
- #22 of 73 in FL
Livability — North Port
- Score
- 75/100
- State rank
- #252
- US rank
- #3975
Category grades
Schools grade is shown separately in the Schools card above.
Census & demographics
- County
- Charlotte County · 196,994 people
- City population
- 75,324
- Metro
- Punta Gorda, FL
- Population (ZIP)
- 11,193
- Household income
- $78,288
- Rent vs Own
- Severe rent burden
- 263.0
Population outlook (Charlotte County) Hauer SSP2
- Today (2025)
- 198,646 people
- By 2030
- 210,507 · +6.0%
- By 2040
- 230,857 · +16.2%
- By 2050
- 247,148 · +24.4%
- By 2075
- 281,777 · +41.8%
- By 2100
- 293,609 · +47.8%
Race, ethnicity, and origin ACS 2023
- Neighborhood character
- Predominantly White (75%)
- Race & ethnicity
- White 75% Hispanic / Latino 12% Two or more races 10% Black 9%
- Hispanic origin (detail)
- Puerto Rican 4% Dominican 1%
- Common ancestry
- Lithuanian 5% Romanian 3% Subsaharan African 2%
- Foreign-born
- 14% · Canada
- Languages at home
- 86% English-only · Spanish 7% Russian/Polish/Slavic 3% French/Haitian/Cajun 2%
Political lean MEDSL · Charlotte
- 2024 margin
- Solid R (+34.0) · D 32.7% · R 66.7%
- 2008→2024 swing
- -26.7pp toward R · 2008: -7.2pp · 2024: -34.0pp
- All cycles
- 2024: R+34.0 2020: R+26.6 2016: R+27.8 2012: R+14.3 2008: R+7.2
Not yet ingested
- Civics
- —
Market trends
- HPI YoY
- ▼ -51.25%
- Current HPI
- 335.3128
- Rent YoY
- ▼ -3.48%
- Metro
- Punta Gorda, FL
- State GDP YoY
- ▲ 3.28%
- F500 in state
- 36
Industry mix (Fortune 500 HQ in FL)
| Industry | F500 HQs | Revenue |
|---|---|---|
| Industrial Technology | 2 | $29B |
|
||
| Insurance | 2 | $17B |
|
||
| Retail | 1 | $60B |
|
||
| Technology Distribution | 1 | $58B |
|
||
| Homebuilding | 1 | $35B |
|
||
| Technology Manufacturing | 1 | $35B |
|
||
Price history
+1392.3% since first listed13 events — show timeline
- 2026-05-21 Price Changed $290,990 Stellar MLS as Distributed by MLS Grid
- 2026-05-13 Price Changed $292,990 Stellar MLS as Distributed by MLS Grid
- 2026-04-14 Listed $294,990 Stellar MLS as Distributed by MLS Grid
- 2025-12-27 Sold (Public Records) $16,000 Public Records
- 2025-12-23 Sold (MLS) $16,000 Stellar MLS as Distributed by MLS Grid
- 2025-11-05 Listing Removed — Stellar MLS as Distributed by MLS Grid
- 2025-11-03 Listed $18,000 Stellar MLS as Distributed by MLS Grid
- 2009-06-19 Sold (Public Records) $211,000 Public Records
- 2007-06-28 Listed $20,900 Stellar MLS as Distributed by MLS Grid
- 2004-11-03 Sold (Public Records) $932,100 Public Records
- 2004-08-26 Sold (MLS) $19,900 Stellar MLS as Distributed by MLS Grid
- 2004-06-21 Listed $19,900 Stellar MLS as Distributed by MLS Grid
- 2004-04-27 Sold (Public Records) $19,500 Public Records
Property tax history
+6.0%/yrLatest (2025): $372 · -25.6% YoY. Source: county tax records.
Cash-flow waterfall
monthlySold comps — $/sqft
last 12 mo · ≤1 miLoading sold comps…