 Duplex
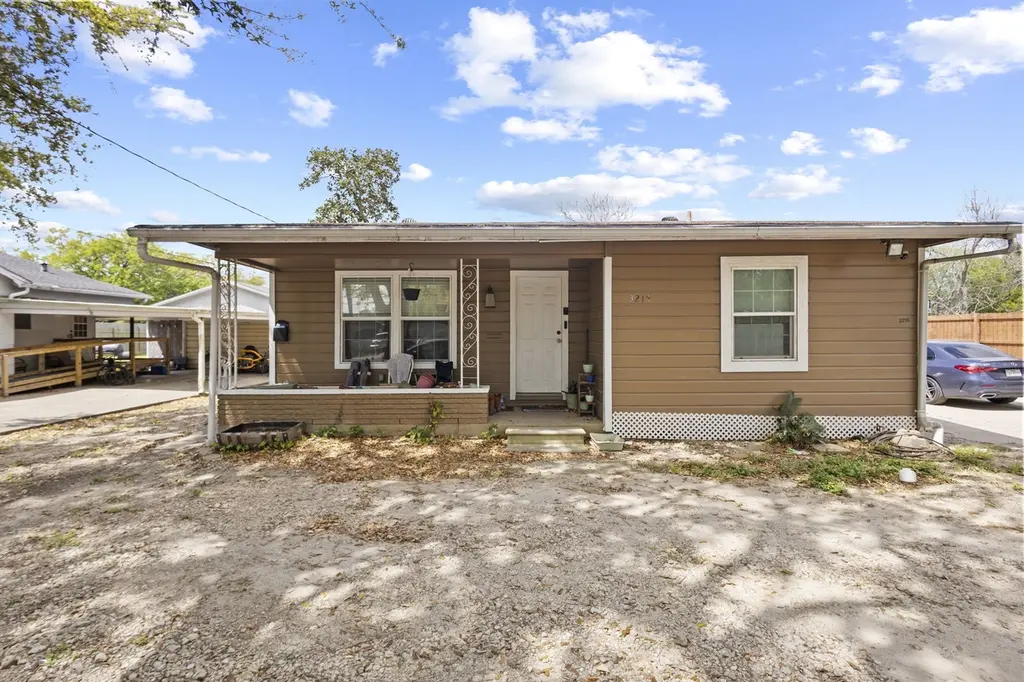
3215 32nd St · Port Arthur, TX
Flood risk 8/10 · Major
- FEMA flood zone
- —
- Chance of flooding over 30 yrs
- 0.6%
- Est. flood insurance / yr
- —
Fire risk 1/10 · Minimal
- Est. fire insurance / yr
- $1,222 – $2,270
Heat risk 9/10 · Severe
- Hot days now (above 110°F)
- 7 days/yr
- Hot days in 30 yrs
- 24 days/yr
Wind risk 9/10 · Severe
- Chance of severe wind over 30 yrs
- 99.0%
Air-quality risk 2/10 · Minimal
- Unhealthy air days now
- 1 days/yr
- Unhealthy air days in 30 yrs
- 1 days/yr
Risk factors via First Street. Map © Google.
Why this score? — see what drove the C grade
The composite is a weighted blend of 9 inputs, each scored 0–100. Each bar is that input's sub-score; the figure is the points it added to the 100-point composite (weight × sub-score).
- Cash flow +25.3/30.0
- DSCR +8.3/10.0
- ARV discount +7.5/15.0
- 1% rule +6.7/10.0
- Rent growth +5.0/5.0
- Livability +3.1/5.0
- Condition / age +2.2/5.0
- Schools +1.5/10.0
- Appreciation +0.0/10.0
$249,000
🖨 Deal sheet 📄 Offer letter ✓ Due diligence
Multi-family units
County records classify this as Multi-Family (2-4 Unit). Listing-text estimate: 2 units. confirmed
Listing remarks MLS
This income-producing property features a duplex and a converted detached garage apartment, offering a total of three units. The garage apartment is a 1 bedroom, 1 bathroom unit equipped with window units, currently renting for $1,000/month. The front unit of the duplex is a 2 bedroom, 1 bathroom, renting for $1,400/month, while the back unit is a 3 bedroom, 2 bathroom, renting for $1,700/month. Total monthly rental income of $4,100, this is a great investment opportunity with established cash flow already in place.
Key facts
- Three units
- Rental income
- Built 1962
Tags
Neighborhood map
What this means for you Summary
Snapshot
- This is a 2 × 3-bed/?-bath units multifamily listed at $249k. Condition is rated fair.
Deal economics
- At list price, monthly cash flow is $563 ($7k/yr) — positive. Per door: $282/mo.
- The deal already cash-flows at list — no discount required.
- Meets the 1% rule at list price ($3k rent vs $249k).
- Recommended offer: $234k (6.0% below list) — sets the bar for market timing.
- Cap rate 9.0% vs local median 5.0% in Port Arthur — top-decile yield for the area; either an underpriced asset or a hidden risk that comps aren't pricing in. Stress-test before assuming the spread holds.
Location & tenants
- Location reads 61/100 on livability (#1,014 in TX) — a middle-class / working-renter tenant base. Strengths: cost of living A+, housing A+; Watch: schools D-, crime F, amenities F.
- Port Arthur ISD (urban): math 15% / reading 22% proficiency, ranked #796 of 826 in TX (top 96%) — low school quality limits family demand, transient renter base, plan for 1-2y turnover; 80% free/reduced lunch — lower-income household profile, screen leases tightly.
- Market conditions: Rents rising fast (+14.4%/yr); 115 active listings in the ZIP; 1 comparable units currently listed for rent nearby; lower-income renter base — watch delinquency; 343 units permitted in Jefferson County in 2024 (0 in 5+ unit buildings).
- At $2,916/mo this rent would consume 81% of the median local household income ($43k/yr) (locally 1775% of renters already pay >50% of income on rent) — very limited rent-growth headroom before tenants either downsize or default.
Forward outlook
- Local home prices are declining (-3.0%/yr); year-one equity from $2k of loan paydown is wiped out by about $7k of value loss. Plan a longer hold.
- At projected returns (-3.0% appreciation + 8.0% rent growth), your $70k cash investment doubles in ~8 years — after that, you're playing with house money.
Negotiation context
- It's been on market 62 days — a 6% lower offer ($234k) is reasonable based on typical stale-listing flexibility.
- 2 sale attempts; this cycle's ask has dropped $20k (7%) from the opening price — seller is motivated, your offer sets the floor, not the list.
Risks & watch-outs
- Climate carrying-cost: severe flood risk; severe wind risk, 99% chance of damaging wind over 30y; extreme-heat days projected 7→24/yr by 2055 (HVAC capex compounding) — expect insurance premiums to compound above CPI over the hold.
Questions for the listing agent
- It's been on market 62 days. Have you received any prior offers? Is the seller open to a 6% concession, seller financing, or rate buy-down credit?
- Can we see the unit-by-unit rent roll, current vacancy, and any below-market leases? What's the average tenancy length?
- What capital expenditures (roof, boiler, parking lot, exteriors) have been made in the last 5 years, and what's planned in the next 2?
- Have any recent inspections been done? Can we get a copy of the seller's disclosures and any deferred-maintenance estimates?
- Built in 1962 — when were the roof, HVAC, electrical panel, plumbing, and water heater last replaced?
- Why hasn't it sold? Are there any deal-killer items the seller is aware of (foundation, flood, title, zoning, code violations)?
- Is there a deadline driving the sale (1031 exchange, divorce, estate, relocation)? That informs how much negotiation room exists.
- Schools are D-rated, which usually means shorter tenancies and higher turnover. Who's the typical renter profile here, and what's been the actual vacancy rate?
- Crime grade is F in this area — have there been break-ins, vandalism, or insurance claims at this property in the last 3 years? What carrier currently insures it and at what premium?
- What's the average days-on-market for RENTAL listings here right now (not sales)? A rising rental-DOM trend means longer vacancies and softer asking-rent achievability than the comps imply.
- What's the recent tenant-quality profile in this submarket — average credit score on applications, eviction rate, late-payment / NSF rate, and stable-employment percentage? A property-management company in the area should have these aggregated.
- How much new apartment / multifamily construction is in the pipeline within 1–3 miles? Heavy new supply (>2% of stock underway) typically softens rents 12–24 months out; light construction supports rent growth.
Investment metrics
- 1% rule
- 1.17% ✓
- Cap rate
- 9.01%
- Cash-on-cash
- 9.70%
- DSCR
- 1.43
- GRM
- 7.1
CMA / ARV
No comps found within radius.
Projected returns pro-forma
-3.0% appreciation · 8.0% rent growth · sell at horizon
- IRR
- 3.9%
- Equity multiple
- 1.16×
- Total profit
- $10,997
- Equity at exit
- $37,127
- IRR
- 17.7%
- Equity multiple
- 2.81×
- Total profit
- $126,143
- Equity at exit
- $21,529
Cash invested: $69,720 (down + closing). Projections, not guarantees.
Landlord ↔ Tenant lean methodology
- Overall (STATE)
- 87 Strongly Landlord-Friendly
- State Texas
- 87 Strongly Landlord-Friendly · R+5
- County
- — inherits STATE
- City
- — inherits STATE
ZIP-level market 77642
- Rents YoY
- 14.4%
- Active inventory
- 115
- Price-to-rent
- 14.2×
Monthly cashflow live
- Estimated rent
- $2,916 high interval (Pro) →
- Mortgage (P&I)
- −$1,306
- Tax from tax record
- −$331 /mo · $3,969/yr
- Insurance
- −$104
- HOA
- −$0
- Vacancy / Maint / Mgmt
- −$612
- Net cashflow
- $563
Break-even live
2-unit breakdown (identical units grouped — click to expand)
| Units | Beds | Baths | Est. rent |
|---|---|---|---|
| 2× units | 3 | — | $2,916 |
| #1 | 3 | — | $1,458 |
| #2 | 3 | — | $1,458 |
| Total (2 units) | $2,916 | ||
UW: 25.0% down · 7.5% · 30yr · 1.5% tax · 5.0% vac · 8.0% maint · 8.0% mgmt
Financing live
Cash to close
- Down payment
- $62,250
- Closing costs
- $7,470
- Reserves months
- —
- Total cash needed
- —
Loan-product check · same deal, 3 products live
Conventional
25% down · 7.5% · 30yr
- Down + closing
- —
- Monthly P&I
- —
- Monthly cashflow
- —
- DSCR
- —
- Eligible?
- —
Personal DTI + credit; lowest rate.
DSCR
20% down · 8.5% · 30yr
- Down + closing
- —
- Monthly P&I
- —
- Monthly cashflow
- —
- DSCR
- —
- Eligible?
- —
No personal income docs; deal must DSCR.
Hard money
10% down · 12.0% · 12mo
- Down + closing
- —
- Monthly P&I
- —
- Monthly cashflow
- —
- DSCR
- —
- Eligible?
- —
Short-term bridge; refi at stabilization.
Rent comps 1 comps
| Address | Beds | Baths | Sqft | Rent | $/sqft | DOM | Units | Dist |
|---|---|---|---|---|---|---|---|---|
| 4203 Philmont Ave Unit 1056427P Port Arthur, TX | 6.0 | 3.0 | 1948 | $7,637 | $3.92 | 13d | 1 | 0.64mi |
Listing history 18 events
-
2026-06-15days on market $249,000 Pending 62 DOM
-
2026-06-14days on market $249,000 Pending 60 DOM
-
2026-06-13days on market $249,000 Pending 59 DOM
-
2026-06-10days on market $249,000 Pending 57 DOM
-
2026-06-09days on market $249,000 Pending 56 DOM
-
2026-06-08days on market $249,000 Pending 55 DOM
-
2026-06-07statusdays on market $249,000 Pending 54 DOM
-
2026-06-03days on market $249,000 Active 50 DOM
-
2026-06-02days on market $249,000 Active 49 DOM
-
2026-06-01days on market $249,000 Active 48 DOM
-
2026-05-31days on market $249,000 Active 47 DOM
-
2026-05-30days on market $249,000 Active 46 DOM
-
2026-05-16price $249,000 521-char remark
Show marketing remark (524 chars)
This income-producing property features a duplex and a converted detached garage apartment, offering a total of three units. The garage apartment is a 1 bedroom, 1 bathroom unit equipped with window units, currently renting for $1,000/month. The front unit of the duplex is a 2 bedroom, 1 bathroom, renting for $1,400/month, while the back unit is a 3 bedroom, 2 bathroom, renting for $1,700/month. Total monthly rental income of $4,100, this is a great investment opportunity with established cash flow already in place.
-
2026-05-16price $249,000 524-char remark
Show marketing remark (524 chars)
This income-producing property features a duplex and a converted detached garage apartment, offering a total of three units. The garage apartment is a 1 bedroom, 1 bathroom unit equipped with window units, currently renting for $1,000/month. The front unit of the duplex is a 2 bedroom, 1 bathroom, renting for $1,400/month, while the back unit is a 3 bedroom, 2 bathroom, renting for $1,700/month. Total monthly rental income of $4,100, this is a great investment opportunity with established cash flow already in place.
-
2026-04-25price $259,000 524-char remark
Show marketing remark (524 chars)
This income-producing property features a duplex and a converted detached garage apartment, offering a total of three units. The garage apartment is a 1 bedroom, 1 bathroom unit equipped with window units, currently renting for $1,000/month. The front unit of the duplex is a 2 bedroom, 1 bathroom, renting for $1,400/month, while the back unit is a 3 bedroom, 2 bathroom, renting for $1,700/month. Total monthly rental income of $4,100, this is a great investment opportunity with established cash flow already in place.
-
2026-04-23price $259,000 521-char remark
Show marketing remark (521 chars)
This income-producing property features a duplex and a converted detached garage apartment, offering a total of three units. The garage apartment is a 1 bedroom, 1 bathroom unit equipped with window units, currently renting for $1,000/month. The front unit of the duplex is a 2 bedroom, 1 bathroom, renting for $1,400/month, while the back unit is a 3 bedroom, 2 bathroom, renting for $1,700/month. Total monthly rental income of $4,100, this is a great investment opportunity with established cash flow already in place.
-
2026-04-14$269,000 Active 524-char remark
Show marketing remark (524 chars)
This income-producing property features a duplex and a converted detached garage apartment, offering a total of three units. The garage apartment is a 1 bedroom, 1 bathroom unit equipped with window units, currently renting for $1,000/month. The front unit of the duplex is a 2 bedroom, 1 bathroom, renting for $1,400/month, while the back unit is a 3 bedroom, 2 bathroom, renting for $1,700/month. Total monthly rental income of $4,100, this is a great investment opportunity with established cash flow already in place.
-
2026-03-26$269,000 Active 521-char remark
Show marketing remark (521 chars)
This income-producing property features a duplex and a converted detached garage apartment, offering a total of three units. The garage apartment is a 1 bedroom, 1 bathroom unit equipped with window units, currently renting for $1,000/month. The front unit of the duplex is a 2 bedroom, 1 bathroom, renting for $1,400/month, while the back unit is a 3 bedroom, 2 bathroom, renting for $1,700/month. Total monthly rental income of $4,100, this is a great investment opportunity with established cash flow already in place.
ⓘ Source: listings_history table (triggers on properties + properties_extension) + one-shot
backfill from property_details.listing_events for pre-trigger history.
Tax reassessment forecast TX · Resets to sale price
- Current annual tax
- $3,969 · $331/mo
- Projected year-2 tax
- $4,557 · $380/mo
- Expected delta
- +$588/yr (+$49/mo · 14.8%)
ⓘ Screening estimate from a state-policy table — verify with the county assessor before closing.
Climate risk First Street
- Flood 8/10 Severe 60% chance over 30 yrs
- Wildfire 1/10 Low
- Heat 9/10 Extreme 7 d/yr ≥110°F today · 24 d/yr by 30 yrs out
- Wind 9/10 Extreme 99% chance of damaging wind over 30 yrs
- Air quality 2/10 Low 1 unhealthy d/yr today · 1 by 30 yrs out
Nearby sold comps map
Loading sold comps map…
Walkable amenities ~0.75 mi
Loading nearby amenities…
Taxation est. · year 1
- Rental income
- $34,992
- − Mortgage interest
- −$13,948
- − Property taxes
- −$3,969
- − Insurance
- −$1,245
- − Repairs & maintenance
- −$2,799
- − Management
- −$2,799
- − Depreciation
- −$7,244
- Taxable income
- $2,988
- Est. tax owed @ 24.0%
- −$717
- After-tax cash flow
- $6,043/yr
For passive investors: Depreciation is non-cash, so a rental often shows a tax loss while cash-flowing — sheltering income. Rental losses are passive: they offset passive income freely, and up to $25,000/yr can offset ordinary (W-2) income if you actively participate and your MAGI is under $100k (phasing out to $0 by $150k); unused losses carry forward. On sale, claimed depreciation is recaptured at up to 25%, and gains may owe capital-gains tax (a 1031 exchange can defer both). Figures are a year-1 estimate at your 24.0% rate — not tax advice; consult a CPA.
Condition & rehab AI · 1 photo
This multi-family property requires moderate renovations, including painting, siding repair, and flooring replacement, to improve its condition and value.
Repairs flagged
- Major siding — Significant wear and tear
- Major flooring — Exposed subflooring
- Major paint — Peeling paint
Value-add opportunities
- Both painting — Enhances curb appeal and interior aesthetics
- Both siding repair — Improves exterior appearance and durability
- Both flooring replacement — Restores structural integrity and enhances living space
Renovation cost estimate screening
| Repair item | Severity | Est. cost |
|---|---|---|
| siding · Significant wear and tear | Major | $15,000–50,000 |
| flooring · Exposed subflooring | Major | $15,000–50,000 |
| paint · Peeling paint | Major | $15,000–50,000 |
| Total estimated repair cost · 3 items | $45,000–150,000 |
Value-add ROI direction
- Both painting — Enhances curb appeal and interior aesthetics ↑
- Both siding repair — Improves exterior appearance and durability ↑
- Both flooring replacement — Restores structural integrity and enhances living space ↑
ⓘ Cost ranges are severity-bucket heuristics (US national rule-of-thumb). Get contractor quotes + a written scope before underwriting a rehab budget.
Schools (NCES district)
- District
- Port Arthur ISD
- NCES district ID
- 4835400
- Math proficiency
- 15% ▼ -22.00%
- Reading proficiency
- 22% ▼ -10.00%
- Median HH income
- $31,795
- Composite
- 14.9/100
- National rank
- #9373
- State rank
- #796 of 826 in TX
Livability — Port Arthur
- Score
- 61/100
- State rank
- #1014
- US rank
- #18061
Category grades
Schools grade is shown separately in the Schools card above.
Census & demographics
- Census place
- Port Arthur, TX
- County
- Jefferson County · 203,592 people
- City population
- 38,358
- Metro
- Beaumont-Port Arthur, TX
- Population (ZIP)
- 38,358
- Household income
- $42,950
- Rent vs Own
- Severe rent burden
- 1775.0
Population outlook (Jefferson County) Hauer SSP2
- Today (2025)
- 259,015 people
- By 2030
- 260,685 · +0.6%
- By 2040
- 263,309 · +1.7%
- By 2050
- 265,237 · +2.4%
- By 2075
- 270,193 · +4.3%
- By 2100
- 255,628 · -1.3%
Race, ethnicity, and origin ACS 2023
- Neighborhood character
- Diverse neighborhood (Simpson 0.66)
- Race & ethnicity
- Hispanic / Latino 42% Black 37% Two or more races 18% White 12% Asian 7% Native American 1%
- Hispanic origin (detail)
- Mexican 35% Cuban 1%
- Common ancestry
- Lithuanian 2% European 1%
- Foreign-born
- 25% · Canada, Vietnam
- Languages at home
- 56% English-only · Spanish 37% Vietnamese 4% Other Indo-European 1%
Political lean MEDSL · Jefferson
- 2024 margin
- Lean R (+8.9) · D 45.1% · R 54.0%
- 2008→2024 swing
- -11.1pp toward R · 2008: 2.2pp · 2024: -8.9pp
- All cycles
- 2024: R+8.9 2020: R+1.6 2016: R+0.5 2012: D+1.6 2008: D+2.2
Not yet ingested
- Civics
- —
Market trends
- HPI YoY
- ▼ -86.58%
- Current HPI
- 152.1615
- Rent YoY
- ▲ 14.42%
- Metro
- Beaumont-Port Arthur, TX
- State GDP YoY
- ▲ 3.95%
- F500 in state
- 110
Industry mix (Fortune 500 HQ in TX)
| Industry | F500 HQs | Revenue |
|---|---|---|
| Energy | 16 | $1,198B |
|
||
| Technology | 5 | $198B |
|
||
| Engineering / Construction | 4 | $72B |
|
||
| Energy Services | 3 | $60B |
|
||
| Utilities | 3 | $41B |
|
||
| Healthcare | 2 | $330B |
|
||
Price history
-7.4% since first listed6 events — show timeline
- 2026-05-16 Price Changed $249,000 BBOR
- 2026-05-16 Price Changed $249,000 HARMLS
- 2026-04-25 Price Changed $259,000 HARMLS
- 2026-04-23 Price Changed $259,000 BBOR
- 2026-04-14 Listed $269,000 HARMLS
- 2026-03-26 Listed $269,000 BBOR
Property tax history
+11.5%/yrLatest (2025): $3,969 · +3.6% YoY. Source: county tax records.
Cash-flow waterfall
monthlySold comps — $/sqft
last 12 mo · ≤1 miLoading sold comps…