 Multi-family
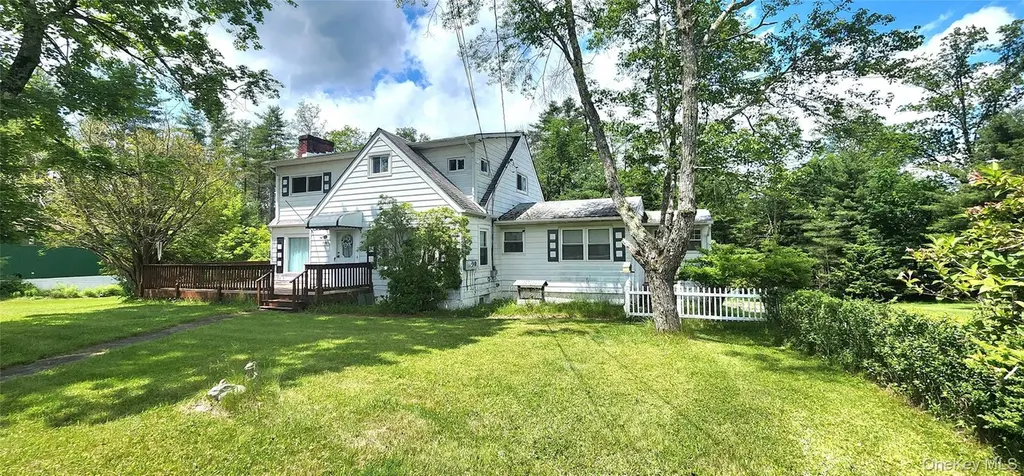
530 Sackett Lake Rd · Mongaup Valley, NY
Flood risk 1/10 · Minimal
- FEMA flood zone
- X (unshaded)
- Chance of flooding over 30 yrs
- 0.0%
- Est. flood insurance / yr
- $473 – $860
Fire risk 2/10 · Minimal
- Est. fire insurance / yr
- $691 – $1,283
Heat risk 2/10 · Minimal
- Hot days now (above 91°F)
- 7 days/yr
- Hot days in 30 yrs
- 15 days/yr
Wind risk 2/10 · Minimal
- Chance of severe wind over 30 yrs
- 4.0%
Air-quality risk 2/10 · Minimal
- Unhealthy air days now
- 1 days/yr
- Unhealthy air days in 30 yrs
- 1 days/yr
Risk factors via First Street. Map © Google.
Why this score? — see what drove the D- grade
The composite is a weighted blend of 9 inputs, each scored 0–100. Each bar is that input's sub-score; the figure is the points it added to the 100-point composite (weight × sub-score).
- ARV discount +14.4/15.0
- Appreciation +10.0/10.0
- Cash flow +4.3/30.0
- Rent growth +2.5/5.0
- Schools +2.5/10.0
- Livability +2.5/5.0
- Condition / age +2.5/5.0
- 1% rule +0.3/10.0
- DSCR +0.0/10.0
$425,000
🖨 Deal sheet (PDF) 📄 Offer letter ✓ Due diligence
Multi-family units
County records classify this as Multi-Family (2-4 Unit). Listing-text estimate: 1 unit. estimate disagrees with records
Listing remarks MLS
Beautiful and Spacious Cape Home in Sackett Lake Area! Discover this solid, well-maintained Cape Cod-style home, legally zoned as a two-family residence, with flexibility to be used as a single-family home. Located just steps from Sackett Lake, the property includes beach access for lakeside enjoyment. The main level welcomes you with an entry room leading into a kitchen, a formal dining room, and an elegant living room featuring a stunning granite stone fireplace. There’s one spacious bedroom on the main floor, as well as a second bedroom and a full tiled bathroom. Upstairs, you’ll find two additional bedrooms, a second kitchen, and another full bath—perfect for guests or extended family. The home showcases beautiful hardwood flooring throughout and custom built-ins for added character. This home is like a time capsule and needs to be undated to the modern needs. but well worth it since its functional . The full basement, once finished as extra living space, is now unfinished but includes a full bath—offering great potential for future expansion. Other highlights include oil heat, town sewer, and a generous 1.2-acre lot, plus an additional 0.25-acre parcel with possible building potential. Conveniently located near all Sullivan County amenities, this home offers space, flexibility, and an unbeatable location in a lake community
Key facts
- 1.2 acre lot
- Garage
- Built 1930
Neighborhood map
What this means for you Summary
Snapshot
- This is a 4-bed/3.0-bath multifamily listed at $425k.
Deal economics
- At list price, monthly cash flow is $-1k ($-14k/yr) — negative.
- To cash-flow at today's rent, offer at most $224k (47.4% below list).
- To meet the 1% rule (rent ≥ 1% of price), the offer needs to be $226k (46.7% below list).
- Recommended offer: $224k (47.4% below list) — sets the bar for cash-flow.
- Cap rate 3.1% vs local median 1.9% in Mongaup Valley — top-decile yield for the area; either an underpriced asset or a hidden risk that comps aren't pricing in. Stress-test before assuming the spread holds.
Location & tenants
- Location reads: area grade D — affects rentability + tenant quality, not the cash-flow math above.
- Monticello Central School District (town): math 29% / reading 30% proficiency, ranked #577 of 590 in NY (top 98%) — low school quality limits family demand, transient renter base, plan for 1-2y turnover.
- Zoned schools: Kenneth L Rutherford School (math 12% / reading 20%, grade F, #2,020 of 2,108 statewide, top 96%, 492 students, 81% FRL); Robert J Kaiser Middle School (math 7% / reading 35%, grade F, #661 of 729 statewide, top 91%, 595 students, 66% FRL); Monticello High School (math 82% / reading 34%, grade C, #879 of 1,100 statewide, top 80%, 844 students, 63% FRL) — zoned schools average 70% FRL vs 50% district-wide (20 pts higher); higher-poverty schools than district average — tighter screening recommended.
- Market conditions: 188 active listings in the ZIP; 739 units permitted in Sullivan County in 2024 (5 in 5+ unit buildings).
- At $2,264/mo this rent would consume 47% of the median local household income ($57k/yr) (locally 814% of renters already pay >50% of income on rent) — very limited rent-growth headroom before tenants either downsize or default.
Forward outlook
- In year one you build about $45k of equity ($3k loan paydown + $42k appreciation (10.0% local appreciation)).
- Sullivan County population projected at -24% by 2050 — secular population decline; favor cash flow + early exit over multi-decade hold.
- By year 2, paydown + projected appreciation supports a ~$73k cash-out refi (75% LTV) — recoverable capital for the next deal without selling this one.
Negotiation context
- It's been on market 68 days — a 6% lower offer ($400k) is reasonable based on typical stale-listing flexibility.
- 2 sale attempts with the ask held roughly flat each time — persistent listings suggest the price (not the market) is what's stuck; bring a comps-based counter.
- Current owner paid $90k; list at $425k implies a 372% gain — meaningful room to come down on a strong offer.
Risks & watch-outs
- Watch-outs: built in 1930 — expect roof / HVAC / electrical / plumbing capex.
Questions for the listing agent
- What do current leases actually rent for vs. the listed asking? Can we see a recent rent roll and the last 12 months of T-12 income?
- It's been on market 68 days. Have you received any prior offers? Is the seller open to a 47% concession, seller financing, or rate buy-down credit?
- Built in 1930 — when were the roof, HVAC, electrical panel, plumbing, and water heater last replaced?
- Why hasn't it sold? Are there any deal-killer items the seller is aware of (foundation, flood, title, zoning, code violations)?
- Is there a deadline driving the sale (1031 exchange, divorce, estate, relocation)? That informs how much negotiation room exists.
- The area grade is low — what's the realistic commute time and amenity access for the typical tenant pool here? Any planned neighborhood developments (good or bad) we should know about?
- What's the average days-on-market for RENTAL listings here right now (not sales)? A rising rental-DOM trend means longer vacancies and softer asking-rent achievability than the comps imply.
- What's the recent tenant-quality profile in this submarket — average credit score on applications, eviction rate, late-payment / NSF rate, and stable-employment percentage? A property-management company in the area should have these aggregated.
- How much new apartment / multifamily construction is in the pipeline within 1–3 miles? Heavy new supply (>2% of stock underway) typically softens rents 12–24 months out; light construction supports rent growth.
Investment metrics
- 1% rule
- 0.53% ✗
- Cap rate
- 3.07%
- Cash-on-cash
- -11.50%
- DSCR
- 0.49
- GRM
- 15.6
CMA / ARV
- ARV (median comp)
- $502,620
- List price
- $425,000
- Delta
- -15.44%
- Verdict
- UNDERPRICED
- Comps
- 10 within 1.0 mi
Projected returns pro-forma
10.0% appreciation · 3.0% rent growth · sell at horizon
- IRR
- 16.2%
- Equity multiple
- 2.34×
- Total profit
- $158,887
- Equity at exit
- $382,874
- IRR
- 15.6%
- Equity multiple
- 5.41×
- Total profit
- $525,052
- Equity at exit
- $825,682
Cash invested: $119,000 (down + closing). Projections, not guarantees.
Landlord ↔ Tenant lean methodology
- Overall (STATE)
- 15 Strongly Tenant-Friendly
- State New York
- 15 Strongly Tenant-Friendly · D+10
- County
- — inherits STATE
- City
- — inherits STATE
ZIP-level market 12701
- Home prices YoY
- 16.7%
- Active inventory
- 188
- Price-to-rent
- 15.6×
Monthly cashflow live
- Estimated rent
- $2,264 medium interval (Pro) →
- Mortgage (P&I)
- −$2,229
- Tax from tax record
- −$523 /mo · $6,271/yr
- Insurance
- −$177
- HOA
- −$0
- Vacancy / Maint / Mgmt
- −$475
- Net cashflow
- $-1,140
Break-even live
Sensitivity live
| Price | -10% $-899 | -5% $-1,020 | +0% $-1,140 | +5% $-1,260 | +10% $-1,381 |
|---|---|---|---|---|---|
| Rent | -10% $-1,319 | -5% $-1,229 | +0% $-1,140 | +5% $-1,051 | +10% $-961 |
| Rate | -1.0pp $-926 | -0.5pp $-1,032 | base $-1,140 | +0.5pp $-1,250 | +1.0pp $-1,362 |
UW: 25.0% down · 7.5% · 30yr · 1.5% tax · 5.0% vac · 8.0% maint · 8.0% mgmt
Financing live
Cash to close
- Down payment
- $106,250
- Closing costs
- $12,750
- Reserves months
- —
- Total cash needed
- —
Loan-product check · same deal, 3 products live
Conventional
25% down · 7.5% · 30yr
- Down + closing
- —
- Monthly P&I
- —
- Monthly cashflow
- —
- DSCR
- —
- Eligible?
- —
Personal DTI + credit; lowest rate.
DSCR
20% down · 8.5% · 30yr
- Down + closing
- —
- Monthly P&I
- —
- Monthly cashflow
- —
- DSCR
- —
- Eligible?
- —
No personal income docs; deal must DSCR.
Hard money
10% down · 12.0% · 12mo
- Down + closing
- —
- Monthly P&I
- —
- Monthly cashflow
- —
- DSCR
- —
- Eligible?
- —
Short-term bridge; refi at stabilization.
Listing history 19 events
-
2026-06-21days on market $425,000 Active 68 DOM
-
2026-06-18days on market $425,000 Active 65 DOM
-
2026-06-17days on market $425,000 Active 64 DOM
-
2026-06-16days on market $425,000 Active 63 DOM
-
2026-06-15days on market $425,000 Active 62 DOM
-
2026-06-14days on market $425,000 Active 60 DOM
-
2026-06-10days on market $425,000 Active 57 DOM
-
2026-06-09days on market $425,000 Active 56 DOM
-
2026-06-08days on market $425,000 Active 55 DOM
-
2026-06-07days on market $425,000 Active 54 DOM
-
2026-06-03days on market $425,000 Active 50 DOM
-
2026-06-02days on market $425,000 Active 49 DOM
-
2026-06-01days on market $425,000 Active 48 DOM
-
2026-05-31days on market $425,000 Active 47 DOM
-
2026-05-31days on market $425,000 Active 46 DOM
-
2026-04-14$425,000 Active 1375-char remark
Show marketing remark (1375 chars)
Beautiful and Spacious Cape Home in Sackett Lake Area! Discover this solid, well-maintained Cape Cod-style home, legally zoned as a two-family residence, with flexibility to be used as a single-family home. Located just steps from Sackett Lake, the property includes beach access for lakeside enjoyment. The main level welcomes you with an entry room leading into a kitchen, a formal dining room, and an elegant living room featuring a stunning granite stone fireplace. There’s one spacious bedroom on the main floor, as well as a second bedroom and a full tiled bathroom. Upstairs, you’ll find two additional bedrooms, a second kitchen, and another full bath—perfect for guests or extended family. The home showcases beautiful hardwood flooring throughout and custom built-ins for added character. This home is like a time capsule and needs to be undated to the modern needs. but well worth it since its functional . The full basement, once finished as extra living space, is now unfinished but includes a full bath—offering great potential for future expansion. Other highlights include oil heat, town sewer, and a generous 1.2-acre lot, plus an additional 0.25-acre parcel with possible building potential. Conveniently located near all Sullivan County amenities, this home offers space, flexibility, and an unbeatable location in a lake community
-
2026-01-01historical
-
2025-06-21$475,000 Active
-
2001-10-17soldstatus $90,000
ⓘ Source: listings_history table (triggers on properties + properties_extension) + one-shot
backfill from property_details.listing_events for pre-trigger history.
Tax reassessment forecast NY · Partial reset (capped growth)
- Current annual tax
- $6,271 · $523/mo
- Projected year-2 tax
- $6,727 · $561/mo
- Expected delta
- +$456/yr (+$38/mo · 7.3%)
ⓘ Screening estimate from a state-policy table — verify with the county assessor before closing.
Climate risk First Street
- Flood 1/10 Low FEMA zone X (unshaded) · 0% chance over 30 yrs
- Wildfire 2/10 Low
- Heat 2/10 Low 7 d/yr ≥91°F today · 15 d/yr by 30 yrs out
- Wind 2/10 Low 4% chance of damaging wind over 30 yrs
- Air quality 2/10 Low 1 unhealthy d/yr today · 1 by 30 yrs out
Nearby sold comps map
Loading sold comps map…
Walkable amenities ~0.75 mi
Loading nearby amenities…
Taxation est. · year 1
- Rental income
- $27,165
- − Mortgage interest
- −$23,807
- − Property taxes
- −$6,271
- − Insurance
- −$2,125
- − Repairs & maintenance
- −$2,173
- − Management
- −$2,173
- − Depreciation
- −$12,364
- Taxable loss
- −$21,747
- Est. tax savings @ 24.0%
- +$5,219
- After-tax cash flow
- $-8,461/yr
For passive investors: Depreciation is non-cash, so a rental often shows a tax loss while cash-flowing — sheltering income. Rental losses are passive: they offset passive income freely, and up to $25,000/yr can offset ordinary (W-2) income if you actively participate and your MAGI is under $100k (phasing out to $0 by $150k); unused losses carry forward. On sale, claimed depreciation is recaptured at up to 25%, and gains may owe capital-gains tax (a 1031 exchange can defer both). Figures are a year-1 estimate at your 24.0% rate — not tax advice; consult a CPA.
Schools (NCES district)
- District
- Monticello Central School District
- NCES district ID
- 3619740
- Math proficiency
- 29% ▼ -4.00%
- Reading proficiency
- 30% ▼ -2.00%
- Median HH income
- $44,696
- Composite
- 25.28/100
- National rank
- #7491
- State rank
- #577 of 590 in NY
Livability — Mongaup Valley
No livability data for this city. (Only ~50 U.S. cities are tracked.)
Census & demographics
- County
- Sullivan County · 12,197 people
- City population
- 2,661
- Metro
- nan
- Population (ZIP)
- 12,197
- Household income
- $57,222
- Rent vs Own
- Severe rent burden
- 814.0
Population outlook (Sullivan County) Hauer SSP2
- Today (2025)
- 68,974 people
- By 2030
- 65,609 · -4.9%
- By 2040
- 58,878 · -14.6%
- By 2050
- 52,500 · -23.9%
- By 2075
- 39,941 · -42.1%
- By 2100
- 28,880 · -58.1%
Race, ethnicity, and origin ACS 2023
- Neighborhood character
- Diverse neighborhood (Simpson 0.69)
- Race & ethnicity
- White 43% Hispanic / Latino 31% Black 15% Two or more races 15% Asian 5%
- Hispanic origin (detail)
- Mexican 1% Puerto Rican 19% Dominican 3%
- Common ancestry
- Scotch-Irish 3% Romanian 2% Iranian 1%
- Foreign-born
- 15% · Canada, China, Jamaica
- Languages at home
- 71% English-only · Spanish 20% Other Indo-European 3% Russian/Polish/Slavic 2%
Political lean MEDSL · Sullivan
- 2024 margin
- R (+16.7) · D 41.6% · R 58.4%
- 2008→2024 swing
- -26.2pp toward R · 2008: 9.5pp · 2024: -16.7pp
- All cycles
- 2024: R+16.7 2020: R+9.2 2016: R+13.7 2012: D+10.4 2008: D+9.5
Not yet ingested
- Civics
- —
Market trends
- HPI YoY
- ▲ 72.71%
- Current HPI
- 507.739
- Rent YoY
- —
- Metro
- nan
- State GDP YoY
- ▲ 2.60%
- F500 in state
- 92
Industry mix (Fortune 500 HQ in NY)
| Industry | F500 HQs | Revenue |
|---|---|---|
| Financial Services | 10 | $950B |
|
||
| Consumer Goods | 9 | $162B |
|
||
| Insurance | 4 | $225B |
|
||
| Telecommunications | 2 | $144B |
|
||
| Pharmaceuticals | 2 | $112B |
|
||
| Media / Entertainment | 2 | $69B |
|
||
Price history
+372.2% since first listed4 events — show timeline
- 2026-04-14 Listed $425,000 OneKey® MLS as Distributed by MLS Grid
- 2026-01-01 Listing Removed — OneKey® MLS as Distributed by MLS Grid
- 2025-06-21 Listed $475,000 OneKey® MLS as Distributed by MLS Grid
- 2001-10-17 Sold (Public Records) $90,000 Public Records
Property tax history
+0.8%/yrLatest (2025): $6,271 · +2.4% YoY. Source: county tax records.
Cash-flow waterfall
monthlySold comps — $/sqft
last 12 mo · ≤1 miLoading sold comps…