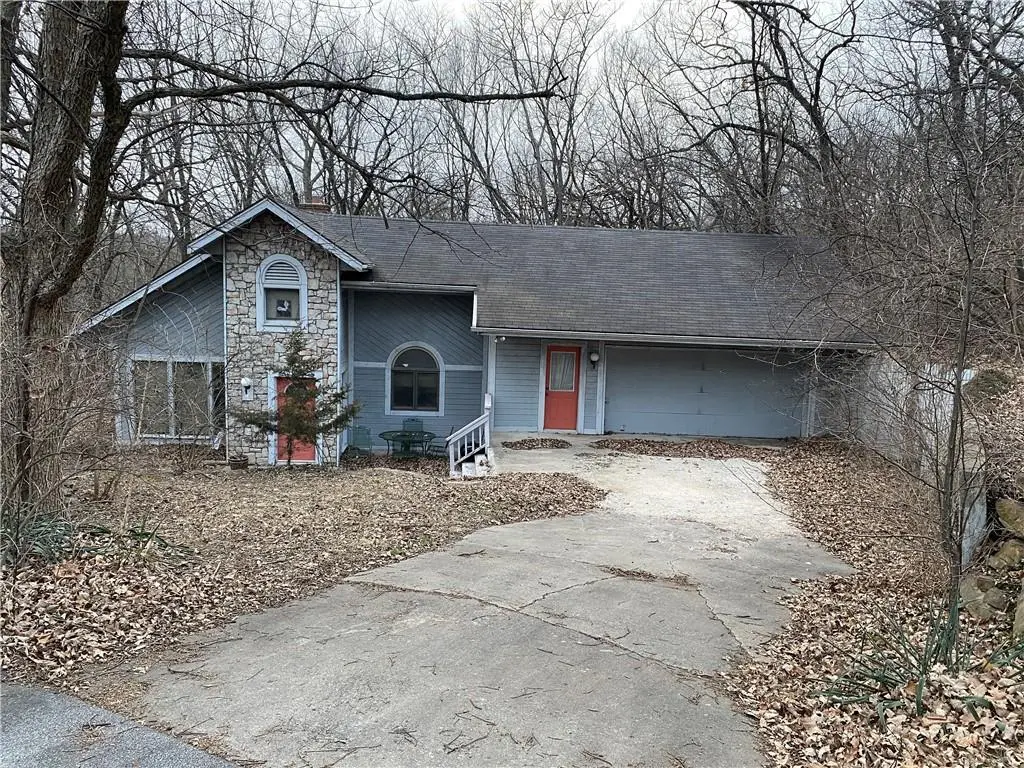
7610 NW Paradise Ln · Parkville, MO
Flood risk 1/10 · Minimal
- FEMA flood zone
- X (unshaded)
- Chance of flooding over 30 yrs
- 0.0%
- Est. flood insurance / yr
- $473 – $860
Fire risk 1/10 · Minimal
- Est. fire insurance / yr
- $1,054 – $1,958
Heat risk 4/10 · Minor
- Hot days now (above 106°F)
- 7 days/yr
- Hot days in 30 yrs
- 17 days/yr
Wind risk 2/10 · Minimal
- Chance of severe wind over 30 yrs
- —
Air-quality risk 2/10 · Minimal
- Unhealthy air days now
- 2 days/yr
- Unhealthy air days in 30 yrs
- 2 days/yr
Risk factors via First Street. Map © Google.
Why this score? — see what drove the D grade
The composite is a weighted blend of 9 inputs, each scored 0–100. Each bar is that input's sub-score; the figure is the points it added to the 100-point composite (weight × sub-score).
- ARV discount +11.6/15.0
- Appreciation +10.0/10.0
- Cash flow +5.4/30.0
- Schools +4.5/10.0
- Rent growth +4.3/5.0
- Livability +3.8/5.0
- Condition / age +2.5/5.0
- 1% rule +0.2/10.0
- DSCR +0.0/10.0
$415,000
🖨 Deal sheet (PDF) 📄 Offer letter ✓ Due diligence
Listing remarks MLS
Just West of downtown Parkville you'll find this one of a kind home. This property is occupied, please do not disturb occupants.
Key facts
- 0.5 acre lot
- 2 garage spots
- Built 1987
Neighborhood map
What this means for you Summary
Snapshot
- This is a 3-bed/2.5-bath single-family listed at $415k.
Deal economics
- At list price, monthly cash flow is $-901 ($-11k/yr) — negative.
- To cash-flow at today's rent, offer at most $256k (38.3% below list).
- To meet the 1% rule (rent ≥ 1% of price), the offer needs to be $214k (48.4% below list).
- Recommended offer: $214k (48.4% below list) — sets the bar for 1% rule.
- Cap rate 3.7% vs local median 1.7% in Parkville — top-decile yield for the area; either an underpriced asset or a hidden risk that comps aren't pricing in. Stress-test before assuming the spread holds.
Location & tenants
- Location reads 76/100 on livability (#51 in MO, #3,695 nationally) — a middle-class / working-renter tenant base. Strengths: crime A+, employment A+, housing A+; Watch: health & safety C-, amenities F, commute F.
- Park Hill (urban): math 47% / reading 54% proficiency, ranked #26 of 324 in MO (top 8%) — acceptable for families but not a draw, mixed tenant base, ~2y average lease.
- Zoned schools: Hawthorn Elem. (math 61% / reading 63%, grade B, #98 of 1,115 statewide, top 10%, 452 students, 19% FRL); Plaza Middle (math 37% / reading 51%, grade D, #121 of 391 statewide, top 32%, 715 students, 30% FRL); Park Hill South High (math 67% / reading 69%, grade B, #13 of 521 statewide, top 2%, 1,860 students, 25% FRL) — zoned schools at 25% FRL track the district average.
- Market conditions: Rents rising fast (+7.0%/yr); 268 active listings in the ZIP; 1 comparable units currently listed for rent nearby; high-income renter base; 234 units permitted in Platte County in 2024 (0 in 5+ unit buildings).
Forward outlook
- In year one you build about $44k of equity ($3k loan paydown + $42k appreciation (10.0% local appreciation)).
- Platte County population projected at +31% by 2050 — long-run rental-demand tailwind backs the buy-and-hold thesis.
- By year 2, paydown + projected appreciation supports a ~$71k cash-out refi (75% LTV) — recoverable capital for the next deal without selling this one.
Negotiation context
- It's been on market 82 days — a 6% lower offer ($390k) is reasonable based on typical stale-listing flexibility.
- 3 sale attempts since 14y ago with the ask held roughly flat each time — persistent listings suggest the price (not the market) is what's stuck; bring a comps-based counter.
Questions for the listing agent
- What do current leases actually rent for vs. the listed asking? Can we see a recent rent roll and the last 12 months of T-12 income?
- It's been on market 82 days. Have you received any prior offers? Is the seller open to a 48% concession, seller financing, or rate buy-down credit?
- Why hasn't it sold? Are there any deal-killer items the seller is aware of (foundation, flood, title, zoning, code violations)?
- Is there a deadline driving the sale (1031 exchange, divorce, estate, relocation)? That informs how much negotiation room exists.
- Schools are B-rated — typically a magnet for longer-tenancy family renters. What's the average tenant stay here, and is there a school-zone premium baked into asking?
- The area grade is low — what's the realistic commute time and amenity access for the typical tenant pool here? Any planned neighborhood developments (good or bad) we should know about?
- What's the average days-on-market for RENTAL listings here right now (not sales)? A rising rental-DOM trend means longer vacancies and softer asking-rent achievability than the comps imply.
- What's the recent tenant-quality profile in this submarket — average credit score on applications, eviction rate, late-payment / NSF rate, and stable-employment percentage? A property-management company in the area should have these aggregated.
- How much new for-sale + rental construction is in the pipeline within 1–3 miles? Heavy new supply typically softens prices + rents 12–24 months out; constrained supply supports both.
Investment metrics
- 1% rule
- 0.52% ✗
- Cap rate
- 3.69%
- Cash-on-cash
- -9.30%
- DSCR
- 0.59
- GRM
- 16.2
CMA / ARV
- ARV (median comp)
- $456,331
- List price
- $415,000
- Delta
- -9.06%
- Verdict
- FAIR
- Comps
- 20 within 1.0 mi
Show comp detail 7 sales within ~0.75 mi
| Address | Dist | Beds/Ba | Sqft | Sold | Price | $/sf | Match |
|---|---|---|---|---|---|---|---|
| 7807 NW Schott Dr | 0.18mi | 3/2.0 | 1,808 (+9%) | 3mo | $350,000 | $194 | 71 |
| 7585 NW Damon Dr | 0.44mi | 2/2.0 (-1) | 1,636 (-1%) | 14mo | $442,000 | $270 | 59 |
| 13705 NW 75th St | 0.41mi | 3/2.0 | 1,880 (+14%) | 8mo | $399,000 | $212 | 50 |
| 7495 NW Douglas Ct | 0.40mi | 3/3.0 | 1,880 (+14%) | 12mo | $510,000 | $271 | 46 |
| 14912 NW 72nd St | 0.66mi | 2/1.5 (-1) | 1,780 (+8%) | 3mo | $265,000 | $149 | 44 |
| 13890 NW 75th St | 0.32mi | 3/3.0 | 1,880 (+14%) | 23mo | $524,900 | $279 | 41 |
| 13755 NW 75th St | 0.39mi | 3/2.0 | 1,880 (+14%) | 21mo | $435,000 | $231 | 40 |
Match score weights: distance 35% · size 25% · config 20% · recency 20%. Top-matched comps best support the ARV.
Projected returns pro-forma
10.0% appreciation · 7.03% rent growth · sell at horizon
- IRR
- 18.6%
- Equity multiple
- 2.53×
- Total profit
- $177,543
- Equity at exit
- $373,865
- IRR
- 17.9%
- Equity multiple
- 6.07×
- Total profit
- $589,212
- Equity at exit
- $806,254
Cash invested: $116,200 (down + closing). Projections, not guarantees.
Landlord ↔ Tenant lean methodology
- Overall (STATE)
- 81 Strongly Landlord-Friendly
- State Missouri
- 81 Strongly Landlord-Friendly · R+10
- County
- — inherits STATE
- City
- — inherits STATE
ZIP-level market 64152
- Home prices YoY
- 4.7%
- Rents YoY
- 7.0%
- Active inventory
- 268
- Price-to-rent
- 16.2×
Monthly cashflow live
- Estimated rent
- $2,140 medium interval (Pro) →
- Mortgage (P&I)
- −$2,176
- Tax from tax record
- −$242 /mo · $2,907/yr
- Insurance
- −$173
- HOA
- −$0
- Vacancy / Maint / Mgmt
- −$449
- Net cashflow
- $-901
Break-even live
Sensitivity live
| Price | -10% $-666 | -5% $-783 | +0% $-901 | +5% $-1,018 | +10% $-1,136 |
|---|---|---|---|---|---|
| Rent | -10% $-1,070 | -5% $-985 | +0% $-901 | +5% $-816 | +10% $-732 |
| Rate | -1.0pp $-692 | -0.5pp $-795 | base $-901 | +0.5pp $-1,008 | +1.0pp $-1,118 |
UW: 25.0% down · 7.5% · 30yr · 1.5% tax · 5.0% vac · 8.0% maint · 8.0% mgmt
Financing live
Cash to close
- Down payment
- $103,750
- Closing costs
- $12,450
- Reserves months
- —
- Total cash needed
- —
Loan-product check · same deal, 3 products live
Conventional
25% down · 7.5% · 30yr
- Down + closing
- —
- Monthly P&I
- —
- Monthly cashflow
- —
- DSCR
- —
- Eligible?
- —
Personal DTI + credit; lowest rate.
DSCR
20% down · 8.5% · 30yr
- Down + closing
- —
- Monthly P&I
- —
- Monthly cashflow
- —
- DSCR
- —
- Eligible?
- —
No personal income docs; deal must DSCR.
Hard money
10% down · 12.0% · 12mo
- Down + closing
- —
- Monthly P&I
- —
- Monthly cashflow
- —
- DSCR
- —
- Eligible?
- —
Short-term bridge; refi at stabilization.
Rent comps 1 comps
| Address | Beds | Baths | Sqft | Rent | $/sqft | DOM | Units | Dist |
|---|---|---|---|---|---|---|---|---|
| 15310 Trailside Dr Parkville, MO | 1.0–3.0 | 1.0–2.5 | 1137 | $2,639 | $2.32 | 3d | 21 | 1.23mi |
Listing history 19 events
-
2026-06-21days on market $415,000 Active 82 DOM
-
2026-06-18days on market $415,000 Active 79 DOM
-
2026-06-17days on market $415,000 Active 78 DOM
-
2026-06-16days on market $415,000 Active 77 DOM
-
2026-06-15days on market $415,000 Active 76 DOM
-
2026-06-13days on market $415,000 Active 74 DOM
-
2026-06-13days on market $415,000 Active 73 DOM
-
2026-06-09days on market $415,000 Active 70 DOM
-
2026-06-08days on market $415,000 Active 69 DOM
-
2026-06-07days on market $415,000 Active 68 DOM
-
2026-06-03days on market $415,000 Active 64 DOM
-
2026-06-02days on market $415,000 Active 63 DOM
-
2026-06-01days on market $415,000 Active 62 DOM
-
2026-05-31days on market $415,000 Active 61 DOM
-
2026-05-09status Active 128-char remark
Show marketing remark (128 chars)
Just West of downtown Parkville you'll find this one of a kind home. This property is occupied, please do not disturb occupants.
-
2026-05-07status Pending 128-char remark
Show marketing remark (128 chars)
Just West of downtown Parkville you'll find this one of a kind home. This property is occupied, please do not disturb occupants.
-
2026-03-30$415,000 Active 128-char remark
Show marketing remark (128 chars)
Just West of downtown Parkville you'll find this one of a kind home. This property is occupied, please do not disturb occupants.
-
2013-06-20historical
-
2012-09-24$160,250
ⓘ Source: listings_history table (triggers on properties + properties_extension) + one-shot
backfill from property_details.listing_events for pre-trigger history.
Tax reassessment forecast MO · Resets to sale price
- Current annual tax
- $2,907 · $242/mo
- Projected year-2 tax
- $4,026 · $335/mo
- Expected delta
- +$1,119/yr (+$93/mo · 38.5%)
ⓘ Screening estimate from a state-policy table — verify with the county assessor before closing.
Climate risk First Street
- Flood 1/10 Low FEMA zone X (unshaded) · 0% chance over 30 yrs
- Wildfire 1/10 Low
- Heat 4/10 Moderate 7 d/yr ≥106°F today · 17 d/yr by 30 yrs out
- Wind 2/10 Low
- Air quality 2/10 Low 2 unhealthy d/yr today · 2 by 30 yrs out
Nearby sold comps map
Loading sold comps map…
Walkable amenities ~0.75 mi
Loading nearby amenities…
Taxation est. · year 1
- Rental income
- $25,682
- − Mortgage interest
- −$23,246
- − Property taxes
- −$2,907
- − Insurance
- −$2,075
- − Repairs & maintenance
- −$2,055
- − Management
- −$2,055
- − Depreciation
- −$12,073
- Taxable loss
- −$18,728
- Est. tax savings @ 24.0%
- +$4,495
- After-tax cash flow
- $-6,314/yr
For passive investors: Depreciation is non-cash, so a rental often shows a tax loss while cash-flowing — sheltering income. Rental losses are passive: they offset passive income freely, and up to $25,000/yr can offset ordinary (W-2) income if you actively participate and your MAGI is under $100k (phasing out to $0 by $150k); unused losses carry forward. On sale, claimed depreciation is recaptured at up to 25%, and gains may owe capital-gains tax (a 1031 exchange can defer both). Figures are a year-1 estimate at your 24.0% rate — not tax advice; consult a CPA.
Schools (NCES district)
- District
- Park Hill
- NCES district ID
- 2923550
- Math proficiency
- 47% ▼ -3.00%
- Reading proficiency
- 54% ▼ -3.00%
- Median HH income
- $67,616
- Composite
- 44.86/100
- National rank
- #2723
- State rank
- #26 of 324 in MO
Livability — Parkville
- Score
- 76/100
- State rank
- #51
- US rank
- #3695
Category grades
Schools grade is shown separately in the Schools card above.
Census & demographics
- County
- Platte County · 100,198 people
- Metro
- Kansas City, MO-KS
- Population (ZIP)
- 31,545
- Household income
- $114,688
- Rent vs Own
- Severe rent burden
- 234.0
Population outlook (Platte County) Hauer SSP2
- Today (2025)
- 111,772 people
- By 2030
- 119,173 · +6.6%
- By 2040
- 133,326 · +19.3%
- By 2050
- 146,617 · +31.2%
- By 2075
- 178,626 · +59.8%
- By 2100
- 195,638 · +75.0%
Race, ethnicity, and origin ACS 2023
- Neighborhood character
- Predominantly White (82%)
- Race & ethnicity
- White 82% Hispanic / Latino 7% Two or more races 6% Black 3% Asian 2%
- Hispanic origin (detail)
- Mexican 5% Puerto Rican 1%
- Common ancestry
- Romanian 4% Italian 4% Slovak 4%
- Foreign-born
- 4% · Canada, China
- Languages at home
- 93% English-only · Spanish 3% Other Indo-European 1% German/W. Germanic 1%
Political lean MEDSL · Platte
- 2024 margin
- Toss-up / Even · D 47.7% · R 50.8% · Other 1.4%
- 2008→2024 swing
- +3.2pp toward D · 2008: -6.4pp · 2024: -3.1pp
- All cycles
- 2024: R+3.1 2020: R+3.0 2016: R+13.0 2012: R+14.2 2008: R+6.4
Not yet ingested
- Civics
- —
Market trends
- HPI YoY
- ▲ 33.10%
- Current HPI
- 739.89
- Rent YoY
- ▲ 7.03%
- Metro
- Kansas City, MO-KS
- State GDP YoY
- ▲ 1.84%
- F500 in state
- 20
Industry mix (Fortune 500 HQ in MO)
| Industry | F500 HQs | Revenue |
|---|---|---|
| Healthcare | 1 | $163B |
|
||
| Insurance | 1 | $21B |
|
||
| Industrial Technology | 1 | $17B |
|
||
| Retail | 1 | $16B |
|
||
| Industrial Distribution | 1 | $10B |
|
||
| Utilities | 1 | $9B |
|
||
Price history
+159.0% since first listed5 events — show timeline
- 2026-05-09 Relisted — Heartland MLS as Distributed by MLS Grid
- 2026-05-07 Pending — Heartland MLS as Distributed by MLS Grid
- 2026-03-30 Listed $415,000 Heartland MLS as Distributed by MLS Grid
- 2013-06-20 Listing Removed — Heartland MLS as Distributed by MLS Grid
- 2012-09-24 Listed $160,250 Heartland MLS as Distributed by MLS Grid
Property tax history
+0.9%/yrLatest (2025): $2,907 · +12.0% YoY. Source: county tax records.
Cash-flow waterfall
monthlySold comps — $/sqft
last 12 mo · ≤1 miLoading sold comps…