509 W North Ave · Bonifay, FL
Flood risk 1/10 · Minimal
- FEMA flood zone
- X (unshaded)
- Chance of flooding over 30 yrs
- 0.0%
- Est. flood insurance / yr
- $507 – $1,088
Fire risk 5/10 · Moderate
- Est. fire insurance / yr
- $947 – $1,759
Heat risk 8/10 · Major
- Hot days now (above 107°F)
- 7 days/yr
- Hot days in 30 yrs
- 19 days/yr
Wind risk 9/10 · Severe
- Chance of severe wind over 30 yrs
- 99.0%
Air-quality risk 2/10 · Minimal
- Unhealthy air days now
- 1 days/yr
- Unhealthy air days in 30 yrs
- 1 days/yr
Risk factors via First Street. Map © Google.
Why this score? — see what drove the B+ grade
The composite is a weighted blend of 9 inputs, each scored 0–100. Each bar is that input's sub-score; the figure is the points it added to the 100-point composite (weight × sub-score).
- Cash flow +30.0/30.0
- 1% rule +10.0/10.0
- DSCR +10.0/10.0
- Appreciation +10.0/10.0
- ARV discount +7.5/15.0
- Schools +3.7/10.0
- Livability +3.4/5.0
- Rent growth +2.5/5.0
- Condition / age +2.5/5.0
$39,000
🖨 Deal sheet (PDF) 📄 Offer letter ✓ Due diligence
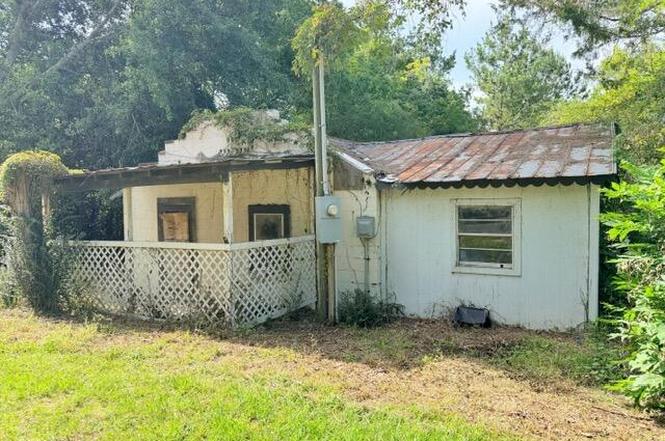
Listing remarks
Fixer-Upper Opportunity on West North Avenue - Bonifay, Florida Unlock the potential of this versatile property located on highly visible West North Avenue in the growing community of Bonifay. Situated on approximately 0.25 acre (+/-) to be determined by survey, this property offers an excellent opportunity for investors, builders, small business owners, or buyers looking for an affordable renovation project. The property features an existing block construction home that could be restored and renovated or removed to make way for new development. Also included is a utility building that provides additional storage or workspace potential. A power pole is already in place, and the property
Key facts
- Excellent visibility
- Access to city water
- Utility building
Tags
Property features AI
Finance
- HOA & community: Short-term rentals allowed
Exterior
- Utilities: Electricity available
- Home design: Block construction
- Construction: Metal roof; Block construction
- Exterior features: Shed(s); City street frontage on a public maintained road; Irregular lot shape
Interior
- Bathrooms: 1 full bathroom
- Interior features: Living room
Neighborhood map
What this means for you Summary
Snapshot
- This is a 1-bed/1.0-bath single-family listed at $39k.
Deal economics
- At list price, monthly cash flow is $310 ($4k/yr) — positive.
- The deal already cash-flows at list — no discount required.
- Meets the 1% rule at list price ($736 rent vs $39k).
- Cap rate 15.8% vs local median 3.8% in Bonifay — top-decile yield for the area; either an underpriced asset or a hidden risk that comps aren't pricing in. Stress-test before assuming the spread holds.
Location & tenants
- Location reads 67/100 on livability (#577 in FL) — a middle-class / working-renter tenant base. Strengths: crime A+, cost of living A+, housing A+; Watch: amenities F, commute F, employment F.
- Holmes (rural): math 44% / reading 45% proficiency, ranked #53 of 73 in FL (top 73%) — families likely to look elsewhere, expect single-tenant / working-renter base with shorter leases.
- Zoned schools: Ponce De Leon Elementary School (math 42% / reading 52%, grade D-, #1,191 of 2,144 statewide, top 57%, 308 students, 58% FRL); Holmes County High School (math 22% / reading 50%, grade F, #359 of 667 statewide, top 55%, 453 students, 49% FRL) — zoned schools at 54% FRL track the district average.
- Market conditions: 144 active listings in the ZIP; 3 comparable units currently listed for rent nearby; rentals at typical pace (median 23d on market — plan ~3-4 weeks tenant-placement turnaround); 12 units permitted in Holmes County in 2024 (0 in 5+ unit buildings).
Forward outlook
- In year one you build about $4k of equity ($270 loan paydown + $4k appreciation (10.0% local appreciation)).
- Holmes County population projected at -17% by 2050 — secular population decline; favor cash flow + early exit over multi-decade hold.
- At projected returns (10.0% appreciation + 3.0% rent growth), your $11k cash investment doubles in ~2 years — after that, you're playing with house money.
- By year 7, paydown + projected appreciation supports a ~$30k cash-out refi (75% LTV) — recoverable capital for the next deal without selling this one.
Negotiation context
- Only 10 days on market — expect competitive offers; lowballing is unlikely to land.
- Current owner paid $25k; list at $39k implies a 56% gain — meaningful room to come down on a strong offer.
Risks & watch-outs
- Watch-outs: built in 1950 — expect roof / HVAC / electrical / plumbing capex.
- Climate carrying-cost: severe wind risk, 99% chance of damaging wind over 30y; moderate wildfire risk; extreme-heat days projected 7→19/yr by 2055 (HVAC capex compounding) — expect insurance premiums to compound above CPI over the hold.
Questions for the listing agent
- Built in 1950 — when were the roof, HVAC, electrical panel, plumbing, and water heater last replaced?
- Is there a deadline driving the sale (1031 exchange, divorce, estate, relocation)? That informs how much negotiation room exists.
- Schools are D-rated, which usually means shorter tenancies and higher turnover. Who's the typical renter profile here, and what's been the actual vacancy rate?
- What's the average days-on-market for RENTAL listings here right now (not sales)? A rising rental-DOM trend means longer vacancies and softer asking-rent achievability than the comps imply.
- What's the recent tenant-quality profile in this submarket — average credit score on applications, eviction rate, late-payment / NSF rate, and stable-employment percentage? A property-management company in the area should have these aggregated.
- How much new for-sale + rental construction is in the pipeline within 1–3 miles? Heavy new supply typically softens prices + rents 12–24 months out; constrained supply supports both.
Investment metrics
- 1% rule
- 1.89% ✓
- Cap rate
- 15.84%
- Cash-on-cash
- 34.09%
- DSCR
- 2.52
- GRM
- 4.4
CMA / ARV
- ARV (on-the-fly)
- $20,880
- Comps found
- 1
Show comp detail 1 sale within ~0.75 mi
| Address | Dist | Beds/Ba | Sqft | Sold | Price | $/sf | Match |
|---|---|---|---|---|---|---|---|
| 611 S Varner St | 0.69mi | 2/1.0 (+1) | 768 (+7%) | 14mo | $22,000 | $29 | 40 |
Match score weights: distance 35% · size 25% · config 20% · recency 20%. Top-matched comps best support the ARV.
Projected returns pro-forma
10.0% appreciation · 3.0% rent growth · sell at horizon
- IRR
- 50.4%
- Equity multiple
- 4.76×
- Total profit
- $41,013
- Equity at exit
- $35,134
- IRR
- 44.1%
- Equity multiple
- 10.64×
- Total profit
- $105,261
- Equity at exit
- $75,768
Cash invested: $10,920 (down + closing). Projections, not guarantees.
Landlord ↔ Tenant lean methodology
- Overall (STATE)
- 87 Strongly Landlord-Friendly
- State Florida
- 87 Strongly Landlord-Friendly · R+3
- County
- — inherits STATE
- City
- — inherits STATE
ZIP-level market 32425
- Home prices YoY
- 16.2%
- Active inventory
- 144
- Price-to-rent
- 4.4×
Monthly cashflow live
- Estimated rent
- $736 medium interval (Pro) →
- Mortgage (P&I)
- −$205
- Tax from tax record
- −$51 /mo · $607/yr
- Insurance
- −$16
- HOA
- −$0
- Vacancy / Maint / Mgmt
- −$155
- Net cashflow
- $310
Break-even live
Sensitivity live
| Price | -10% $332 | -5% $321 | +0% $310 | +5% $299 | +10% $288 |
|---|---|---|---|---|---|
| Rent | -10% $252 | -5% $281 | +0% $310 | +5% $339 | +10% $368 |
| Rate | -1.0pp $330 | -0.5pp $320 | base $310 | +0.5pp $300 | +1.0pp $290 |
UW: 25.0% down · 7.5% · 30yr · 1.5% tax · 5.0% vac · 8.0% maint · 8.0% mgmt
Financing live
Cash to close
- Down payment
- $9,750
- Closing costs
- $1,170
- Reserves months
- —
- Total cash needed
- —
Loan-product check · same deal, 3 products live
Conventional
25% down · 7.5% · 30yr
- Down + closing
- —
- Monthly P&I
- —
- Monthly cashflow
- —
- DSCR
- —
- Eligible?
- —
Personal DTI + credit; lowest rate.
DSCR
20% down · 8.5% · 30yr
- Down + closing
- —
- Monthly P&I
- —
- Monthly cashflow
- —
- DSCR
- —
- Eligible?
- —
No personal income docs; deal must DSCR.
Hard money
10% down · 12.0% · 12mo
- Down + closing
- —
- Monthly P&I
- —
- Monthly cashflow
- —
- DSCR
- —
- Eligible?
- —
Short-term bridge; refi at stabilization.
Rent comps 3 comps
| Address | Beds | Baths | Sqft | Rent | $/sqft | DOM | Units | Dist |
|---|---|---|---|---|---|---|---|---|
| 125 Hill Loop Bonifay, FL | 1.0 | 1.0 | 532 | $700 | $1.32 | 22d | 1 | 1.04mi |
| 109 Hill Loop Bonifay, FL | 1.0 | 1.0 | 732 | $750 | $1.02 | 22d | 1 | 1.04mi |
| 117 Hill Loop Bonifay, FL | 1.0 | 1.0 | 702 | $750 | $1.07 | 22d | 1 | 1.05mi |
Listing history 9 events
-
2026-06-22days on market $39,000 Active 10 DOM
-
2026-06-18days on market $39,000 Active 7 DOM
-
2026-06-17price $39,000 Active 6 DOM
-
2026-06-17days on market $55,000 Active 6 DOM
-
2026-06-16days on market $55,000 Active 5 DOM
-
2026-06-15days on market $55,000 Active 4 DOM
-
2026-06-14days on market $55,000 Active 2 DOM
-
2026-06-13remarks 699-char remark
-
2026-06-13$55,000 Active 1 DOM
ⓘ Source: listings_history table (triggers on properties + properties_extension) + one-shot
backfill from property_details.listing_events for pre-trigger history.
Tax reassessment forecast FL · Resets to sale price
- Current annual tax
- $607 · $51/mo
- Projected year-2 tax
- $607 · $51/mo
- Expected delta
- $0/yr ($0/mo · 0.0%)
ⓘ Screening estimate from a state-policy table — verify with the county assessor before closing.
Climate risk First Street
- Flood 1/10 Low FEMA zone X (unshaded) · 0% chance over 30 yrs
- Wildfire 5/10 Major
- Heat 8/10 Severe 7 d/yr ≥107°F today · 19 d/yr by 30 yrs out
- Wind 9/10 Extreme 99% chance of damaging wind over 30 yrs
- Air quality 2/10 Low 1 unhealthy d/yr today · 1 by 30 yrs out
Nearby sold comps map
Loading sold comps map…
Walkable amenities ~0.75 mi
Loading nearby amenities…
Taxation est. · year 1
- Rental income
- $8,835
- − Mortgage interest
- −$2,185
- − Property taxes
- −$607
- − Insurance
- −$195
- − Repairs & maintenance
- −$707
- − Management
- −$707
- − Depreciation
- −$1,135
- Taxable income
- $3,300
- Est. tax owed @ 24.0%
- −$792
- After-tax cash flow
- $2,931/yr
For passive investors: Depreciation is non-cash, so a rental often shows a tax loss while cash-flowing — sheltering income. Rental losses are passive: they offset passive income freely, and up to $25,000/yr can offset ordinary (W-2) income if you actively participate and your MAGI is under $100k (phasing out to $0 by $150k); unused losses carry forward. On sale, claimed depreciation is recaptured at up to 25%, and gains may owe capital-gains tax (a 1031 exchange can defer both). Figures are a year-1 estimate at your 24.0% rate — not tax advice; consult a CPA.
Schools (NCES district)
- District
- Holmes
- NCES district ID
- 1200900
- Math proficiency
- 44% ▼ -5.00%
- Reading proficiency
- 45% ▼ -7.00%
- Median HH income
- $35,365
- Composite
- 36.83/100
- National rank
- #4558
- State rank
- #53 of 73 in FL
Livability — Bonifay
- Score
- 67/100
- State rank
- #577
- US rank
- #10976
Category grades
Schools grade is shown separately in the Schools card above.
Census & demographics
- Census place
- Bonifay, FL
- Population (ZIP)
- 13,944
Population outlook (Holmes County) Hauer SSP2
- Today (2025)
- 17,963 people
- By 2030
- 17,245 · -4.0%
- By 2040
- 15,970 · -11.1%
- By 2050
- 14,905 · -17.0%
- By 2075
- 12,327 · -31.4%
- By 2100
- 9,760 · -45.7%
Race, ethnicity, and origin ACS 2023
- Neighborhood character
- Predominantly White (81%)
- Race & ethnicity
- White 81% Black 9% Two or more races 6% Hispanic / Latino 4%
- Common ancestry
- Slovak 1% Iranian 1% Lithuanian 1%
- Foreign-born
- 2% · Canada
- Languages at home
- 94% English-only · Spanish 4% Russian/Polish/Slavic 1% French/Haitian/Cajun 1%
Political lean MEDSL · Holmes
- 2024 margin
- Solid R (+80.2) · D 9.7% · R 89.9%
- 2008→2024 swing
- -15.1pp toward R · 2008: -65.0pp · 2024: -80.2pp
- All cycles
- 2024: R+80.2 2020: R+78.9 2016: R+77.9 2012: R+68.3 2008: R+65.0
Not yet ingested
- Civics
- —
Market trends
- HPI YoY
- ▲ 44.87%
- Current HPI
- 322.29
- Rent YoY
- —
- Metro
- —
- State GDP YoY
- ▲ 3.28%
- F500 in state
- 36
Industry mix (Fortune 500 HQ in FL)
| Industry | F500 HQs | Revenue |
|---|---|---|
| Industrial Technology | 2 | $29B |
|
||
| Insurance | 2 | $17B |
|
||
| Retail | 1 | $60B |
|
||
| Technology Distribution | 1 | $58B |
|
||
| Homebuilding | 1 | $35B |
|
||
| Technology Manufacturing | 1 | $35B |
|
||
Price history
+120.0% since first listed3 events — show timeline
- 2026-06-10 Listed $55,000 CPARMLS
- 2010-07-02 Sold (Public Records) $25,000 Public Records
- 2002-04-02 Sold (Public Records) $25,000 Public Records
Cash-flow waterfall
monthlySold comps — $/sqft
last 12 mo · ≤1 miLoading sold comps…