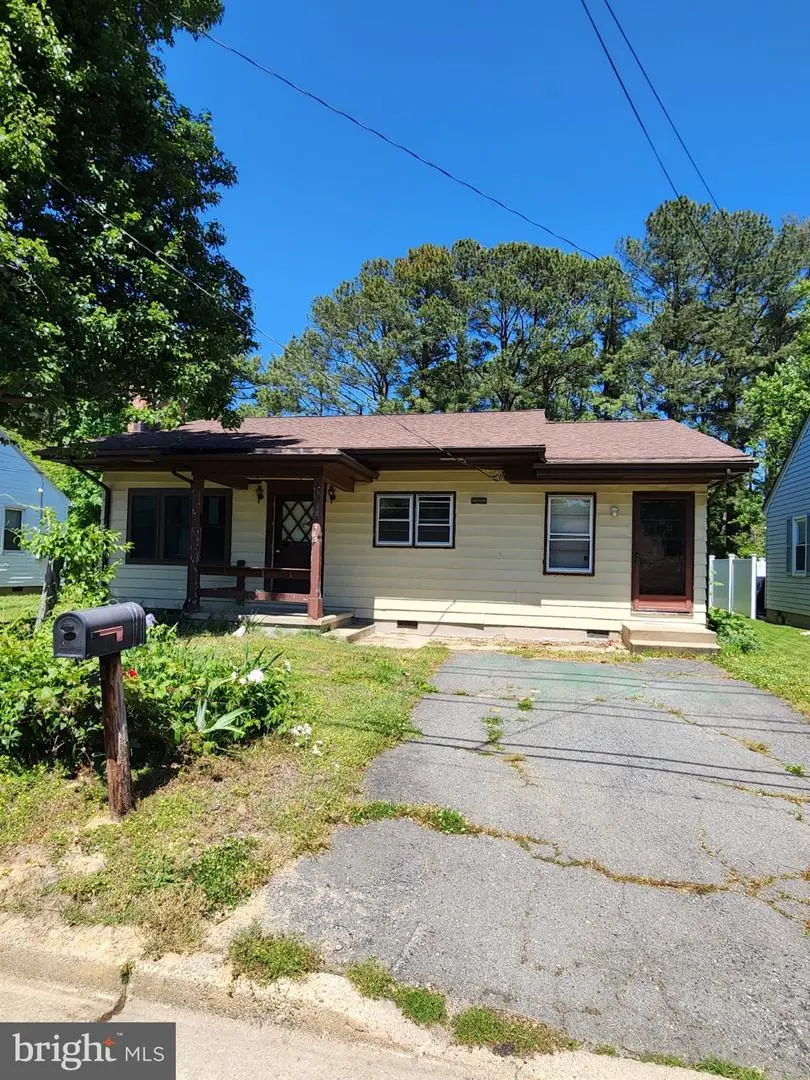
13 Sycamore Ave · Easton, MD
Flood risk 1/10 · Minimal
- FEMA flood zone
- X (unshaded)
- Chance of flooding over 30 yrs
- 0.0%
- Est. flood insurance / yr
- $507 – $1,088
Fire risk 2/10 · Minimal
- Est. fire insurance / yr
- $755 – $1,403
Heat risk 9/10 · Severe
- Hot days now (above 105°F)
- 7 days/yr
- Hot days in 30 yrs
- 16 days/yr
Wind risk 6/10 · Moderate
- Chance of severe wind over 30 yrs
- 65.0%
Air-quality risk 3/10 · Minor
- Unhealthy air days now
- 3 days/yr
- Unhealthy air days in 30 yrs
- 4 days/yr
Risk factors via First Street. Map © Google.
Why this score? — see what drove the B grade
The composite is a weighted blend of 9 inputs, each scored 0–100. Each bar is that input's sub-score; the figure is the points it added to the 100-point composite (weight × sub-score).
- Cash flow +29.7/30.0
- ARV discount +15.0/15.0
- DSCR +10.0/10.0
- 1% rule +7.1/10.0
- Livability +3.6/5.0
- Rent growth +2.5/5.0
- Condition / age +2.5/5.0
- Schools +2.3/10.0
- Appreciation +0.0/10.0
$229,900
🖨 Deal sheet (PDF) 📄 Offer letter ✓ Due diligence
Listing remarks
Discover this charming 3-bedroom, 1-bathroom ranch-style home, nestled in a vibrant community that offers a perfect blend of convenience and comfort. Built in 1951, this detached residence features a cozy fireplace, ideal for creating warm memories. With 1,440 sq. ft. of living space, the home provides ample room for relaxation and entertaining. The neighborhood boasts excellent public services, ensuring a well-maintained environment. Nearby parks invite outdoor activities, while local schools are known for their commitment to education. Enjoy the ease of on-street and driveway parking, making daily commutes a breeze. This property is situated close to essential amenities, including shoppin
Key facts
- Essential amenities
- On-street parking
- Nearby parks
Tags
Property features AI
Exterior
- Parking: Two driveway parking spaces; Two total garage and parking spaces; On-street parking available
- Utilities: Public water; Public sewer; Electric service
- Home design: Detached structure; Stick-built construction; Estimated year built
- Construction: Block foundation; Building winterized
- Exterior features: Above-grade and below-grade structures noted; Property condition listed as average; Ground rent paid annually; Located outside city limits
Interior
- Bedrooms: Three bedrooms on the main level
- Bathrooms: One full bathroom on the main level
- Heating & cooling: Electric baseboard heating; Electric hot water
- Interior features: Has a fireplace (1)
Neighborhood map
What this means for you Summary
Snapshot
- This is a 3-bed/1.0-bath single-family listed at $230k.
Deal economics
- At list price, monthly cash flow is $836 ($10k/yr) — positive.
- The deal already cash-flows at list — no discount required.
- Meets the 1% rule at list price ($3k rent vs $230k).
- Recommended offer: $223k (3.0% below list) — sets the bar for market timing.
- Cap rate 10.7% vs local median 3.8% in Easton — top-decile yield for the area; either an underpriced asset or a hidden risk that comps aren't pricing in. Stress-test before assuming the spread holds.
Location & tenants
- Location reads 71/100 on livability (#154 in MD) — a middle-class / working-renter tenant base. Strengths: health & safety A+, housing A-, employment B+; Watch: amenities C-, crime D, commute F.
- Talbot County Public Schools (town): math 15% / reading 35% proficiency, ranked #12 of 24 in MD (top 50%) — low school quality limits family demand, transient renter base, plan for 1-2y turnover.
- Zoned schools: Easton Elementary (math 10% / reading 19%, grade F, #477 of 860 statewide, top 59%, 1,078 students, 76% FRL); Easton Middle (math 9% / reading 32%, grade F, #141 of 225 statewide, top 65%, 737 students, 62% FRL); Easton High (math 40% / reading 65%, grade C-, #98 of 222 statewide, top 44%, 1,203 students, 56% FRL) — zoned schools average 65% FRL vs 37% district-wide (28 pts higher); higher-poverty schools than district average — tighter screening recommended.
- Market conditions: 207 active listings in the ZIP; 5 comparable units currently listed for rent nearby; rentals lingering (median 46d on market — plan ~5-8 weeks vacancy on turnover, expect pricing pressure); 80% of comp listings sitting > 30 days — soft ceiling on asking rent; solid renter incomes; 158 units permitted in Talbot County in 2024 (0 in 5+ unit buildings).
- This rent runs 40% of the median local income ($84k/yr) — at the standard rent-burdened threshold; future hikes will face affordability resistance.
Forward outlook
- Local home prices are declining (-3.0%/yr); year-one equity from $2k of loan paydown is wiped out by about $7k of value loss. Plan a longer hold.
- Talbot County population projected at -10% by 2050 — secular population decline; favor cash flow + early exit over multi-decade hold.
- At projected returns (-3.0% appreciation + 3.0% rent growth), your $64k cash investment doubles in ~8 years — after that, you're playing with house money.
Negotiation context
- It's been on market 36 days — a 3% lower offer ($223k) is reasonable based on typical stale-listing flexibility.
- Current owner paid $59k; list at $230k implies a 290% gain — meaningful room to come down on a strong offer.
Risks & watch-outs
- Watch-outs: built in 1951 — expect roof / HVAC / electrical / plumbing capex.
- Climate carrying-cost: major wind risk, 65% chance of damaging wind over 30y; extreme-heat days projected 7→16/yr by 2055 (HVAC capex compounding) — expect insurance premiums to compound above CPI over the hold.
Questions for the listing agent
- It's been on market 36 days. Have you received any prior offers? Is the seller open to a 3% concession, seller financing, or rate buy-down credit?
- Built in 1951 — when were the roof, HVAC, electrical panel, plumbing, and water heater last replaced?
- Is there a deadline driving the sale (1031 exchange, divorce, estate, relocation)? That informs how much negotiation room exists.
- Schools are D-rated, which usually means shorter tenancies and higher turnover. Who's the typical renter profile here, and what's been the actual vacancy rate?
- Crime grade is D in this area — have there been break-ins, vandalism, or insurance claims at this property in the last 3 years? What carrier currently insures it and at what premium?
- What's the average days-on-market for RENTAL listings here right now (not sales)? A rising rental-DOM trend means longer vacancies and softer asking-rent achievability than the comps imply.
- What's the recent tenant-quality profile in this submarket — average credit score on applications, eviction rate, late-payment / NSF rate, and stable-employment percentage? A property-management company in the area should have these aggregated.
- How much new for-sale + rental construction is in the pipeline within 1–3 miles? Heavy new supply typically softens prices + rents 12–24 months out; constrained supply supports both.
Investment metrics
- 1% rule
- 1.21% ✓
- Cap rate
- 10.66%
- Cash-on-cash
- 15.59%
- DSCR
- 1.69
- GRM
- 6.9
CMA / ARV
- ARV (median comp)
- $348,977
- List price
- $229,900
- Delta
- -34.12%
- Verdict
- UNDERPRICED
- Comps
- 20 within 1.0 mi
Show comp detail 12 sales within ~0.75 mi
| Address | Dist | Beds/Ba | Sqft | Sold | Price | $/sf | Match |
|---|---|---|---|---|---|---|---|
| 11 Sandy Ln | 0.22mi | 3/2.0 | 1,443 (+0%) | 8mo | $603,813 | $418 | 78 |
| 106 Sycamore Ave | 0.08mi | 3/2.0 | 1,259 (-13%) | 3mo | $325,000 | $258 | 69 |
| 328 N Washington St | 0.37mi | 3/2.5 | 1,396 (-3%) | 4mo | $410,000 | $294 | 69 |
| 15 Sandy Ln | 0.21mi | 3/2.0 | 1,516 (+5%) | 11mo | $599,900 | $396 | 69 |
| 311 Salmon Ave | 0.58mi | 3/2.0 | 1,408 (-2%) | 8mo | $420,000 | $298 | 58 |
| 14 Sandy Ln | 0.21mi | 3/2.5 | 1,238 (-14%) | 4mo | $459,000 | $371 | 58 |
| 407 Arbor Pl | 0.19mi | 4/2.0 (+1) | 1,592 (+11%) | 10mo | $367,000 | $231 | 56 |
| 601 Goldsborough St | 0.74mi | 3/1.5 | 1,472 (+2%) | 8mo | $132,500 | $90 | 53 |
| 604 Hazelwood Dr | 0.25mi | 3/2.0 | 1,232 (-14%) | 9mo | $329,900 | $268 | 52 |
| 7847 Ward Brothers Cir | 0.68mi | 2/2.0 (-1) | 1,385 (-4%) | 5mo | $399,990 | $289 | 49 |
| 319 Laurel St | 0.49mi | 3/2.0 | 1,600 (+11%) | 12mo | $387,500 | $242 | 45 |
| 703 Howard St | 0.63mi | 3/1.0 | 1,266 (-12%) | 8mo | $350,000 | $276 | 44 |
Match score weights: distance 35% · size 25% · config 20% · recency 20%. Top-matched comps best support the ARV.
Projected returns pro-forma
-3.0% appreciation · 3.0% rent growth · sell at horizon
- IRR
- 6.3%
- Equity multiple
- 1.25×
- Total profit
- $15,914
- Equity at exit
- $34,279
- IRR
- 15.7%
- Equity multiple
- 2.27×
- Total profit
- $82,038
- Equity at exit
- $19,878
Cash invested: $64,372 (down + closing). Projections, not guarantees.
Landlord ↔ Tenant lean methodology
- Overall (STATE)
- 27 Tenant-Leaning
- State Maryland
- 27 Tenant-Leaning · D+14
- County
- — inherits STATE
- City
- — inherits STATE
ZIP-level market 21601
- Home prices YoY
- -31.0%
- Active inventory
- 207
- Price-to-rent
- 6.9×
Monthly cashflow live
- Estimated rent
- $2,775 high interval (Pro) →
- Mortgage (P&I)
- −$1,206
- Tax from tax record
- −$54 /mo · $650/yr
- Insurance
- −$96
- HOA
- −$0
- Vacancy / Maint / Mgmt
- −$583
- Net cashflow
- $836
Break-even live
Sensitivity live
| Price | -10% $967 | -5% $901 | +0% $836 | +5% $771 | +10% $706 |
|---|---|---|---|---|---|
| Rent | -10% $617 | -5% $727 | +0% $836 | +5% $946 | +10% $1,056 |
| Rate | -1.0pp $952 | -0.5pp $895 | base $836 | +0.5pp $777 | +1.0pp $716 |
UW: 25.0% down · 7.5% · 30yr · 1.5% tax · 5.0% vac · 8.0% maint · 8.0% mgmt
Financing live
Cash to close
- Down payment
- $57,475
- Closing costs
- $6,897
- Reserves months
- —
- Total cash needed
- —
Loan-product check · same deal, 3 products live
Conventional
25% down · 7.5% · 30yr
- Down + closing
- —
- Monthly P&I
- —
- Monthly cashflow
- —
- DSCR
- —
- Eligible?
- —
Personal DTI + credit; lowest rate.
DSCR
20% down · 8.5% · 30yr
- Down + closing
- —
- Monthly P&I
- —
- Monthly cashflow
- —
- DSCR
- —
- Eligible?
- —
No personal income docs; deal must DSCR.
Hard money
10% down · 12.0% · 12mo
- Down + closing
- —
- Monthly P&I
- —
- Monthly cashflow
- —
- DSCR
- —
- Eligible?
- —
Short-term bridge; refi at stabilization.
Rent comps 5 comps
| Address | Beds | Baths | Sqft | Rent | $/sqft | DOM | Units | Dist |
|---|---|---|---|---|---|---|---|---|
| 14 Sandy Ln Easton, MD | 3.0 | 2.0 | 1238 | $2,900 | $2.34 | 45d | 1 | 0.23mi |
| 607 North St Easton, MD | 3.0 | 2.5 | 1650 | $3,100 | $1.88 | 45d | 1 | 0.68mi |
| 8337 Elliott Rd Easton, MD | 1.0–3.0 | 1.0–2.0 | 999 | $2,445 | $2.45 | 0d | 7 | 0.93mi |
| 126 Tred Avon Ave Unit NA Easton, MD | 4.0 | 2.0 | 1514 | $3,000 | $1.98 | 45d | 1 | 1.12mi |
| 201 Brookwood Ave Unit 2290 Easton, MD | 2.0 | 1.0 | 900 | $1,550 | $1.72 | 45d | 1 | 1.15mi |
Listing history 18 events
-
2026-06-19days on market $229,900 Active 36 DOM
-
2026-06-18days on market $229,900 Active 35 DOM
-
2026-06-17days on market $229,900 Active 34 DOM
-
2026-06-16days on market $229,900 Active 33 DOM
-
2026-06-15days on market $229,900 Active 32 DOM
-
2026-06-14days on market $229,900 Active 30 DOM
-
2026-06-12pricedays on market $229,900 Active 29 DOM
-
2026-06-09days on market $249,900 Active 26 DOM
-
2026-06-08days on market $249,900 Active 25 DOM
-
2026-06-07days on market $249,900 Active 24 DOM
-
2026-06-03days on market $249,900 Active 20 DOM
-
2026-06-02days on market $249,900 Active 19 DOM
-
2026-06-01days on market $249,900 Active 18 DOM
-
2026-05-31days on market $249,900 Active 17 DOM
-
2026-05-30days on market $249,900 Active 16 DOM
-
2026-05-14$249,900 Active 973-char remark
-
1986-07-30soldstatus $59,000
-
1985-06-28soldstatus $57,000
ⓘ Source: listings_history table (triggers on properties + properties_extension) + one-shot
backfill from property_details.listing_events for pre-trigger history.
Tax reassessment forecast MD · Partial reset (capped growth)
- Current annual tax
- $650 · $54/mo
- Projected year-2 tax
- $1,578 · $132/mo
- Expected delta
- +$928/yr (+$77/mo · 142.7%)
ⓘ Screening estimate from a state-policy table — verify with the county assessor before closing.
Climate risk First Street
- Flood 1/10 Low FEMA zone X (unshaded) · 0% chance over 30 yrs
- Wildfire 2/10 Low
- Heat 9/10 Extreme 7 d/yr ≥105°F today · 16 d/yr by 30 yrs out
- Wind 6/10 Major 65% chance of damaging wind over 30 yrs
- Air quality 3/10 Moderate 3 unhealthy d/yr today · 4 by 30 yrs out
Nearby sold comps map
Loading sold comps map…
Walkable amenities ~0.75 mi
Loading nearby amenities…
Taxation est. · year 1
- Rental income
- $33,296
- − Mortgage interest
- −$12,878
- − Property taxes
- −$650
- − Insurance
- −$1,150
- − Repairs & maintenance
- −$2,664
- − Management
- −$2,664
- − Depreciation
- −$6,688
- Taxable income
- $6,603
- Est. tax owed @ 24.0%
- −$1,585
- After-tax cash flow
- $8,452/yr
For passive investors: Depreciation is non-cash, so a rental often shows a tax loss while cash-flowing — sheltering income. Rental losses are passive: they offset passive income freely, and up to $25,000/yr can offset ordinary (W-2) income if you actively participate and your MAGI is under $100k (phasing out to $0 by $150k); unused losses carry forward. On sale, claimed depreciation is recaptured at up to 25%, and gains may owe capital-gains tax (a 1031 exchange can defer both). Figures are a year-1 estimate at your 24.0% rate — not tax advice; consult a CPA.
Schools (NCES district)
- District
- Talbot County Public Schools
- NCES district ID
- 2400630
- Math proficiency
- 15% ▼ -19.00%
- Reading proficiency
- 35% ▼ -10.00%
- Median HH income
- $61,786
- Composite
- 23.11/100
- National rank
- #7961
- State rank
- #12 of 24 in MD
Livability — Easton
- Score
- 71/100
- State rank
- #154
- US rank
- #6882
Category grades
Schools grade is shown separately in the Schools card above.
Census & demographics
- Census place
- Easton, MD
- County
- Talbot County · 24,671 people
- City population
- 24,671
- Metro
- Easton, MD
- Population (ZIP)
- 24,671
- Household income
- $83,680
- Rent vs Own
- Severe rent burden
- 771.0
Population outlook (Talbot County) Hauer SSP2
- Today (2025)
- 36,811 people
- By 2030
- 36,305 · -1.4%
- By 2040
- 34,818 · -5.4%
- By 2050
- 32,982 · -10.4%
- By 2075
- 29,631 · -19.5%
- By 2100
- 25,767 · -30.0%
Race, ethnicity, and origin ACS 2023
- Neighborhood character
- Predominantly White (71%)
- Race & ethnicity
- White 71% Black 14% Hispanic / Latino 10% Two or more races 6% Asian 1%
- Hispanic origin (detail)
- Mexican 2%
- Common ancestry
- Lithuanian 4% Romanian 3% Slovak 2%
- Foreign-born
- 9% · Canada, Guatemala
- Languages at home
- 89% English-only · Spanish 8% Other Indo-European 2%
Political lean MEDSL · Talbot
- 2024 margin
- Toss-up / Even · D 49.0% · R 49.1% · Other 1.9%
- 2008→2024 swing
- +9.6pp toward D · 2008: -9.6pp · 2024: -0.0pp
- All cycles
- 2024: R+0.0 2020: D+0.5 2016: R+11.9 2012: R+13.2 2008: R+9.6
Not yet ingested
- Civics
- —
Market trends
- HPI YoY
- ▼ -103.01%
- Current HPI
- 229.2902
- Rent YoY
- —
- Metro
- Easton, MD
- State GDP YoY
- ▲ 2.97%
- F500 in state
- 12
Industry mix (Fortune 500 HQ in MD)
| Industry | F500 HQs | Revenue |
|---|---|---|
| Aerospace / Defense | 1 | $71B |
|
||
| Utilities | 1 | $25B |
|
||
| Hotels | 1 | $24B |
|
||
| Consumer Goods | 1 | $7B |
|
||
| Real Estate | 1 | $6B |
|
||
| Chemicals | 1 | $2B |
|
||
Price history
+303.3% since first listed4 events — show timeline
- 2026-06-12 Price Changed $229,900 BRIGHT MLS
- 2026-05-14 Listed $249,900 BRIGHT MLS
- 1986-07-30 Sold (Public Records) $59,000 Public Records
- 1985-06-28 Sold (Public Records) $57,000 Public Records
Property tax history
-2.4%/yrLatest (2025): $650 · +4.2% YoY. Source: county tax records.
Cash-flow waterfall
monthlySold comps — $/sqft
last 12 mo · ≤1 miLoading sold comps…