136 Forest Rd · Milford city (balance), CT
Flood risk 1/10 · Minimal
- FEMA flood zone
- X (unshaded)
- Chance of flooding over 30 yrs
- 0.0%
- Est. flood insurance / yr
- $473 – $860
Fire risk 1/10 · Minimal
- Est. fire insurance / yr
- $829 – $1,539
Heat risk 6/10 · Moderate
- Hot days now (above 98°F)
- 7 days/yr
- Hot days in 30 yrs
- 16 days/yr
Wind risk 6/10 · Moderate
- Chance of severe wind over 30 yrs
- 51.0%
Air-quality risk 4/10 · Minor
- Unhealthy air days now
- 5 days/yr
- Unhealthy air days in 30 yrs
- 7 days/yr
Risk factors via First Street. Map © Google.
Why this score? — see what drove the D grade
The composite is a weighted blend of 9 inputs, each scored 0–100. Each bar is that input's sub-score; the figure is the points it added to the 100-point composite (weight × sub-score).
- ARV discount +15.0/15.0
- Cash flow +10.5/30.0
- Schools +4.6/10.0
- 1% rule +3.4/10.0
- DSCR +3.0/10.0
- Rent growth +2.5/5.0
- Livability +2.5/5.0
- Condition / age +2.5/5.0
- Appreciation +0.0/10.0
$339,000
🖨 Deal sheet (PDF) 📄 Offer letter ✓ Due diligence
Listing remarks
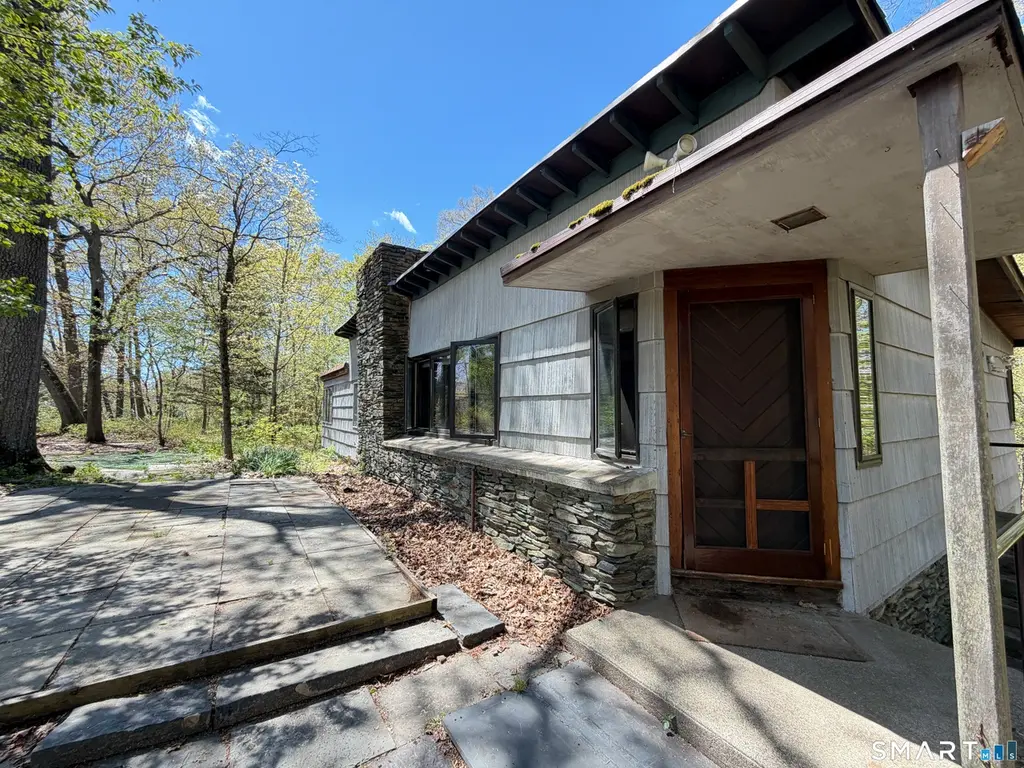
Opportunity knocks! This 3-bedroom, 1-bath Contemporary Ranch offers a rare chance to restore and reimagine a truly unique home. Set on a private, wooded lot, this home offers a functional layout with generous living space and strong design bones-perfect for buyers looking to renovate, invest, or create a one-of-a-kind residence. Outdoor space includes a patio area ideal for entertaining or relaxing in a serene setting. Being sold as-is, this is an exceptional opportunity to add value and bring a distinctive home back to life.
Key facts
- Patio area
- Private wooded lot
- Functional layout
Tags
Property features AI
Finance
- Financial info: Assessed value listed
Exterior
- Parking: Under-house garage (1 car)
- Utilities: Public water connected; Public sewer connected; Electric hot water
- Home design: Single-family home
- Construction: Frame construction; Concrete foundation; Asphalt shingle roof; Living area approximately 1,173 sq ft
- Exterior features: Level lot; Shingle exterior siding
Interior
- Kitchen: Oven/Range; Refrigerator
- Bedrooms: 3 bedrooms
- Bathrooms: 1 full bathroom
- Heating & cooling: Hot air heating; Oil-fired heat; oil tank located in garage
- Interior features: Full unfinished basement; Attic with pull-down stairs; One fireplace; Total of 6 rooms
- Laundry & utility: 30-gallon electric hot water tank
Neighborhood map
What this means for you Summary
Snapshot
- This is a 2-bed/1.0-bath single-family listed at $339k.
Deal economics
- At list price, monthly cash flow is $-174 ($-2k/yr) — negative.
- To cash-flow at today's rent, offer at most $308k (9.0% below list).
- To meet the 1% rule (rent ≥ 1% of price), the offer needs to be $284k (16.2% below list).
- Recommended offer: $284k (16.2% below list) — sets the bar for 1% rule.
- Cap rate 5.7% vs local median 3.6% in Milford city (balance) — top-decile yield for the area; either an underpriced asset or a hidden risk that comps aren't pricing in. Stress-test before assuming the spread holds.
Location & tenants
- Location reads: area grade D — affects rentability + tenant quality, not the cash-flow math above.
- Milford School District (urban): math 44% / reading 58% proficiency, ranked #73 of 153 in CT (top 48%) — acceptable for families but not a draw, mixed tenant base, ~2y average lease; only 15% free/reduced lunch — higher-income household profile.
- Zoned schools: Orange Avenue School (math 47% / reading 52%, grade D, #237 of 553 statewide, top 45%, 404 students, 23% FRL); Harborside Middle School (math 51% / reading 65%, grade B, #55 of 175 statewide, top 32%, 403 students, 23% FRL); Joseph A. Foran High School (math 47% / reading 67%, grade C, #52 of 194 statewide, top 31%, 765 students, 26% FRL).
- Market conditions: 55 active listings in the ZIP; 15 comparable units currently listed for rent nearby; rentals leasing fast (median 5d on market — plan ~1-2 weeks tenant-placement turnaround); high-income renter base; 1,059 units permitted in South Central Connecticut Planning Region in 2024 (779 in 5+ unit buildings).
Forward outlook
- Local home prices are declining (-3.0%/yr); year-one equity from $2k of loan paydown is wiped out by about $10k of value loss. Plan a longer hold.
Negotiation context
- It's been on market 29 days — a 2% lower offer ($334k) is reasonable based on typical stale-listing flexibility.
Risks & watch-outs
- Watch-outs: built in 1941 — expect roof / HVAC / electrical / plumbing capex.
- Climate carrying-cost: major wind risk, 51% chance of damaging wind over 30y; extreme-heat days projected 7→16/yr by 2055 (HVAC capex compounding) — expect insurance premiums to compound above CPI over the hold.
Questions for the listing agent
- What do current leases actually rent for vs. the listed asking? Can we see a recent rent roll and the last 12 months of T-12 income?
- Built in 1941 — when were the roof, HVAC, electrical panel, plumbing, and water heater last replaced?
- Is there a deadline driving the sale (1031 exchange, divorce, estate, relocation)? That informs how much negotiation room exists.
- The area grade is low — what's the realistic commute time and amenity access for the typical tenant pool here? Any planned neighborhood developments (good or bad) we should know about?
- What's the average days-on-market for RENTAL listings here right now (not sales)? A rising rental-DOM trend means longer vacancies and softer asking-rent achievability than the comps imply.
- What's the recent tenant-quality profile in this submarket — average credit score on applications, eviction rate, late-payment / NSF rate, and stable-employment percentage? A property-management company in the area should have these aggregated.
- How much new for-sale + rental construction is in the pipeline within 1–3 miles? Heavy new supply typically softens prices + rents 12–24 months out; constrained supply supports both.
Investment metrics
- 1% rule
- 0.84% ✗
- Cap rate
- 5.68%
- Cash-on-cash
- -2.19%
- DSCR
- 0.90
- GRM
- 9.9
CMA / ARV
- ARV (median comp)
- $471,088
- List price
- $339,000
- Delta
- -28.04%
- Verdict
- UNDERPRICED
- Comps
- 20 within 1.0 mi
Show comp detail 7 sales within ~0.75 mi
| Address | Dist | Beds/Ba | Sqft | Sold | Price | $/sf | Match |
|---|---|---|---|---|---|---|---|
| 136 Forest Rd | 0.00mi | 3/1.0 (+1) | 1,173 (0%) | 0mo | $400,000 | $341 | 95 |
| 86 Cinnamon Rd #86 | 0.22mi | 2/1.0 | 1,176 (+0%) | 16mo | $235,700 | $200 | 76 |
| 6 Vernon Ct | 0.38mi | 3/2.5 (+1) | 1,092 (-7%) | 2mo | $525,000 | $481 | 58 |
| 42 Corona Dr | 0.48mi | 3/2.0 (+1) | 1,190 (+1%) | 11mo | $451,500 | $379 | 57 |
| 181 North St | 0.56mi | 2/1.0 | 1,020 (-13%) | 9mo | $337,000 | $330 | 44 |
| 31 Ross St | 0.45mi | 3/1.0 (+1) | 1,008 (-14%) | 8mo | $301,000 | $299 | 44 |
| 125 Orange Ave | 0.33mi | 3/1.0 (+1) | 1,017 (-13%) | 17mo | $360,000 | $354 | 43 |
Match score weights: distance 35% · size 25% · config 20% · recency 20%. Top-matched comps best support the ARV.
Projected returns pro-forma
-3.0% appreciation · 3.0% rent growth · sell at horizon
- IRR
- -19.9%
- Equity multiple
- 0.31×
- Total profit
- $-65,900
- Equity at exit
- $50,546
- IRR
- -12.8%
- Equity multiple
- 0.25×
- Total profit
- $-71,257
- Equity at exit
- $29,311
Cash invested: $94,920 (down + closing). Projections, not guarantees.
Landlord ↔ Tenant lean methodology
- Overall (STATE)
- 27 Tenant-Leaning
- State Connecticut
- 27 Tenant-Leaning · D+7
- County
- — inherits STATE
- City
- — inherits STATE
ZIP-level market 06461
- Active inventory
- 55
- Price-to-rent
- 9.9×
Monthly cashflow live
- Estimated rent
- $2,842 high interval (Pro) →
- Mortgage (P&I)
- −$1,778
- Tax from tax record
- −$500 /mo · $6,001/yr
- Insurance
- −$141
- HOA
- −$0
- Vacancy / Maint / Mgmt
- −$597
- Net cashflow
- $-174
Break-even live
Sensitivity live
| Price | -10% $18 | -5% $-78 | +0% $-174 | +5% $-270 | +10% $-366 |
|---|---|---|---|---|---|
| Rent | -10% $-398 | -5% $-286 | +0% $-174 | +5% $-61 | +10% $51 |
| Rate | -1.0pp $-3 | -0.5pp $-87 | base $-174 | +0.5pp $-261 | +1.0pp $-351 |
UW: 25.0% down · 7.5% · 30yr · 1.5% tax · 5.0% vac · 8.0% maint · 8.0% mgmt
Financing live
Cash to close
- Down payment
- $84,750
- Closing costs
- $10,170
- Reserves months
- —
- Total cash needed
- —
Loan-product check · same deal, 3 products live
Conventional
25% down · 7.5% · 30yr
- Down + closing
- —
- Monthly P&I
- —
- Monthly cashflow
- —
- DSCR
- —
- Eligible?
- —
Personal DTI + credit; lowest rate.
DSCR
20% down · 8.5% · 30yr
- Down + closing
- —
- Monthly P&I
- —
- Monthly cashflow
- —
- DSCR
- —
- Eligible?
- —
No personal income docs; deal must DSCR.
Hard money
10% down · 12.0% · 12mo
- Down + closing
- —
- Monthly P&I
- —
- Monthly cashflow
- —
- DSCR
- —
- Eligible?
- —
Short-term bridge; refi at stabilization.
Rent comps 15 comps
| Address | Beds | Baths | Sqft | Rent | $/sqft | DOM | Units | Dist |
|---|---|---|---|---|---|---|---|---|
| 119 Sunnyside Ct Milford, CT | 3.0 | 1.5 | 1350 | $3,400 | $2.52 | 21d | 1 | 0.55mi |
| 158 Cherry St Milford, CT | 1.0 | 1.0 | 703 | $2,535 | $3.61 | 4d | 1 | 0.56mi |
| 99 Cherry St Unit 1 Milford, CT | 1.0 | 1.5 | 850 | $2,250 | $2.65 | 4d | 1 | 0.70mi |
| 73 Paschal Dr Milford, CT | 3.0 | 1.5 | 1269 | $3,200 | $2.52 | 25d | 1 | 0.75mi |
| 680 Boston Post Rd Apt 25 Milford, CT | 2.0 | 1.0 | 1050 | $2,650 | $2.52 | 4d | 1 | 0.81mi |
| 184 Buckingham Ave Milford, CT | 2.0 | 1.0 | 1265 | $2,050 | $1.62 | 45d | 1 | 0.83mi |
| 47 Prospect St Milford, CT | 2.0 | 1.0–2.0 | 1105 | $3,170 | $2.87 | 4d | 4 | 0.92mi |
| 97 River St Milford, CT | 2.0 | 1.0 | 1248 | $2,900 | $2.32 | 4d | 1 | 0.97mi |
| 15 River St Unit 3C Milford, CT | 1.0 | 1.0 | 750 | $2,600 | $3.47 | 4d | 1 | 1.07mi |
| 121 W Main St Milford, CT | 1.0 | 1.0 | 786 | $2,662 | $3.39 | 4d | 1 | 1.09mi |
| 44 River St Milford, CT | 2.0 | 1.0–2.0 | 789 | $3,758 | $4.76 | 25d | 1 | 1.14mi |
| 70 Tumblebrook Rd Milford, CT | 2.0 | 1.0 | 1056 | $3,500 | $3.31 | 45d | 1 | 1.26mi |
| 33 Railroad Ave Milford, CT | 1.0–2.0 | 1.0–2.0 | 838 | $2,962 | $3.53 | 4d | 3 | 1.31mi |
| 10 Central Ave Milford, CT | 2.0 | 1.0 | 924 | $1,995 | $2.16 | 13d | 1 | 1.35mi |
| 251 W Main St Milford, CT | 2.0 | 2.0 | 1094 | $2,800 | $2.56 | 4d | 1 | 1.39mi |
Listing history 5 events
-
2026-06-02status $339,000 Under Contract 29 DOM
-
2026-06-01days on market $339,000 Under Contract - Continue to Show 29 DOM
-
2026-05-31days on market $339,000 Under Contract - Continue to Show 28 DOM
-
2026-05-09historical Under Contract - Continue to Show 532-char remark
-
2026-05-03$339,000 Active 532-char remark
ⓘ Source: listings_history table (triggers on properties + properties_extension) + one-shot
backfill from property_details.listing_events for pre-trigger history.
Tax reassessment forecast CT · Partial reset (capped growth)
- Current annual tax
- $6,001 · $500/mo
- Projected year-2 tax
- $6,628 · $552/mo
- Expected delta
- +$627/yr (+$52/mo · 10.4%)
ⓘ Screening estimate from a state-policy table — verify with the county assessor before closing.
Climate risk First Street
- Flood 1/10 Low FEMA zone X (unshaded) · 0% chance over 30 yrs
- Wildfire 1/10 Low
- Heat 6/10 Major 7 d/yr ≥98°F today · 16 d/yr by 30 yrs out
- Wind 6/10 Major 51% chance of damaging wind over 30 yrs
- Air quality 4/10 Moderate 5 unhealthy d/yr today · 7 by 30 yrs out
Nearby sold comps map
Loading sold comps map…
Walkable amenities ~0.75 mi
Loading nearby amenities…
Taxation est. · year 1
- Rental income
- $34,109
- − Mortgage interest
- −$18,989
- − Property taxes
- −$6,001
- − Insurance
- −$1,695
- − Repairs & maintenance
- −$2,729
- − Management
- −$2,729
- − Depreciation
- −$9,862
- Taxable loss
- −$7,896
- Est. tax savings @ 24.0%
- +$1,895
- After-tax cash flow
- $-188/yr
For passive investors: Depreciation is non-cash, so a rental often shows a tax loss while cash-flowing — sheltering income. Rental losses are passive: they offset passive income freely, and up to $25,000/yr can offset ordinary (W-2) income if you actively participate and your MAGI is under $100k (phasing out to $0 by $150k); unused losses carry forward. On sale, claimed depreciation is recaptured at up to 25%, and gains may owe capital-gains tax (a 1031 exchange can defer both). Figures are a year-1 estimate at your 24.0% rate — not tax advice; consult a CPA.
Schools (NCES district)
- District
- Milford School District
- NCES district ID
- 0902520
- Math proficiency
- 44% ▼ -14.00%
- Reading proficiency
- 58% ▼ -11.00%
- Median HH income
- $80,198
- Composite
- 46.45/100
- National rank
- #2444
- State rank
- #73 of 153 in CT
Livability — Milford city (balance)
No livability data for this city. (Only ~50 U.S. cities are tracked.)
Census & demographics
- Census place
- Milford city (balance), CT
- County
- New Haven County · 688,236 people
- City population
- 52,340
- Metro
- New Haven-Milford, CT
- Population (ZIP)
- 15,035
- Household income
- $133,221
- Rent vs Own
- Severe rent burden
- 134.0
Population outlook (South Central Connecticut County) Hauer SSP2
- By 2040
- 608,362
Race, ethnicity, and origin ACS 2023
- Neighborhood character
- Predominantly White (76%)
- Race & ethnicity
- White 76% Hispanic / Latino 11% Two or more races 8% Asian 8% Black 1%
- Hispanic origin (detail)
- Mexican 2% Puerto Rican 5%
- Common ancestry
- Romanian 10% Scotch-Irish 2% Lithuanian 2%
- Foreign-born
- 12% · Canada, China, Vietnam
- Languages at home
- 84% English-only · Other Indo-European 5% Spanish 5% Russian/Polish/Slavic 2%
Political lean MEDSL · South Central Connecticut
- 2024 margin
- Strong D (+20.1) · D 59.0% · R 38.9% · Other 2.1%
- All cycles
- 2024: D+20.1
Not yet ingested
- Civics
- —
Market trends
- HPI YoY
- ▼ -207.85%
- Current HPI
- 248.904
- Rent YoY
- —
- Metro
- New Haven-Milford, CT
- State GDP YoY
- ▲ 1.06%
- F500 in state
- 38
Industry mix (Fortune 500 HQ in CT)
| Industry | F500 HQs | Revenue |
|---|---|---|
| Industrial Machinery | 4 | $38B |
|
||
| Insurance | 3 | $71B |
|
||
| Financial Services | 2 | $25B |
|
||
| Transportation / Logistics | 2 | $18B |
|
||
| Healthcare | 1 | $247B |
|
||
| Telecommunications | 1 | $55B |
|
||
Price history
+18.0% since first listed4 events — show timeline
- 2026-06-12 Sold (MLS) $400,000 Smart MLS
- 2026-06-01 Pending — Smart MLS
- 2026-05-09 Contingent — Smart MLS
- 2026-05-03 Listed $339,000 Smart MLS
Property tax history
+2.4%/yrLatest (2023): $6,001 · +2.0% YoY. Source: county tax records.
Cash-flow waterfall
monthlySold comps — $/sqft
last 12 mo · ≤1 miLoading sold comps…