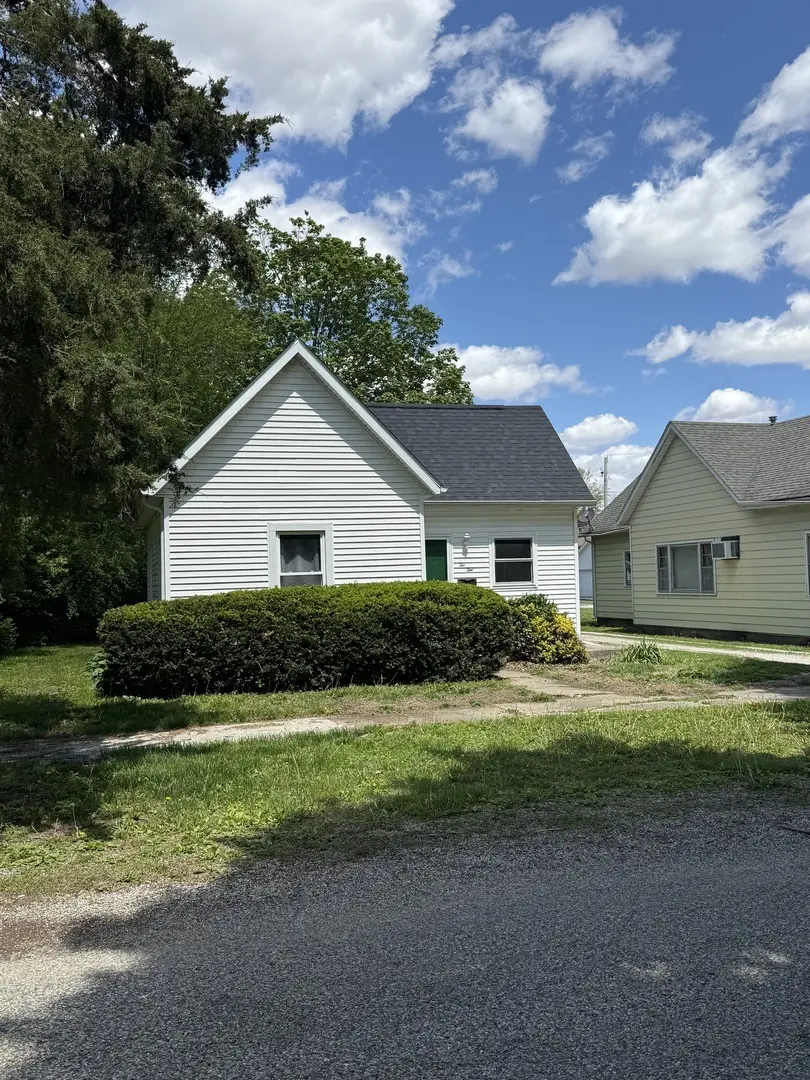
210 W Jefferson St · Villa Grove, IL
Flood risk 1/10 · Minimal
- FEMA flood zone
- X (shaded)
- Chance of flooding over 30 yrs
- 0.0%
- Est. flood insurance / yr
- $507 – $1,088
Fire risk 1/10 · Minimal
- Est. fire insurance / yr
- $804 – $1,492
Heat risk 3/10 · Minor
- Hot days now (above 105°F)
- 7 days/yr
- Hot days in 30 yrs
- 19 days/yr
Wind risk 2/10 · Minimal
- Chance of severe wind over 30 yrs
- 1.0%
Air-quality risk 2/10 · Minimal
- Unhealthy air days now
- 1 days/yr
- Unhealthy air days in 30 yrs
- 1 days/yr
Risk factors via First Street. Map © Google.
Why this score? — see what drove the C grade
The composite is a weighted blend of 9 inputs, each scored 0–100. Each bar is that input's sub-score; the figure is the points it added to the 100-point composite (weight × sub-score).
- Cash flow +23.6/30.0
- DSCR +7.6/10.0
- 1% rule +7.5/10.0
- ARV discount +7.0/15.0
- Livability +3.2/5.0
- Rent growth +2.5/5.0
- Condition / age +2.5/5.0
- Schools +1.6/10.0
- Appreciation +0.0/10.0
$69,900
🖨 Deal sheet 📄 Offer letter ✓ Due diligence
Listing remarks
Welcome home to 210 W. Jefferson! Whether you are looking for a starter home or an investment opportunity, this 2 bedroom home is the one for you! The kitchen and bathroom have been remodeled and thoughtfully designed. Many updates include roof '21, some appliances, some replacement windows. You will appreciate the large detached garage for additional storage space and deep lot with mature trees. Call today to schedule your appointment!
Key facts
- 7,668 sq ft lot
- 2 garage spots
- Built 1910
Neighborhood map
What this means for you Summary
Snapshot
- This is a 2-bed/1.0-bath single-family listed at $70k.
Deal economics
- At list price, monthly cash flow is $132 ($2k/yr) — positive.
- The deal already cash-flows at list — no discount required.
- Meets the 1% rule at list price ($876 rent vs $70k).
Location & tenants
- Location reads 64/100 on livability (#713 in IL) — a middle-class / working-renter tenant base. Strengths: cost of living A+, crime A, housing A; Watch: employment D, amenities F, commute F.
- Villa Grove CUSD 302 (rural): math 15% / reading 19% proficiency, ranked #464 of 620 in IL (top 75%) — low school quality limits family demand, transient renter base, plan for 1-2y turnover.
- Zoned schools: Villa Grove Elem School (math 17% / reading 22%, grade F, #1,054 of 2,056 statewide, top 54%, 342 students, 0% FRL); Villa Grove High School (math 15% / reading 15%, grade F, #462 of 693 statewide, top 68%, 201 students, 0% FRL) — zoned schools average 0% FRL vs 35% district-wide (35 pts lower); this property's tenant base skews higher-income than the district average.
- Market conditions: 10 active listings in the ZIP; 36 units permitted in Douglas County in 2024 (0 in 5+ unit buildings).
Forward outlook
- Local home prices are declining (-3.0%/yr); year-one equity from $483 of loan paydown is wiped out by about $2k of value loss. Plan a longer hold.
- Douglas County population projected to shrink 7% by 2050 — rents likely to lag national; underwrite the cash flow, not the appreciation.
Negotiation context
- Only 1 days on market — expect competitive offers; lowballing is unlikely to land.
- Current owner paid $48k; 47% above their basis — modest negotiation headroom, anchor on the comps not their cost.
Risks & watch-outs
- Watch-outs: property tax is 2.8% of price; built in 1910 — expect roof / HVAC / electrical / plumbing capex.
Questions for the listing agent
- Built in 1910 — when were the roof, HVAC, electrical panel, plumbing, and water heater last replaced?
- Property tax is high relative to price — has the assessment been appealed recently, and will the sale trigger a re-assessment?
- Is there a deadline driving the sale (1031 exchange, divorce, estate, relocation)? That informs how much negotiation room exists.
- Schools are D-rated, which usually means shorter tenancies and higher turnover. Who's the typical renter profile here, and what's been the actual vacancy rate?
- What's the average days-on-market for RENTAL listings here right now (not sales)? A rising rental-DOM trend means longer vacancies and softer asking-rent achievability than the comps imply.
- What's the recent tenant-quality profile in this submarket — average credit score on applications, eviction rate, late-payment / NSF rate, and stable-employment percentage? A property-management company in the area should have these aggregated.
- How much new for-sale + rental construction is in the pipeline within 1–3 miles? Heavy new supply typically softens prices + rents 12–24 months out; constrained supply supports both.
Investment metrics
- 1% rule
- 1.25% ✓
- Cap rate
- 8.56%
- Cash-on-cash
- 8.10%
- DSCR
- 1.36
- GRM
- 6.6
CMA / ARV
- ARV (on-the-fly)
- $69,204
- Comps found
- 12
Show comp detail 12 sales within ~0.75 mi
| Address | Dist | Beds/Ba | Sqft | Sold | Price | $/sf | Match |
|---|---|---|---|---|---|---|---|
| 408 W Harrison St | 0.14mi | 2/1.5 | 959 (+1%) | 9mo | $149,000 | $155 | 82 |
| 203 N Pine St | 0.06mi | 2/1.0 | 960 (+1%) | 17mo | $62,000 | $65 | 81 |
| 303 S Spruce St | 0.43mi | 3/1.0 (+1) | 945 (-0%) | 2mo | $36,050 | $38 | 73 |
| 503 W Wilson Ave | 0.24mi | 3/1.0 (+1) | 1,008 (+6%) | 2mo | $73,500 | $73 | 71 |
| 210 N Walnut St | 0.05mi | 2/1.0 | 1,016 (+7%) | 21mo | $69,000 | $68 | 68 |
| 207 N Pine St | 0.07mi | 2/1.0 | 836 (-12%) | 11mo | $100,000 | $120 | 68 |
| 512 N Richman St | 0.28mi | 3/1.0 (+1) | 1,000 (+6%) | 8mo | $106,500 | $107 | 66 |
| 605 S Sycamore St | 0.55mi | 2/1.0 | 1,013 (+7%) | 3mo | $85,000 | $84 | 61 |
| 306 East Harrison St | 0.46mi | 2/1.0 | 1,044 (+10%) | 2mo | $13,800 | $13 | 60 |
| 307 E Wilson St | 0.50mi | 3/1.0 (+1) | 953 (+0%) | 20mo | $60,000 | $63 | 54 |
| 703 S Spruce St | 0.63mi | 3/1.0 (+1) | 1,018 (+7%) | 7mo | $75,000 | $74 | 47 |
| 405 E Wilson St | 0.55mi | 2/1.0 | 889 (-6%) | 22mo | $65,000 | $73 | 46 |
Match score weights: distance 35% · size 25% · config 20% · recency 20%. Top-matched comps best support the ARV.
Projected returns pro-forma
-3.0% appreciation · 3.0% rent growth · sell at horizon
- IRR
- -3.9%
- Equity multiple
- 0.85×
- Total profit
- $-2,854
- Equity at exit
- $10,422
- IRR
- 5.9%
- Equity multiple
- 1.44×
- Total profit
- $8,592
- Equity at exit
- $6,044
Cash invested: $19,572 (down + closing). Projections, not guarantees.
Landlord ↔ Tenant lean methodology
- Overall (STATE)
- 43 Moderately Tenant-Leaning
- State Illinois
- 43 Moderately Tenant-Leaning · D+7
- County
- — inherits STATE
- City
- — inherits STATE
ZIP-level market 61956
- Home prices YoY
- -9.3%
- Active inventory
- 10
- Price-to-rent
- 6.6×
Monthly cashflow live
- Estimated rent
- $876 medium interval (Pro) →
- Mortgage (P&I)
- −$367
- Tax from tax record
- −$164 /mo · $1,971/yr
- Insurance
- −$29
- HOA
- −$0
- Vacancy / Maint / Mgmt
- −$184
- Net cashflow
- $132
Break-even live
UW: 25.0% down · 7.5% · 30yr · 1.5% tax · 5.0% vac · 8.0% maint · 8.0% mgmt
Financing live
Cash to close
- Down payment
- $17,475
- Closing costs
- $2,097
- Reserves months
- —
- Total cash needed
- —
Loan-product check · same deal, 3 products live
Conventional
25% down · 7.5% · 30yr
- Down + closing
- —
- Monthly P&I
- —
- Monthly cashflow
- —
- DSCR
- —
- Eligible?
- —
Personal DTI + credit; lowest rate.
DSCR
20% down · 8.5% · 30yr
- Down + closing
- —
- Monthly P&I
- —
- Monthly cashflow
- —
- DSCR
- —
- Eligible?
- —
No personal income docs; deal must DSCR.
Hard money
10% down · 12.0% · 12mo
- Down + closing
- —
- Monthly P&I
- —
- Monthly cashflow
- —
- DSCR
- —
- Eligible?
- —
Short-term bridge; refi at stabilization.
Listing history 5 events
-
2026-05-14status Pending
-
2014-12-12historical
-
2012-11-30historical
-
2003-05-29soldstatus $47,500
-
1991-11-01soldstatus $28,500
ⓘ Source: listings_history table (triggers on properties + properties_extension) + one-shot
backfill from property_details.listing_events for pre-trigger history.
Tax reassessment forecast IL · Partial reset (capped growth)
- Current annual tax
- $1,971 · $164/mo
- Projected year-2 tax
- $1,971 · $164/mo
- Expected delta
- $0/yr ($0/mo · 0.0%)
ⓘ Screening estimate from a state-policy table — verify with the county assessor before closing.
Climate risk First Street
- Flood 1/10 Low FEMA zone X (shaded) · 0% chance over 30 yrs
- Wildfire 1/10 Low
- Heat 3/10 Moderate 7 d/yr ≥105°F today · 19 d/yr by 30 yrs out
- Wind 2/10 Low 100% chance of damaging wind over 30 yrs
- Air quality 2/10 Low 1 unhealthy d/yr today · 1 by 30 yrs out
Nearby sold comps map
Loading sold comps map…
Walkable amenities ~0.75 mi
Loading nearby amenities…
Taxation est. · year 1
- Rental income
- $10,512
- − Mortgage interest
- −$3,915
- − Property taxes
- −$1,971
- − Insurance
- −$350
- − Repairs & maintenance
- −$841
- − Management
- −$841
- − Depreciation
- −$2,033
- Taxable income
- $560
- Est. tax owed @ 24.0%
- −$134
- After-tax cash flow
- $1,450/yr
For passive investors: Depreciation is non-cash, so a rental often shows a tax loss while cash-flowing — sheltering income. Rental losses are passive: they offset passive income freely, and up to $25,000/yr can offset ordinary (W-2) income if you actively participate and your MAGI is under $100k (phasing out to $0 by $150k); unused losses carry forward. On sale, claimed depreciation is recaptured at up to 25%, and gains may owe capital-gains tax (a 1031 exchange can defer both). Figures are a year-1 estimate at your 24.0% rate — not tax advice; consult a CPA.
Schools (NCES district)
- District
- Villa Grove CUSD 302
- NCES district ID
- 1740320
- Math proficiency
- 15% ▼ -6.00%
- Reading proficiency
- 19% ▼ -12.00%
- Median HH income
- $52,614
- Composite
- 15.67/100
- National rank
- #9286
- State rank
- #464 of 620 in IL
Livability — Villa Grove
- Score
- 64/100
- State rank
- #713
- US rank
- #14496
Category grades
Schools grade is shown separately in the Schools card above.
Census & demographics
- Census place
- Villa Grove, IL
- Population (ZIP)
- 3,046
Population outlook (Douglas County) Hauer SSP2
- Today (2025)
- 19,209 people
- By 2030
- 18,940 · -1.4%
- By 2040
- 18,397 · -4.2%
- By 2050
- 17,829 · -7.2%
- By 2075
- 16,395 · -14.6%
- By 2100
- 14,329 · -25.4%
Race, ethnicity, and origin ACS 2023
- Neighborhood character
- Predominantly White (97%)
- Race & ethnicity
- White 97% Asian 1% Hispanic / Latino 1% Two or more races 1%
- Common ancestry
- Italian 2% Iranian 2% Slovak 2%
- Foreign-born
- 2% · Canada
- Languages at home
- 96% English-only · Russian/Polish/Slavic 1% Spanish 1% French/Haitian/Cajun 1%
Political lean MEDSL · Douglas
- 2024 margin
- Solid R (+46.1) · D 26.1% · R 72.3% · Other 1.6%
- 2008→2024 swing
- -24.9pp toward R · 2008: -21.3pp · 2024: -46.1pp
- All cycles
- 2024: R+46.1 2020: R+44.4 2016: R+46.3 2012: R+36.8 2008: R+21.3
Not yet ingested
- Civics
- —
Market trends
- HPI YoY
- ▼ -21.97%
- Current HPI
- 213.6799
- Rent YoY
- —
- Metro
- —
- State GDP YoY
- ▲ 1.59%
- F500 in state
- 60
Industry mix (Fortune 500 HQ in IL)
| Industry | F500 HQs | Revenue |
|---|---|---|
| Insurance | 4 | $201B |
|
||
| Consumer Goods | 4 | $87B |
|
||
| Industrial Machinery | 3 | $64B |
|
||
| Healthcare | 2 | $55B |
|
||
| Retail / Pharmacy | 1 | $148B |
|
||
| Agriculture / Food | 1 | $86B |
|
||
Price history
+66.7% since first listed5 events — show timeline
- 2026-05-14 Pending — MRED as Distributed by MLS Grid
- 2014-12-12 Listing Removed — MRED as Distributed by MLS Grid
- 2012-11-30 Listing Removed — MRED as Distributed by MLS Grid
- 2003-05-29 Sold (Public Records) $47,500 Public Records
- 1991-11-01 Sold (Public Records) $28,500 Public Records
Property tax history
+3.5%/yrLatest (2024): $1,971 · +6.5% YoY. Source: county tax records.
Cash-flow waterfall
monthlySold comps — $/sqft
last 12 mo · ≤1 miLoading sold comps…