5141 Draco Cir #102 · Orangetree, FL
Flood risk 1/10 · Minimal
- FEMA flood zone
- AH
- Chance of flooding over 30 yrs
- 0.0%
- Est. flood insurance / yr
- $1,142 – $2,507
Fire risk 6/10 · Moderate
- Est. fire insurance / yr
- $947 – $1,759
Heat risk 9/10 · Severe
- Hot days now (above 111°F)
- 7 days/yr
- Hot days in 30 yrs
- 26 days/yr
Wind risk 10/10 · Severe
- Chance of severe wind over 30 yrs
- 99.0%
Air-quality risk 2/10 · Minimal
- Unhealthy air days now
- 0 days/yr
- Unhealthy air days in 30 yrs
- 1 days/yr
Risk factors via First Street. Map © Google.
Why this score? — see what drove the C- grade
The composite is a weighted blend of 9 inputs, each scored 0–100. Each bar is that input's sub-score; the figure is the points it added to the 100-point composite (weight × sub-score).
- Cash flow +17.9/30.0
- ARV discount +7.5/15.0
- DSCR +5.6/10.0
- Schools +5.0/10.0
- 1% rule +4.8/10.0
- Condition / age +4.8/5.0
- Livability +3.2/5.0
- Rent growth +2.1/5.0
- Appreciation +0.0/10.0
$346,780
🖨 Deal sheet 📄 Offer letter ✓ Due diligence
Listing remarks
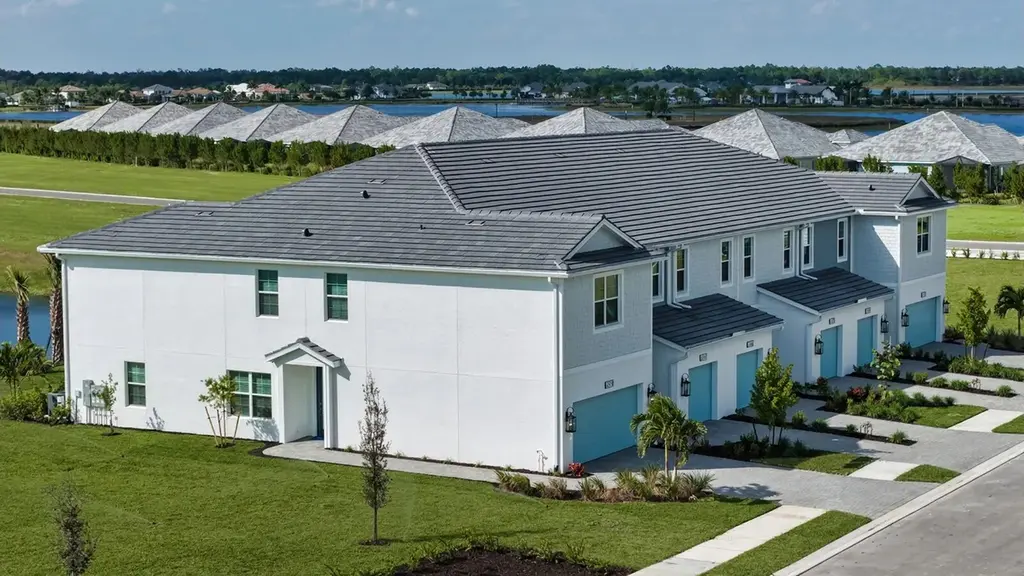
Come home to the Avery, a new townhome design by award-winning Neal Communities. This 2-story home includes 3 bedrooms, 2.5 baths and an attached garage. As soon as you enter the front door, you are greeted by the large living room with a well-appointed kitchen and dining space leading out to the covered lanai. A powder room, storage closet on the lanai, and access to the garage are also on the first floor.
Key facts
- New townhome design
- Storage closet
- Large living room
Tags
Property features AI
Finance
- Financial info: List price $346,780
Exterior
- Parking: 2 total parking spaces (includes 2 garage spaces)
- Home design: Condo/Townhome unit at 5141 Draco Cir #102, Naples, FL; Single-level unit
- Exterior features: Living area approximately 1790
Interior
- Bedrooms: 3 bedrooms
- Bathrooms: 2 bathrooms (full)
- Interior features: Spec home (Avery plan)
Neighborhood map
What this means for you Summary
Snapshot
- This is a 3-bed/2.0-bath townhouse listed at $347k. Condition is rated excellent.
Deal economics
- At list price, monthly cash flow is $142 ($2k/yr) — positive.
- The deal already cash-flows at list — no discount required.
- To meet the 1% rule (rent ≥ 1% of price), the offer needs to be $341k (1.8% below list).
- Recommended offer: $341k (1.8% below list) — sets the bar for 1% rule.
Location & tenants
- Location reads 65/100 on livability (#636 in FL) — a middle-class / working-renter tenant base. Strengths: crime A+, employment A+, housing A+; Watch: health & safety D, schools D-, amenities F.
- Collier (suburban): math 60% / reading 56% proficiency, ranked #16 of 73 in FL (top 22%) — acceptable for families but not a draw, mixed tenant base, ~2y average lease.
- Market conditions: Rents soft (-1.6%/yr); 1124 active listings in the ZIP; 5 comparable units currently listed for rent nearby; rentals at typical pace (median 21d on market — plan ~3-4 weeks tenant-placement turnaround); solid renter incomes; 3,520 units permitted in Collier County in 2024 (959 in 5+ unit buildings).
- This rent runs 44% of the median local income ($94k/yr) — at the standard rent-burdened threshold; future hikes will face affordability resistance.
Forward outlook
- Local home prices are declining (-3.0%/yr); year-one equity from $2k of loan paydown is wiped out by about $10k of value loss. Plan a longer hold.
- Collier County population projected at +30% by 2050 — long-run rental-demand tailwind backs the buy-and-hold thesis.
Negotiation context
- Only 7 days on market — expect competitive offers; lowballing is unlikely to land.
Risks & watch-outs
- Watch-outs: flood insurance adds $152/mo.
- Climate carrying-cost: in FEMA flood zone AH (mandatory federal flood insurance); severe wind risk, 99% chance of damaging wind over 30y; major wildfire risk; extreme-heat days projected 7→26/yr by 2055 (HVAC capex compounding) — expect insurance premiums to compound above CPI over the hold.
Questions for the listing agent
- What's the actual annual flood-insurance premium (NFIP or private), and is the property in a SFHA with mandatory coverage?
- Is there a deadline driving the sale (1031 exchange, divorce, estate, relocation)? That informs how much negotiation room exists.
- Schools are D-rated, which usually means shorter tenancies and higher turnover. Who's the typical renter profile here, and what's been the actual vacancy rate?
- What's the average days-on-market for RENTAL listings here right now (not sales)? A rising rental-DOM trend means longer vacancies and softer asking-rent achievability than the comps imply.
- What's the recent tenant-quality profile in this submarket — average credit score on applications, eviction rate, late-payment / NSF rate, and stable-employment percentage? A property-management company in the area should have these aggregated.
- How much new for-sale + rental construction is in the pipeline within 1–3 miles? Heavy new supply typically softens prices + rents 12–24 months out; constrained supply supports both.
Investment metrics
- 1% rule
- 0.98% ✗
- Cap rate
- 7.31%
- Cash-on-cash
- 3.63%
- DSCR
- 1.16
- GRM
- 8.5
CMA / ARV
No comps found within radius.
Projected returns pro-forma
-3.0% appreciation · 0.0% rent growth · sell at horizon
- IRR
- -17.1%
- Equity multiple
- 0.41×
- Total profit
- $-56,984
- Equity at exit
- $51,706
- IRR
- -16.4%
- Equity multiple
- 0.22×
- Total profit
- $-75,958
- Equity at exit
- $29,983
Cash invested: $97,098 (down + closing). Projections, not guarantees.
Landlord ↔ Tenant lean methodology
- Overall (STATE)
- 87 Strongly Landlord-Friendly
- State Florida
- 87 Strongly Landlord-Friendly · R+3
- County
- — inherits STATE
- City
- — inherits STATE
ZIP-level market 34120
- Rents YoY
- -1.6%
- Active inventory
- 1124
- Price-to-rent
- 8.5×
Monthly cashflow live
- Estimated rent
- $3,406 high interval (Pro) →
- Mortgage (P&I)
- −$1,819
- Tax est. 1.5%
- −$433 /mo · $5,202/yr
- Insurance
- −$144
- Flood insurance flood zone
- −$152 /mo · $1,824/yr
- HOA
- −$0
- Vacancy / Maint / Mgmt
- −$715
- Net cashflow
- $142
Break-even live
UW: 25.0% down · 7.5% · 30yr · 1.5% tax · 5.0% vac · 8.0% maint · 8.0% mgmt
Financing live
Cash to close
- Down payment
- $86,695
- Closing costs
- $10,403
- Reserves months
- —
- Total cash needed
- —
Loan-product check · same deal, 3 products live
Conventional
25% down · 7.5% · 30yr
- Down + closing
- —
- Monthly P&I
- —
- Monthly cashflow
- —
- DSCR
- —
- Eligible?
- —
Personal DTI + credit; lowest rate.
DSCR
20% down · 8.5% · 30yr
- Down + closing
- —
- Monthly P&I
- —
- Monthly cashflow
- —
- DSCR
- —
- Eligible?
- —
No personal income docs; deal must DSCR.
Hard money
10% down · 12.0% · 12mo
- Down + closing
- —
- Monthly P&I
- —
- Monthly cashflow
- —
- DSCR
- —
- Eligible?
- —
Short-term bridge; refi at stabilization.
Rent comps 5 comps
| Address | Beds | Baths | Sqft | Rent | $/sqft | DOM | Units | Dist |
|---|---|---|---|---|---|---|---|---|
| 4013 Perseus St Naples, FL | 3.0 | 2.5 | 2441 | $3,150 | $1.29 | 21d | 1 | 1.23mi |
| 3660 39th Ave NE Naples, FL | 3.0 | 2.0 | 1389 | $2,900 | $2.09 | 21d | 1 | 1.36mi |
| 4580 Centaurus Cir Naples, FL | 4.0 | 2.5 | 2428 | $3,200 | $1.32 | 21d | 1 | 1.37mi |
| 4003 Pegasus Way Naples, FL | 3.0 | 2.5 | 1966 | $3,300 | $1.68 | 23d | 1 | 1.38mi |
| 4191 Pegasus Way Naples, FL | 4.0 | 3.5 | 2014 | $4,000 | $1.99 | 21d | 1 | 1.41mi |
Listing history 5 events
-
2026-06-18days on market $346,780 Active 7 DOM
-
2026-06-17days on market $346,780 Active 6 DOM
-
2026-06-16days on market $346,780 Active 5 DOM
-
2026-06-15remarks 410-char remark
-
2026-06-15$346,780 Active 4 DOM
ⓘ Source: listings_history table (triggers on properties + properties_extension) + one-shot
backfill from property_details.listing_events for pre-trigger history.
Climate risk First Street
- Flood 1/10 Low FEMA zone AH · 0% chance over 30 yrs
- Wildfire 6/10 Major
- Heat 9/10 Extreme 7 d/yr ≥111°F today · 26 d/yr by 30 yrs out
- Wind 10/10 Extreme 99% chance of damaging wind over 30 yrs
- Air quality 2/10 Low 0 unhealthy d/yr today · 1 by 30 yrs out
Nearby sold comps map
Loading sold comps map…
Walkable amenities ~0.75 mi
Loading nearby amenities…
Taxation est. · year 1
- Rental income
- $40,870
- − Mortgage interest
- −$19,425
- − Property taxes
- −$5,202
- − Insurance
- −$3,558
- − Repairs & maintenance
- −$3,270
- − Management
- −$3,270
- − Depreciation
- −$10,088
- Taxable loss
- −$3,943
- Est. tax savings @ 24.0%
- +$946
- After-tax cash flow
- $2,651/yr
For passive investors: Depreciation is non-cash, so a rental often shows a tax loss while cash-flowing — sheltering income. Rental losses are passive: they offset passive income freely, and up to $25,000/yr can offset ordinary (W-2) income if you actively participate and your MAGI is under $100k (phasing out to $0 by $150k); unused losses carry forward. On sale, claimed depreciation is recaptured at up to 25%, and gains may owe capital-gains tax (a 1031 exchange can defer both). Figures are a year-1 estimate at your 24.0% rate — not tax advice; consult a CPA.
Condition & rehab AI · 13 photos
This townhouse is in excellent condition with no visible repairs needed. It has a good roof, exterior, and interior walls/paint. The highest-ROI updates would be painting the exterior and landscaping the front yard to enhance curb appeal and resale/rental value.
Value-add opportunities
- Both Painting the exterior — Enhances curb appeal and resale value
- Both Landscaping the front yard — Improves curb appeal and rental value
- Resale Updating the kitchen appliances — Modernizes the kitchen and enhances resale value
Renovation cost estimate screening
Value-add ROI direction
- Both Painting the exterior — Enhances curb appeal and resale value ↑
- Both Landscaping the front yard — Improves curb appeal and rental value ↑
- Resale Updating the kitchen appliances — Modernizes the kitchen and enhances resale value ↑
ⓘ Cost ranges are severity-bucket heuristics (US national rule-of-thumb). Get contractor quotes + a written scope before underwriting a rehab budget.
Schools (NCES district)
- District
- Collier
- NCES district ID
- 1200330
- Math proficiency
- 60% ▼ -4.00%
- Reading proficiency
- 56% ▼ -2.00%
- Median HH income
- $58,275
- Composite
- 50.23/100
- National rank
- #1892
- State rank
- #16 of 73 in FL
Livability — Orangetree
- Score
- 65/100
- State rank
- #636
- US rank
- #12453
Category grades
Schools grade is shown separately in the Schools card above.
Census & demographics
- County
- Collier County · 396,295 people
- Metro
- Naples-Marco Island, FL
- Population (ZIP)
- 42,345
- Household income
- $93,861
- Rent vs Own
- Severe rent burden
- 409.0
Population outlook (Collier County) Hauer SSP2
- Today (2025)
- 420,858 people
- By 2030
- 450,054 · +6.9%
- By 2040
- 502,232 · +19.3%
- By 2050
- 544,932 · +29.5%
- By 2075
- 627,203 · +49.0%
- By 2100
- 659,015 · +56.6%
Race, ethnicity, and origin ACS 2023
- Neighborhood character
- Diverse neighborhood (Simpson 0.58)
- Race & ethnicity
- White 56% Hispanic / Latino 32% Two or more races 23% Black 8% Asian 2%
- Hispanic origin (detail)
- Mexican 8% Puerto Rican 2% Cuban 13%
- Common ancestry
- Hispanic 4% Romanian 3% Italian 2%
- Foreign-born
- 28% · Canada, Jamaica, China
- Languages at home
- 62% English-only · Spanish 28% French/Haitian/Cajun 5% Other Indo-European 3%
Political lean MEDSL · Collier
- 2024 margin
- Solid R (+33.1) · D 33.1% · R 66.2%
- 2008→2024 swing
- -10.6pp toward R · 2008: -22.5pp · 2024: -33.1pp
- All cycles
- 2024: R+33.1 2020: R+24.7 2016: R+26.0 2012: R+30.1 2008: R+22.5
Not yet ingested
- Civics
- —
Market trends
- HPI YoY
- ▼ -223.18%
- Current HPI
- 316.2474
- Rent YoY
- ▼ -1.65%
- Metro
- Naples-Marco Island, FL
- State GDP YoY
- ▲ 3.28%
- F500 in state
- 36
Industry mix (Fortune 500 HQ in FL)
| Industry | F500 HQs | Revenue |
|---|---|---|
| Industrial Technology | 2 | $29B |
|
||
| Insurance | 2 | $17B |
|
||
| Retail | 1 | $60B |
|
||
| Technology Distribution | 1 | $58B |
|
||
| Homebuilding | 1 | $35B |
|
||
| Technology Manufacturing | 1 | $35B |
|
||
Cash-flow waterfall
monthlySold comps — $/sqft
last 12 mo · ≤1 miLoading sold comps…