 Multi-family
924 Seventh St #4 · Las Vegas, NM
Flood risk 1/10 · Minimal
- FEMA flood zone
- X (unshaded)
- Chance of flooding over 30 yrs
- 0.0%
- Est. flood insurance / yr
- $507 – $1,088
Fire risk 7/10 · Major
- Est. fire insurance / yr
- $706 – $1,312
Heat risk 2/10 · Minimal
- Hot days now (above 89°F)
- 7 days/yr
- Hot days in 30 yrs
- 18 days/yr
Wind risk 1/10 · Minimal
- Chance of severe wind over 30 yrs
- —
Air-quality risk 1/10 · Minimal
- Unhealthy air days now
- 0 days/yr
- Unhealthy air days in 30 yrs
- 0 days/yr
Risk factors via First Street. Map © Google.
Why this score? — see what drove the C+ grade
The composite is a weighted blend of 9 inputs, each scored 0–100. Each bar is that input's sub-score; the figure is the points it added to the 100-point composite (weight × sub-score).
- Cash flow +27.6/30.0
- DSCR +9.7/10.0
- 1% rule +7.5/10.0
- ARV discount +7.5/15.0
- Livability +3.5/5.0
- Rent growth +2.5/5.0
- Schools +2.3/10.0
- Condition / age +2.2/5.0
- Appreciation +0.0/10.0
$450,000
🖨 Deal sheet (PDF) 📄 Offer letter ✓ Due diligence
Multi-family units
County records classify this as Multi-Family (2-4 Unit). Listing-text estimate: 1 unit. estimate disagrees with records
Listing remarks
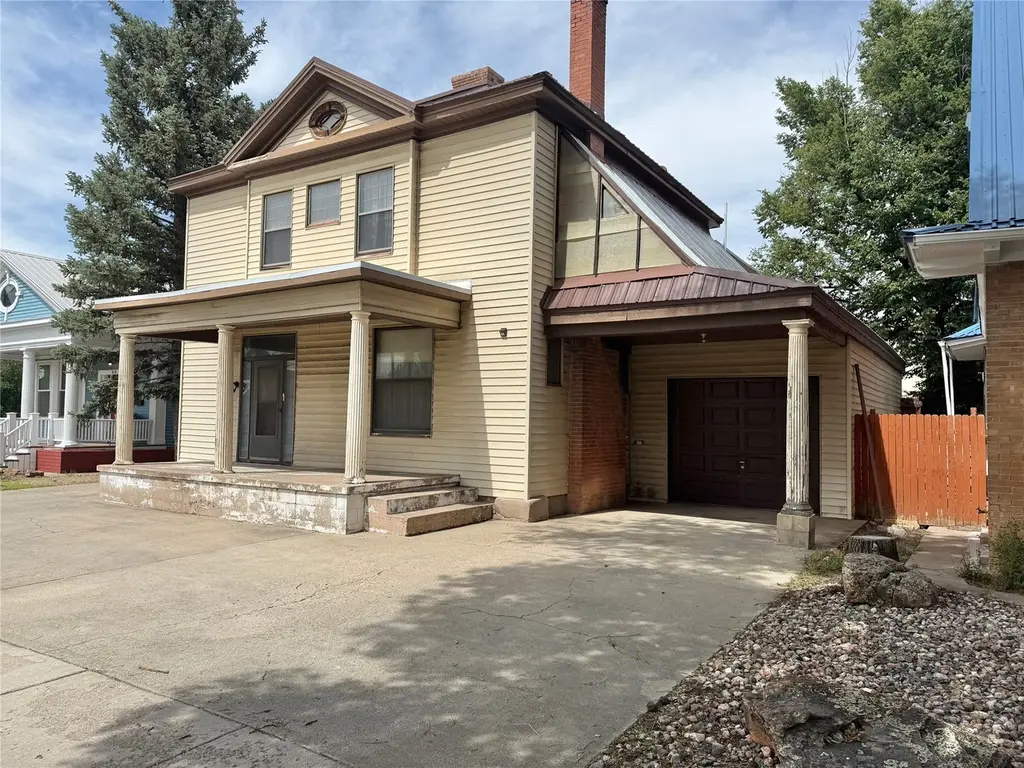
Located in the heart of our Las Vegas, NM community is this historical Colonial Revival style home with a stunning alcove featuring a lovely ornate staircase. The main level of this home offers a spacious living room with fireplace, formal dining room, large kitchen with lots of wood cabinets, breakfast area, an office, laundry room, and a half bath. Upstairs is the main bedroom with a huge ensuite bath, plus 4 more bedrooms and a bath. There is an attached garage, a carport, and a full basement which houses the boiler for the hot water baseboard heating system, the water heater, and provides plenty of storage. Not so fast . . . there is a separate structure with 3 delightful one bedroom, 1
Key facts
- Formal dining room
- Attached garage
- Ornate staircase
Tags
Property features AI
Finance
- Financial info: Property offered for sale; Four total units
Exterior
- Utilities: Electricity available; Public water; Public sewer
- Home design: Multi-family property
- Construction: Metal roof; Year built per assessor
- Exterior features: Zoned R-1 through R-6 for multi-family residential
Interior
- Bedrooms: Three one-bedroom units (month-to-month tenancy)
- Bathrooms: Each one-bedroom unit has one bathroom
- Heating & cooling: Forced air heating; Hot water heating; Radiant heating
- Interior features: Interior steps
Neighborhood map
What this means for you Summary
Snapshot
- This is a 3-bed/3.0-bath multifamily listed at $450k. Condition is rated fair.
Deal economics
- At list price, monthly cash flow is $1k ($16k/yr) — positive.
- The deal already cash-flows at list — no discount required.
- Meets the 1% rule at list price ($6k rent vs $450k).
- Recommended offer: $443k (1.5% below list) — sets the bar for market timing.
Location & tenants
- Location reads 70/100 on livability (#22 in NM) — a middle-class / working-renter tenant base. Strengths: cost of living A+, health & safety A+, amenities A; Watch: schools D-, crime F, commute F.
- Las Vegas City Public Schools (town): math 17% / reading 31% proficiency, ranked #52 of 95 in NM (top 55%) — low school quality limits family demand, transient renter base, plan for 1-2y turnover; 66% free/reduced lunch — lower-income household profile, screen leases tightly.
- Market conditions: 90 active listings in the ZIP.
Forward outlook
- Local home prices are declining (-3.0%/yr); year-one equity from $3k of loan paydown is wiped out by about $14k of value loss. Plan a longer hold.
- San Miguel County population projected at -26% by 2050 — secular population decline; favor cash flow + early exit over multi-decade hold.
- At projected returns (-3.0% appreciation + 3.0% rent growth), your $126k cash investment doubles in ~9 years — after that, you're playing with house money.
Negotiation context
- It's been on market 15 days — a 2% lower offer ($443k) is reasonable based on typical stale-listing flexibility.
Risks & watch-outs
- Watch-outs: built in 1898 — expect roof / HVAC / electrical / plumbing capex.
- Climate carrying-cost: major wildfire risk — expect insurance premiums to compound above CPI over the hold.
Questions for the listing agent
- Have any recent inspections been done? Can we get a copy of the seller's disclosures and any deferred-maintenance estimates?
- Built in 1898 — when were the roof, HVAC, electrical panel, plumbing, and water heater last replaced?
- Is there a deadline driving the sale (1031 exchange, divorce, estate, relocation)? That informs how much negotiation room exists.
- Schools are D-rated, which usually means shorter tenancies and higher turnover. Who's the typical renter profile here, and what's been the actual vacancy rate?
- Crime grade is F in this area — have there been break-ins, vandalism, or insurance claims at this property in the last 3 years? What carrier currently insures it and at what premium?
- What's the average days-on-market for RENTAL listings here right now (not sales)? A rising rental-DOM trend means longer vacancies and softer asking-rent achievability than the comps imply.
- What's the recent tenant-quality profile in this submarket — average credit score on applications, eviction rate, late-payment / NSF rate, and stable-employment percentage? A property-management company in the area should have these aggregated.
- How much new apartment / multifamily construction is in the pipeline within 1–3 miles? Heavy new supply (>2% of stock underway) typically softens rents 12–24 months out; light construction supports rent growth.
Investment metrics
- 1% rule
- 1.25% ✓
- Cap rate
- 9.89%
- Cash-on-cash
- 12.83%
- DSCR
- 1.57
- GRM
- 6.6
CMA / ARV
No comps found within radius.
Projected returns pro-forma
-3.0% appreciation · 3.0% rent growth · sell at horizon
- IRR
- 2.7%
- Equity multiple
- 1.10×
- Total profit
- $12,978
- Equity at exit
- $67,096
- IRR
- 12.3%
- Equity multiple
- 1.97×
- Total profit
- $122,144
- Equity at exit
- $38,908
Cash invested: $126,000 (down + closing). Projections, not guarantees.
Landlord ↔ Tenant lean methodology
- Overall (STATE)
- 55 Moderately Landlord-Leaning
- State New Mexico
- 55 Moderately Landlord-Leaning · D+3
- County
- — inherits STATE
- City
- — inherits STATE
ZIP-level market 87701
- Active inventory
- 90
- Price-to-rent
- 33.2×
Monthly cashflow live
- Estimated rent
- $5,642 medium interval (Pro) →
- Mortgage (P&I)
- −$2,360
- Tax est. 1.5%
- −$562 /mo · $6,750/yr
- Insurance
- −$188
- HOA
- −$0
- Vacancy / Maint / Mgmt
- −$1,185
- Net cashflow
- $1,347
Break-even live
Sensitivity live
| Price | -10% $1,658 | -5% $1,503 | +0% $1,347 | +5% $1,192 | +10% $1,036 |
|---|---|---|---|---|---|
| Rent | -10% $902 | -5% $1,124 | +0% $1,347 | +5% $1,570 | +10% $1,793 |
| Rate | -1.0pp $1,574 | -0.5pp $1,462 | base $1,347 | +0.5pp $1,231 | +1.0pp $1,112 |
5-unit breakdown (identical units grouped — click to expand)
| Units | Beds | Baths | Est. rent |
|---|---|---|---|
| 5× units | 1 | 1 | $5,640 |
| #1 | 1 | 1 | $1,128 |
| #2 | 1 | 1 | $1,128 |
| #3 | 1 | 1 | $1,128 |
| #4 | 1 | 1 | $1,128 |
| #5 | 1 | 1 | $1,128 |
| Total (5 units) | $5,642 | ||
UW: 25.0% down · 7.5% · 30yr · 1.5% tax · 5.0% vac · 8.0% maint · 8.0% mgmt
Financing live
Cash to close
- Down payment
- $112,500
- Closing costs
- $13,500
- Reserves months
- —
- Total cash needed
- —
Loan-product check · same deal, 3 products live
Conventional
25% down · 7.5% · 30yr
- Down + closing
- —
- Monthly P&I
- —
- Monthly cashflow
- —
- DSCR
- —
- Eligible?
- —
Personal DTI + credit; lowest rate.
DSCR
20% down · 8.5% · 30yr
- Down + closing
- —
- Monthly P&I
- —
- Monthly cashflow
- —
- DSCR
- —
- Eligible?
- —
No personal income docs; deal must DSCR.
Hard money
10% down · 12.0% · 12mo
- Down + closing
- —
- Monthly P&I
- —
- Monthly cashflow
- —
- DSCR
- —
- Eligible?
- —
Short-term bridge; refi at stabilization.
Listing history 9 events
-
2026-06-09days on market $450,000 Active 15 DOM
-
2026-06-08days on market $450,000 Active 14 DOM
-
2026-06-07days on market $450,000 Active 13 DOM
-
2026-06-07days on market $450,000 Active 12 DOM
-
2026-06-04days on market $450,000 Active 9 DOM
-
2026-06-02days on market $450,000 Active 8 DOM
-
2026-06-01days on market $450,000 Active 7 DOM
-
2026-05-31days on market $450,000 Active 6 DOM
-
2026-05-15$450,000 Active
ⓘ Source: listings_history table (triggers on properties + properties_extension) + one-shot
backfill from property_details.listing_events for pre-trigger history.
Climate risk First Street
- Flood 1/10 Low FEMA zone X (unshaded) · 0% chance over 30 yrs
- Wildfire 7/10 Severe
- Heat 2/10 Low 7 d/yr ≥89°F today · 18 d/yr by 30 yrs out
- Wind 1/10 Low
- Air quality 1/10 Low 0 unhealthy d/yr today · 0 by 30 yrs out
Nearby sold comps map
Loading sold comps map…
Walkable amenities ~0.75 mi
Loading nearby amenities…
Taxation est. · year 1
- Rental income
- $67,704
- − Mortgage interest
- −$25,207
- − Property taxes
- −$6,750
- − Insurance
- −$2,250
- − Repairs & maintenance
- −$5,416
- − Management
- −$5,416
- − Depreciation
- −$13,091
- Taxable income
- $9,573
- Est. tax owed @ 24.0%
- −$2,298
- After-tax cash flow
- $13,870/yr
For passive investors: Depreciation is non-cash, so a rental often shows a tax loss while cash-flowing — sheltering income. Rental losses are passive: they offset passive income freely, and up to $25,000/yr can offset ordinary (W-2) income if you actively participate and your MAGI is under $100k (phasing out to $0 by $150k); unused losses carry forward. On sale, claimed depreciation is recaptured at up to 25%, and gains may owe capital-gains tax (a 1031 exchange can defer both). Figures are a year-1 estimate at your 24.0% rate — not tax advice; consult a CPA.
Condition & rehab AI · 13 photos
This multi-family home requires moderate repairs and maintenance to improve its condition and increase its resale and rental value.
Repairs flagged
- Minor kitchen cabinets — slight wear
- Minor bathroom fixtures — slight discoloration
- Moderate exterior siding — visible wear
- Unknown HVAC system — not visible
Value-add opportunities
- Both paint interior walls — enhances curb appeal and interior aesthetics
- Both replace worn carpet — improves comfort and reduces maintenance
- Both repair exterior siding — enhances curb appeal and structural integrity
- Both service HVAC system — improves comfort and energy efficiency
Renovation cost estimate screening
| Repair item | Severity | Est. cost |
|---|---|---|
| kitchen cabinets · slight wear | Minor | $500–3,000 |
| bathroom fixtures · slight discoloration | Minor | $500–3,000 |
| exterior siding · visible wear | Moderate | $3,000–15,000 |
| HVAC system · not visible | Unknown | $500–3,000 |
| Total estimated repair cost · 4 items | $4,500–24,000 |
Value-add ROI direction
- Both paint interior walls — enhances curb appeal and interior aesthetics ↑
- Both replace worn carpet — improves comfort and reduces maintenance ↑
- Both repair exterior siding — enhances curb appeal and structural integrity ↑
- Both service HVAC system — improves comfort and energy efficiency ↑
ⓘ Cost ranges are severity-bucket heuristics (US national rule-of-thumb). Get contractor quotes + a written scope before underwriting a rehab budget.
Schools (NCES district)
- District
- Las Vegas City Public Schools
- NCES district ID
- 3501530
- Math proficiency
- 17% —
- Reading proficiency
- 31% —
- Median HH income
- $32,148
- Composite
- 22.58/100
- National rank
- #13441
- State rank
- #52 of 95 in NM
Livability — Las Vegas
- Score
- 70/100
- State rank
- #22
- US rank
- #8084
Category grades
Schools grade is shown separately in the Schools card above.
Census & demographics
- Census place
- Las Vegas, NM
- Population (ZIP)
- 17,864
Population outlook (San Miguel County) Hauer SSP2
- Today (2025)
- 25,750 people
- By 2030
- 24,399 · -5.2%
- By 2040
- 21,705 · -15.7%
- By 2050
- 19,188 · -25.5%
- By 2075
- 15,030 · -41.6%
- By 2100
- 12,418 · -51.8%
Race, ethnicity, and origin ACS 2023
- Neighborhood character
- Predominantly Hispanic (77%)
- Race & ethnicity
- Hispanic / Latino 77% Two or more races 28% White 16% Native American 3% Black 1%
- Hispanic origin (detail)
- Mexican 31%
- Common ancestry
- Lithuanian 1% Serbian 1% Romanian 1%
- Foreign-born
- 3% · Canada
- Languages at home
- 55% English-only · Spanish 42%
Political lean MEDSL · San Miguel
- 2024 margin
- Strong D (+27.9) · D 62.9% · R 35.0% · Other 2.1%
- 2008→2024 swing
- -32.7pp toward R · 2008: 60.6pp · 2024: 27.9pp
- All cycles
- 2024: D+27.9 2020: D+38.7 2016: D+46.4 2012: D+56.8 2008: D+60.6
Not yet ingested
- Civics
- —
Market trends
- HPI YoY
- ▼ -94.60%
- Current HPI
- 166.7301
- Rent YoY
- —
- Metro
- —
- State GDP YoY
- —
- F500 in state
- 0
Price history
1 event — show timeline
- 2026-05-15 Listed $450,000 Santa Fe MLS
Cash-flow waterfall
monthlySold comps — $/sqft
last 12 mo · ≤1 miLoading sold comps…