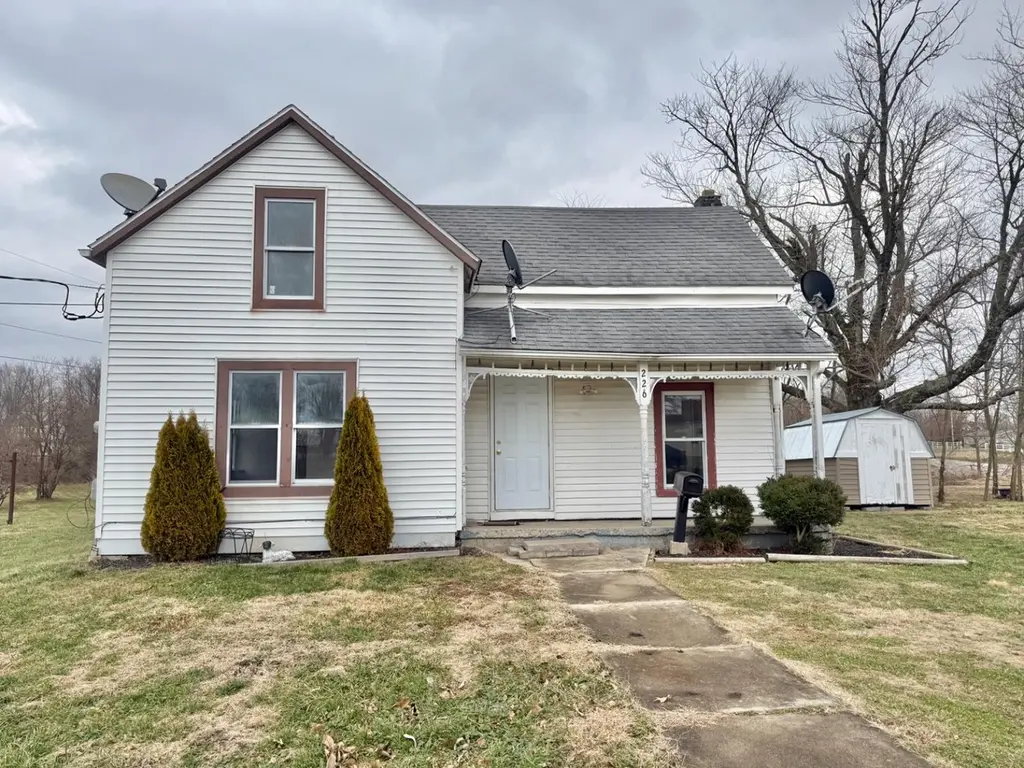
226 Cardinal Ln · Osgood, IN
Flood risk 1/10 · Minimal
- FEMA flood zone
- X (unshaded)
- Chance of flooding over 30 yrs
- 0.0%
- Est. flood insurance / yr
- $473 – $860
Fire risk 1/10 · Minimal
- Est. fire insurance / yr
- $717 – $1,331
Heat risk 4/10 · Minor
- Hot days now (above 102°F)
- 7 days/yr
- Hot days in 30 yrs
- 20 days/yr
Wind risk 2/10 · Minimal
- Chance of severe wind over 30 yrs
- 1.0%
Air-quality risk 2/10 · Minimal
- Unhealthy air days now
- 1 days/yr
- Unhealthy air days in 30 yrs
- 1 days/yr
Risk factors via First Street. Map © Google.
Why this score? — see what drove the B+ grade
The composite is a weighted blend of 9 inputs, each scored 0–100. Each bar is that input's sub-score; the figure is the points it added to the 100-point composite (weight × sub-score).
- Cash flow +30.0/30.0
- 1% rule +10.0/10.0
- DSCR +10.0/10.0
- Appreciation +10.0/10.0
- ARV discount +7.5/15.0
- Livability +3.6/5.0
- Schools +3.1/10.0
- Rent growth +2.5/5.0
- Condition / age +2.5/5.0
$78,500
🖨 Deal sheet (PDF) 📄 Offer letter ✓ Due diligence
Listing remarks MLS
Investment Opportunity: Unlock the potential of this versatile property located in the quiet, charming heart of Osgood, In. Situated on an expansive 0.61-acre lot at the end of a dead-end road in town , this 3-4 BDRM /1 BA, 1,500 sq. ft. home offers the perfect canvas for your next real estate venture. Whether you are looking to build equity through a fix-and-flip, expand your rental portfolio, or find a primary residence. This home needs TLC. Cash buyers only. Being sold AS-IS.
Key facts
- Expansive lot
- Massive yard
- Dead-end road
Tags
Neighborhood map
What this means for you Summary
Snapshot
- This is a 4-bed/1.0-bath single-family listed at $78k.
Deal economics
- At list price, monthly cash flow is $436 ($5k/yr) — positive.
- The deal already cash-flows at list — no discount required.
- Meets the 1% rule at list price ($1k rent vs $78k).
- Recommended offer: $69k (12.0% below list) — sets the bar for market timing.
Location & tenants
- Location reads 71/100 on livability (#134 in IN) — a middle-class / working-renter tenant base. Strengths: crime A+, cost of living A+, housing A+; Watch: employment D+, amenities F, commute F.
- Jac-Cen-Del Community School Corporation (rural): math 32% / reading 40% proficiency, ranked #185 of 301 in IN (top 62%) — families likely to look elsewhere, expect single-tenant / working-renter base with shorter leases.
- Zoned schools: Jac-Cen-Del Elementary School (math 36% / reading 36%, grade F, #577 of 994 statewide, top 59%, 390 students, 55% FRL); Jac-Cen-Del Ms/Hs (math 27% / reading 42%, grade F, #270 of 369 statewide, top 77%, 383 students, 49% FRL) — zoned schools average 52% FRL vs 33% district-wide (19 pts higher); higher-poverty schools than district average — tighter screening recommended.
- Market conditions: 19 active listings in the ZIP; 110 units permitted in Ripley County in 2024 (0 in 5+ unit buildings).
Forward outlook
- In year one you build about $8k of equity ($543 loan paydown + $8k appreciation (10.0% local appreciation)).
- Ripley County population projected at -10% by 2050 — secular population decline; favor cash flow + early exit over multi-decade hold.
- At projected returns (10.0% appreciation + 3.0% rent growth), your $22k cash investment doubles in ~2 years — after that, you're playing with house money.
- By year 5, paydown + projected appreciation supports a ~$39k cash-out refi (75% LTV) — recoverable capital for the next deal without selling this one.
Negotiation context
- It's been on market 160 days — a 12% lower offer ($69k) is reasonable based on typical stale-listing flexibility.
- 2 sale attempts since 13y ago; this cycle's ask has dropped $20k (21%) from the opening price — seller is motivated, your offer sets the floor, not the list.
Risks & watch-outs
- Watch-outs: built in 1900 — expect roof / HVAC / electrical / plumbing capex.
Questions for the listing agent
- It's been on market 160 days. Have you received any prior offers? Is the seller open to a 12% concession, seller financing, or rate buy-down credit?
- Built in 1900 — when were the roof, HVAC, electrical panel, plumbing, and water heater last replaced?
- Why hasn't it sold? Are there any deal-killer items the seller is aware of (foundation, flood, title, zoning, code violations)?
- Is there a deadline driving the sale (1031 exchange, divorce, estate, relocation)? That informs how much negotiation room exists.
- Schools are D-rated, which usually means shorter tenancies and higher turnover. Who's the typical renter profile here, and what's been the actual vacancy rate?
- What's the average days-on-market for RENTAL listings here right now (not sales)? A rising rental-DOM trend means longer vacancies and softer asking-rent achievability than the comps imply.
- What's the recent tenant-quality profile in this submarket — average credit score on applications, eviction rate, late-payment / NSF rate, and stable-employment percentage? A property-management company in the area should have these aggregated.
- How much new for-sale + rental construction is in the pipeline within 1–3 miles? Heavy new supply typically softens prices + rents 12–24 months out; constrained supply supports both.
Investment metrics
- 1% rule
- 1.58% ✓
- Cap rate
- 12.96%
- Cash-on-cash
- 23.82%
- DSCR
- 2.06
- GRM
- 5.3
CMA / ARV
- ARV (median comp)
- $166,685
- List price
- $78,500
- Delta
- -52.91%
- Verdict
- UNDERPRICED
- Comps
- 20 within 1.0 mi
Show comp detail 9 sales within ~0.75 mi
| Address | Dist | Beds/Ba | Sqft | Sold | Price | $/sf | Match |
|---|---|---|---|---|---|---|---|
| 247 N Maple St | 0.25mi | 3/2.0 (-1) | 1,456 (+0%) | 6mo | $226,200 | $155 | 75 |
| 403 N Maple St | 0.28mi | 3/1.0 (-1) | 1,515 (+4%) | 1mo | $45,000 | $30 | 74 |
| 208 N Maple St | 0.21mi | 3/1.0 (-1) | 1,412 (-3%) | 16mo | $43,000 | $30 | 67 |
| 151 N Elm St | 0.06mi | 3/3.0 (-1) | 1,349 (-7%) | 8mo | $182,900 | $136 | 66 |
| 405 S Walnut St | 0.34mi | 3/1.5 (-1) | 1,544 (+6%) | 3mo | $259,900 | $168 | 65 |
| 227 S Maple St | 0.30mi | 3/2.5 (-1) | 1,500 (+3%) | 7mo | $207,500 | $138 | 64 |
| 113 N Sycamore St | 0.31mi | 3/2.5 (-1) | 1,300 (-11%) | 3mo | $197,000 | $152 | 55 |
| 409 N Maple St | 0.29mi | 3/2.0 (-1) | 1,280 (-12%) | 13mo | $73,000 | $57 | 47 |
| 4423 Hillcrest Dr | 0.63mi | 3/1.5 (-1) | 1,299 (-11%) | 8mo | $210,000 | $162 | 40 |
Match score weights: distance 35% · size 25% · config 20% · recency 20%. Top-matched comps best support the ARV.
Projected returns pro-forma
10.0% appreciation · 3.0% rent growth · sell at horizon
- IRR
- 42.2%
- Equity multiple
- 4.21×
- Total profit
- $70,561
- Equity at exit
- $70,719
- IRR
- 36.4%
- Equity multiple
- 9.46×
- Total profit
- $185,975
- Equity at exit
- $152,508
Cash invested: $21,980 (down + closing). Projections, not guarantees.
Landlord ↔ Tenant lean methodology
- Overall (STATE)
- 90 Strongly Landlord-Friendly
- State Indiana
- 90 Strongly Landlord-Friendly · R+11
- County
- — inherits STATE
- City
- — inherits STATE
ZIP-level market 47037
- Home prices YoY
- 5.4%
- Active inventory
- 19
- Price-to-rent
- 5.3×
Monthly cashflow live
- Estimated rent
- $1,239 medium interval (Pro) →
- Mortgage (P&I)
- −$412
- Tax from tax record
- −$98 /mo · $1,182/yr
- Insurance
- −$33
- HOA
- −$0
- Vacancy / Maint / Mgmt
- −$260
- Net cashflow
- $436
Break-even live
Sensitivity live
| Price | -10% $481 | -5% $459 | +0% $436 | +5% $414 | +10% $392 |
|---|---|---|---|---|---|
| Rent | -10% $338 | -5% $387 | +0% $436 | +5% $485 | +10% $534 |
| Rate | -1.0pp $476 | -0.5pp $456 | base $436 | +0.5pp $416 | +1.0pp $395 |
UW: 25.0% down · 7.5% · 30yr · 1.5% tax · 5.0% vac · 8.0% maint · 8.0% mgmt
Financing live
Cash to close
- Down payment
- $19,625
- Closing costs
- $2,355
- Reserves months
- —
- Total cash needed
- —
Loan-product check · same deal, 3 products live
Conventional
25% down · 7.5% · 30yr
- Down + closing
- —
- Monthly P&I
- —
- Monthly cashflow
- —
- DSCR
- —
- Eligible?
- —
Personal DTI + credit; lowest rate.
DSCR
20% down · 8.5% · 30yr
- Down + closing
- —
- Monthly P&I
- —
- Monthly cashflow
- —
- DSCR
- —
- Eligible?
- —
No personal income docs; deal must DSCR.
Hard money
10% down · 12.0% · 12mo
- Down + closing
- —
- Monthly P&I
- —
- Monthly cashflow
- —
- DSCR
- —
- Eligible?
- —
Short-term bridge; refi at stabilization.
Listing history 22 events
-
2026-06-21days on market $78,500 Active 160 DOM
-
2026-06-21days on market $78,500 Active 159 DOM
-
2026-06-18days on market $78,500 Active 157 DOM
-
2026-06-17days on market $78,500 Active 156 DOM
-
2026-06-16days on market $78,500 Active 155 DOM
-
2026-06-15days on market $78,500 Active 154 DOM
-
2026-06-13pricedays on market $78,500 Active 152 DOM
-
2026-06-12days on market $79,900 Active 151 DOM
-
2026-06-09days on market $79,900 Active 148 DOM
-
2026-06-08days on market $79,900 Active 147 DOM
-
2026-06-07days on market $79,900 Active 146 DOM
-
2026-06-05days on market $79,900 Active 144 DOM
-
2026-06-04days on market $79,900 Active 142 DOM
-
2026-06-02days on market $79,900 Active 141 DOM
-
2026-06-01days on market $79,900 Active 140 DOM
-
2026-05-31days on market $79,900 Active 139 DOM
-
2026-05-31days on market $79,900 Active 138 DOM
-
2026-05-17price $79,900 484-char remark
Show marketing remark (484 chars)
Investment Opportunity: Unlock the potential of this versatile property located in the quiet, charming heart of Osgood, In. Situated on an expansive 0.61-acre lot at the end of a dead-end road in town , this 3-4 BDRM /1 BA, 1,500 sq. ft. home offers the perfect canvas for your next real estate venture. Whether you are looking to build equity through a fix-and-flip, expand your rental portfolio, or find a primary residence. This home needs TLC. Cash buyers only. Being sold AS-IS.
-
2026-04-02price $85,000 484-char remark
Show marketing remark (484 chars)
Investment Opportunity: Unlock the potential of this versatile property located in the quiet, charming heart of Osgood, In. Situated on an expansive 0.61-acre lot at the end of a dead-end road in town , this 3-4 BDRM /1 BA, 1,500 sq. ft. home offers the perfect canvas for your next real estate venture. Whether you are looking to build equity through a fix-and-flip, expand your rental portfolio, or find a primary residence. This home needs TLC. Cash buyers only. Being sold AS-IS.
-
2026-02-18price $86,000 484-char remark
Show marketing remark (484 chars)
Investment Opportunity: Unlock the potential of this versatile property located in the quiet, charming heart of Osgood, In. Situated on an expansive 0.61-acre lot at the end of a dead-end road in town , this 3-4 BDRM /1 BA, 1,500 sq. ft. home offers the perfect canvas for your next real estate venture. Whether you are looking to build equity through a fix-and-flip, expand your rental portfolio, or find a primary residence. This home needs TLC. Cash buyers only. Being sold AS-IS.
-
2026-01-12$99,000 Active 484-char remark
Show marketing remark (484 chars)
Investment Opportunity: Unlock the potential of this versatile property located in the quiet, charming heart of Osgood, In. Situated on an expansive 0.61-acre lot at the end of a dead-end road in town , this 3-4 BDRM /1 BA, 1,500 sq. ft. home offers the perfect canvas for your next real estate venture. Whether you are looking to build equity through a fix-and-flip, expand your rental portfolio, or find a primary residence. This home needs TLC. Cash buyers only. Being sold AS-IS.
-
2013-04-13$48,500
ⓘ Source: listings_history table (triggers on properties + properties_extension) + one-shot
backfill from property_details.listing_events for pre-trigger history.
Tax reassessment forecast IN · Partial reset (capped growth)
- Current annual tax
- $1,182 · $98/mo
- Projected year-2 tax
- $1,182 · $98/mo
- Expected delta
- $0/yr ($0/mo · 0.0%)
ⓘ Screening estimate from a state-policy table — verify with the county assessor before closing.
Climate risk First Street
- Flood 1/10 Low FEMA zone X (unshaded) · 0% chance over 30 yrs
- Wildfire 1/10 Low
- Heat 4/10 Moderate 7 d/yr ≥102°F today · 20 d/yr by 30 yrs out
- Wind 2/10 Low 100% chance of damaging wind over 30 yrs
- Air quality 2/10 Low 1 unhealthy d/yr today · 1 by 30 yrs out
Nearby sold comps map
Loading sold comps map…
Walkable amenities ~0.75 mi
Loading nearby amenities…
Taxation est. · year 1
- Rental income
- $14,874
- − Mortgage interest
- −$4,397
- − Property taxes
- −$1,182
- − Insurance
- −$392
- − Repairs & maintenance
- −$1,190
- − Management
- −$1,190
- − Depreciation
- −$2,284
- Taxable income
- $4,239
- Est. tax owed @ 24.0%
- −$1,017
- After-tax cash flow
- $4,218/yr
For passive investors: Depreciation is non-cash, so a rental often shows a tax loss while cash-flowing — sheltering income. Rental losses are passive: they offset passive income freely, and up to $25,000/yr can offset ordinary (W-2) income if you actively participate and your MAGI is under $100k (phasing out to $0 by $150k); unused losses carry forward. On sale, claimed depreciation is recaptured at up to 25%, and gains may owe capital-gains tax (a 1031 exchange can defer both). Figures are a year-1 estimate at your 24.0% rate — not tax advice; consult a CPA.
Schools (NCES district)
- District
- Jac-Cen-Del Community School Corporation
- NCES district ID
- 1804800
- Math proficiency
- 32% ▼ -14.00%
- Reading proficiency
- 40% ▼ -8.00%
- Median HH income
- $46,674
- Composite
- 30.83/100
- National rank
- #6133
- State rank
- #185 of 301 in IN
Livability — Osgood
- Score
- 71/100
- State rank
- #134
- US rank
- #6966
Category grades
Schools grade is shown separately in the Schools card above.
Census & demographics
- Census place
- Osgood, IN
- Population (ZIP)
- 4,289
Population outlook (Ripley County) Hauer SSP2
- Today (2025)
- 28,713 people
- By 2030
- 28,400 · -1.1%
- By 2040
- 27,288 · -5.0%
- By 2050
- 25,691 · -10.5%
- By 2075
- 22,222 · -22.6%
- By 2100
- 17,965 · -37.4%
Race, ethnicity, and origin ACS 2023
- Neighborhood character
- Predominantly White (94%)
- Race & ethnicity
- White 94% Hispanic / Latino 2% Asian 2% Two or more races 1%
- Common ancestry
- Slovak 2% Lithuanian 2%
- Foreign-born
- 2% · Canada
- Languages at home
- 98% English-only · Other Indo-European 2%
Political lean MEDSL · Ripley
- 2024 margin
- Solid R (+61.5) · D 18.6% · R 80.1% · Other 1.2%
- 2008→2024 swing
- -31.9pp toward R · 2008: -29.6pp · 2024: -61.5pp
- All cycles
- 2024: R+61.5 2020: R+59.5 2016: R+57.4 2012: R+38.6 2008: R+29.6
Not yet ingested
- Civics
- —
Market trends
- HPI YoY
- ▲ 13.68%
- Current HPI
- 267.94
- Rent YoY
- —
- Metro
- —
- State GDP YoY
- ▲ 2.90%
- F500 in state
- 18
Industry mix (Fortune 500 HQ in IN)
| Industry | F500 HQs | Revenue |
|---|---|---|
| Industrial Machinery | 2 | $37B |
|
||
| Healthcare | 1 | $177B |
|
||
| Pharmaceuticals | 1 | $45B |
|
||
| Metals / Steel | 1 | $18B |
|
||
| Agriculture | 1 | $17B |
|
||
| Packaging | 1 | $12B |
|
||
Price history
+64.7% since first listed5 events — show timeline
- 2026-05-17 Price Changed $79,900 SEIBR
- 2026-04-02 Price Changed $85,000 SEIBR
- 2026-02-18 Price Changed $86,000 SEIBR
- 2026-01-12 Listed $99,000 SEIBR
- 2013-04-13 Listed $48,500 SEIBR
Property tax history
+3.6%/yrLatest (2024): $1,182 · -0.1% YoY. Source: county tax records.
Cash-flow waterfall
monthlySold comps — $/sqft
last 12 mo · ≤1 miLoading sold comps…