1020 Nighthawk Trl · Alvarado, TX
Flood risk 1/10 · Minimal
- FEMA flood zone
- X (unshaded)
- Chance of flooding over 30 yrs
- 0.0%
- Est. flood insurance / yr
- $507 – $1,088
Fire risk 2/10 · Minimal
- Est. fire insurance / yr
- $1,222 – $2,270
Heat risk 7/10 · Major
- Hot days now (above 110°F)
- 7 days/yr
- Hot days in 30 yrs
- 25 days/yr
Wind risk 6/10 · Moderate
- Chance of severe wind over 30 yrs
- 27.0%
Air-quality risk 2/10 · Minimal
- Unhealthy air days now
- 1 days/yr
- Unhealthy air days in 30 yrs
- 2 days/yr
Risk factors via First Street. Map © Google.
Why this score? — see what drove the F grade
The composite is a weighted blend of 9 inputs, each scored 0–100. Each bar is that input's sub-score; the figure is the points it added to the 100-point composite (weight × sub-score).
- ARV discount +7.5/15.0
- Cash flow +6.0/30.0
- Livability +3.7/5.0
- Schools +3.4/10.0
- Rent growth +2.5/5.0
- Condition / age +2.5/5.0
- 1% rule +1.4/10.0
- DSCR +0.3/10.0
- Appreciation +0.0/10.0
$369,900
🖨 Deal sheet (PDF) 📄 Offer letter ✓ Due diligence
Listing remarks
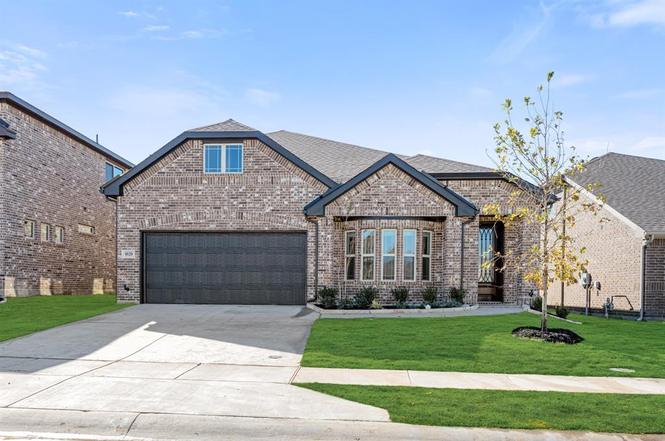
NEW HOME! NEVER LIVED IN & READY TO CLOSE! Welcome to the Willow II by Bloomfield Homes—a thoughtfully designed two-story home offering 4 bedrooms, 3 baths, and an inviting open-concept layout that blends comfort, style, and function. From the elevated brick façade with an 8-foot upgraded front door to the covered front porch framed by classic gables and a bay window, this home radiates charm from the moment you arrive. Inside, the entryway opens to upgraded laminate flooring that continues through the study, kitchen, family room, and hallways, creating a seamless flow between spaces. The kitchen impresses with granite countertops, custom cabinetry, a gas cooktop, and a l
Key facts
- Covered front porch
- Upgraded front door
- Bay window
Tags
Neighborhood map
What this means for you Summary
Snapshot
- This is a 4-bed/3.0-bath land listed at $370k.
Deal economics
- At list price, monthly cash flow is $-710 ($-9k/yr) — negative.
- To cash-flow at today's rent, offer at most $267k (27.8% below list).
- To meet the 1% rule (rent ≥ 1% of price), the offer needs to be $237k (36.0% below list).
- Recommended offer: $237k (36.0% below list) — sets the bar for 1% rule.
Location & tenants
- Location reads 73/100 on livability (#228 in TX) — a middle-class / working-renter tenant base. Strengths: cost of living A+, housing A+, health & safety A+; Watch: amenities F, commute F.
- Alvarado ISD (rural): math 41% / reading 37% proficiency, ranked #416 of 826 in TX (top 50%) — families likely to look elsewhere, expect single-tenant / working-renter base with shorter leases.
- Zoned schools: Alvarado Int (math 49% / reading 35%, grade F, #1,335 of 4,322 statewide, top 33%, 799 students, 73% FRL); Alvarado J H (math 35% / reading 33%, grade F, #892 of 1,662 statewide, top 55%, 845 students, 67% FRL) — zoned schools average 70% FRL vs 52% district-wide (18 pts higher); higher-poverty schools than district average — tighter screening recommended.
- Market conditions: 360 active listings in the ZIP; 5 comparable units currently listed for rent nearby; rentals at typical pace (median 24d on market — plan ~3-4 weeks tenant-placement turnaround); 40% of comp listings sitting > 30 days — soft ceiling on asking rent; solid renter incomes; 2,152 units permitted in Johnson County in 2024 (76 in 5+ unit buildings).
- This rent runs 36% of the median local income ($80k/yr) — at the standard rent-burdened threshold; future hikes will face affordability resistance.
Forward outlook
- Local home prices are declining (-3.0%/yr); year-one equity from $3k of loan paydown is wiped out by about $11k of value loss. Plan a longer hold.
- Johnson County population projected at +24% by 2050 — long-run rental-demand tailwind backs the buy-and-hold thesis.
Negotiation context
- It's been on market 194 days — a 12% lower offer ($326k) is reasonable based on typical stale-listing flexibility.
Risks & watch-outs
- Climate carrying-cost: major wind risk, 27% chance of damaging wind over 30y; extreme-heat days projected 7→25/yr by 2055 (HVAC capex compounding) — expect insurance premiums to compound above CPI over the hold.
Questions for the listing agent
- What do current leases actually rent for vs. the listed asking? Can we see a recent rent roll and the last 12 months of T-12 income?
- It's been on market 194 days. Have you received any prior offers? Is the seller open to a 36% concession, seller financing, or rate buy-down credit?
- What does the HOA fee cover, when was the last increase, and are there any pending special assessments or reserve-fund shortfalls?
- Why hasn't it sold? Are there any deal-killer items the seller is aware of (foundation, flood, title, zoning, code violations)?
- Is there a deadline driving the sale (1031 exchange, divorce, estate, relocation)? That informs how much negotiation room exists.
- Schools are D-rated, which usually means shorter tenancies and higher turnover. Who's the typical renter profile here, and what's been the actual vacancy rate?
- The area grade is low — what's the realistic commute time and amenity access for the typical tenant pool here? Any planned neighborhood developments (good or bad) we should know about?
- What's the average days-on-market for RENTAL listings here right now (not sales)? A rising rental-DOM trend means longer vacancies and softer asking-rent achievability than the comps imply.
- What's the recent tenant-quality profile in this submarket — average credit score on applications, eviction rate, late-payment / NSF rate, and stable-employment percentage? A property-management company in the area should have these aggregated.
- How much new for-sale + rental construction is in the pipeline within 1–3 miles? Heavy new supply typically softens prices + rents 12–24 months out; constrained supply supports both.
Investment metrics
- 1% rule
- 0.64% ✗
- Cap rate
- 3.99%
- Cash-on-cash
- -8.23%
- DSCR
- 0.63
- GRM
- 13.0
CMA / ARV
No comps found within radius.
Projected returns pro-forma
-3.0% appreciation · 3.0% rent growth · sell at horizon
- IRR
- -30.8%
- Equity multiple
- -0.01×
- Total profit
- $-105,108
- Equity at exit
- $55,153
- IRR
- -33.3%
- Equity multiple
- -0.44×
- Total profit
- $-149,550
- Equity at exit
- $31,982
Cash invested: $103,572 (down + closing). Projections, not guarantees.
Landlord ↔ Tenant lean methodology
- Overall (STATE)
- 87 Strongly Landlord-Friendly
- State Texas
- 87 Strongly Landlord-Friendly · R+5
- County
- — inherits STATE
- City
- — inherits STATE
ZIP-level market 76009
- Home prices YoY
- -25.7%
- Active inventory
- 360
- Price-to-rent
- 13.0×
Monthly cashflow live
- Estimated rent
- $2,366 high interval (Pro) →
- Mortgage (P&I)
- −$1,940
- Tax est. 1.5%
- −$462 /mo · $5,548/yr
- Insurance
- −$154
- HOA
- −$23
- Vacancy / Maint / Mgmt
- −$497
- Net cashflow
- $-710
Break-even live
Sensitivity live
| Price | -10% $-454 | -5% $-582 | +0% $-710 | +5% $-838 | +10% $-966 |
|---|---|---|---|---|---|
| Rent | -10% $-897 | -5% $-803 | +0% $-710 | +5% $-617 | +10% $-523 |
| Rate | -1.0pp $-524 | -0.5pp $-616 | base $-710 | +0.5pp $-806 | +1.0pp $-903 |
UW: 25.0% down · 7.5% · 30yr · 1.5% tax · 5.0% vac · 8.0% maint · 8.0% mgmt
Financing live
Cash to close
- Down payment
- $92,475
- Closing costs
- $11,097
- Reserves months
- —
- Total cash needed
- —
Loan-product check · same deal, 3 products live
Conventional
25% down · 7.5% · 30yr
- Down + closing
- —
- Monthly P&I
- —
- Monthly cashflow
- —
- DSCR
- —
- Eligible?
- —
Personal DTI + credit; lowest rate.
DSCR
20% down · 8.5% · 30yr
- Down + closing
- —
- Monthly P&I
- —
- Monthly cashflow
- —
- DSCR
- —
- Eligible?
- —
No personal income docs; deal must DSCR.
Hard money
10% down · 12.0% · 12mo
- Down + closing
- —
- Monthly P&I
- —
- Monthly cashflow
- —
- DSCR
- —
- Eligible?
- —
Short-term bridge; refi at stabilization.
Rent comps 5 comps
| Address | Beds | Baths | Sqft | Rent | $/sqft | DOM | Units | Dist |
|---|---|---|---|---|---|---|---|---|
| 237 Rock Sparrow Ln Alvarado, TX | 3.0 | 2.0 | 1672 | $2,150 | $1.29 | 9d | 1 | 0.11mi |
| 1089 Nighthawk Trl Alvarado, TX | 3.0 | 2.0 | 1672 | $2,056 | $1.23 | 45d | 1 | 0.14mi |
| 1116 Kingbird Ln Alvarado, TX | 5.0 | 3.0 | 2686 | $2,750 | $1.02 | 0d | 1 | 0.20mi |
| 220 Cheyenne Trl Alvarado, TX | 3.0 | 2.0 | 1653 | $2,500 | $1.51 | 23d | 1 | 1.18mi |
| 7128 County Road 319 Alvarado, TX | 3.0 | 2.5 | 3073 | $4,500 | $1.46 | 45d | 1 | 1.49mi |
HOA detail
- Monthly dues
- $23 · $276/yr
- Likely covers
- gas
Listing history 9 events
-
2026-04-20status Pending
-
2026-04-06price $369,900
-
2026-03-09price $374,900
-
2026-02-09price $379,900
-
2026-01-14price $384,900
-
2025-12-18price $390,000
-
2025-11-05price $400,000
-
2025-10-09price $413,990
-
2025-10-08$433,990 Active
ⓘ Source: listings_history table (triggers on properties + properties_extension) + one-shot
backfill from property_details.listing_events for pre-trigger history.
Climate risk First Street
- Flood 1/10 Low FEMA zone X (unshaded) · 0% chance over 30 yrs
- Wildfire 2/10 Low
- Heat 7/10 Severe 7 d/yr ≥110°F today · 25 d/yr by 30 yrs out
- Wind 6/10 Major 27% chance of damaging wind over 30 yrs
- Air quality 2/10 Low 1 unhealthy d/yr today · 2 by 30 yrs out
Nearby sold comps map
Loading sold comps map…
Walkable amenities ~0.75 mi
Loading nearby amenities…
Taxation est. · year 1
- Rental income
- $28,395
- − Mortgage interest
- −$20,720
- − Property taxes
- −$5,548
- − Insurance
- −$1,850
- − Repairs & maintenance
- −$2,272
- − Management
- −$2,272
- − HOA
- −$276
- − Depreciation
- −$10,761
- Taxable loss
- −$15,303
- Est. tax savings @ 24.0%
- +$3,673
- After-tax cash flow
- $-4,847/yr
For passive investors: Depreciation is non-cash, so a rental often shows a tax loss while cash-flowing — sheltering income. Rental losses are passive: they offset passive income freely, and up to $25,000/yr can offset ordinary (W-2) income if you actively participate and your MAGI is under $100k (phasing out to $0 by $150k); unused losses carry forward. On sale, claimed depreciation is recaptured at up to 25%, and gains may owe capital-gains tax (a 1031 exchange can defer both). Figures are a year-1 estimate at your 24.0% rate — not tax advice; consult a CPA.
Schools (NCES district)
- District
- Alvarado ISD
- NCES district ID
- 4800011
- Math proficiency
- 41% ▲ 4.00%
- Reading proficiency
- 37% ▼ -2.00%
- Median HH income
- $53,485
- Composite
- 34.02/100
- National rank
- #5312
- State rank
- #416 of 826 in TX
Livability — Alvarado
- Score
- 73/100
- State rank
- #228
- US rank
- #5544
Category grades
Schools grade is shown separately in the Schools card above.
Census & demographics
- Census place
- Alvarado, TX
- County
- Johnson County · 147,987 people
- City population
- 22,803
- Metro
- Dallas-Fort Worth-Arlington, TX
- Population (ZIP)
- 22,803
- Household income
- $79,755
- Rent vs Own
- Severe rent burden
- 298.0
Population outlook (Johnson County) Hauer SSP2
- Today (2025)
- 179,678 people
- By 2030
- 189,208 · +5.3%
- By 2040
- 207,261 · +15.4%
- By 2050
- 223,064 · +24.1%
- By 2075
- 259,979 · +44.7%
- By 2100
- 275,395 · +53.3%
Race, ethnicity, and origin ACS 2023
- Neighborhood character
- Majority White (56%)
- Race & ethnicity
- White 56% Hispanic / Latino 39% Two or more races 17% Black 3%
- Hispanic origin (detail)
- Mexican 37%
- Common ancestry
- Serbian 1% Romanian 1% Italian 1%
- Foreign-born
- 10% · Canada
- Languages at home
- 73% English-only · Spanish 27%
Political lean MEDSL · Johnson
- 2024 margin
- Solid R (+51.4) · D 23.9% · R 75.3%
- 2008→2024 swing
- -3.9pp toward R · 2008: -47.5pp · 2024: -51.4pp
- All cycles
- 2024: R+51.4 2020: R+53.0 2016: R+58.3 2012: R+55.6 2008: R+47.5
Not yet ingested
- Civics
- —
Market trends
- HPI YoY
- ▼ -86.74%
- Current HPI
- 251.2624
- Rent YoY
- —
- Metro
- Dallas-Fort Worth-Arlington, TX
- State GDP YoY
- ▲ 3.95%
- F500 in state
- 110
Industry mix (Fortune 500 HQ in TX)
| Industry | F500 HQs | Revenue |
|---|---|---|
| Energy | 16 | $1,198B |
|
||
| Technology | 5 | $198B |
|
||
| Engineering / Construction | 4 | $72B |
|
||
| Energy Services | 3 | $60B |
|
||
| Utilities | 3 | $41B |
|
||
| Healthcare | 2 | $330B |
|
||
Price history
-14.8% since first listed9 events — show timeline
- 2026-04-20 Pending — NTREIS
- 2026-04-06 Price Changed $369,900 NTREIS
- 2026-03-09 Price Changed $374,900 NTREIS
- 2026-02-09 Price Changed $379,900 NTREIS
- 2026-01-14 Price Changed $384,900 NTREIS
- 2025-12-18 Price Changed $390,000 NTREIS
- 2025-11-05 Price Changed $400,000 NTREIS
- 2025-10-09 Price Changed $413,990 NTREIS
- 2025-10-08 Listed $433,990 NTREIS
Property tax history
-2.8%/yrLatest (2025): $272 · -3.4% YoY. Source: county tax records.
Cash-flow waterfall
monthlySold comps — $/sqft
last 12 mo · ≤1 miLoading sold comps…