12505 NW 142nd St · Oklahoma City, OK
Flood risk No data
- FEMA flood zone
- —
- Chance of flooding over 30 yrs
- —
- Est. flood insurance / yr
- —
Fire risk No data
- Est. fire insurance / yr
- —
Heat risk No data
- Hot days now (above threshold)
- —
- Hot days in 30 yrs
- —
Wind risk No data
- Chance of severe wind over 30 yrs
- —
Air-quality risk No data
- Unhealthy air days now
- —
- Unhealthy air days in 30 yrs
- —
Risk factors via First Street. Map © Google.
Why this score? — see what drove the D+ grade
The composite is a weighted blend of 9 inputs, each scored 0–100. Each bar is that input's sub-score; the figure is the points it added to the 100-point composite (weight × sub-score).
- Cash flow +13.6/30.0
- ARV discount +10.4/15.0
- Condition / age +4.8/5.0
- DSCR +4.1/10.0
- Livability +4.0/5.0
- 1% rule +3.9/10.0
- Schools +3.6/10.0
- Rent growth +2.5/5.0
- Appreciation +0.0/10.0
$262,000
🖨 Deal sheet (PDF) 📄 Offer letter ✓ Due diligence
Listing remarks
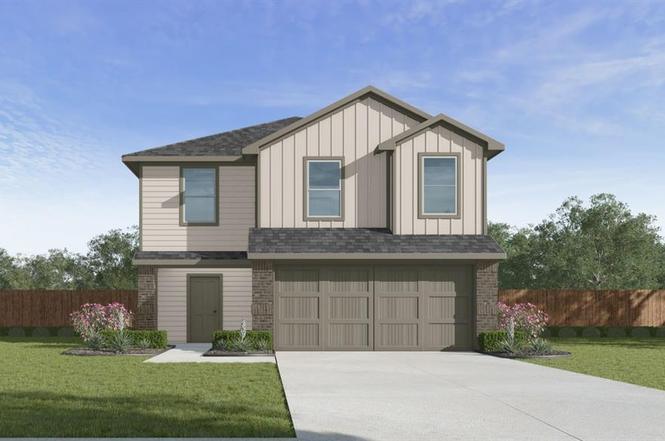
Franklin — 5 bed | 2.5 bath | 2013 sq ft Discover the Franklin plan, one of our new homes in The Brook in Piedmont. With 5 bedrooms, 2.5 bathrooms, and 1892 square feet, this home offers space and comfort. Secondary bedrooms are thoughtfully placed near the entry, leading you into the open-concept living spaces. The kitchenfeatures 30” upper kitchen cabinets, soft-close cabinetry, chrome knob hardware, and stunning white quartz countertops on the front kitchen island, creating a clean, modern finish that elevates the space. At the back, the primary suite provides privacy with an adjoining bath and a generous walk-in closet. This home includes our Home Is Connected® smart ho
Key facts
- Primary suite
- Chrome knob hardware
- Soft-close cabinetry
Tags
Neighborhood map
What this means for you Summary
Snapshot
- This is a 5-bed/2.5-bath single-family listed at $262k. Condition is rated excellent.
Deal economics
- At list price, monthly cash flow is $13 ($159/yr) — positive.
- The deal already cash-flows at list — no discount required.
- To meet the 1% rule (rent ≥ 1% of price), the offer needs to be $234k (10.8% below list).
- Recommended offer: $234k (10.8% below list) — sets the bar for 1% rule.
- Cap rate 6.4% vs local median 3.7% in Oklahoma City — top-decile yield for the area; either an underpriced asset or a hidden risk that comps aren't pricing in. Stress-test before assuming the spread holds.
Location & tenants
- Location reads 80/100 on livability (#3 in OK, #1,635 nationally) — a professional / high-income tenant draw. Strengths: amenities A+, commute A+, cost of living A+; Watch: crime F.
- Piedmont (rural): math 37% / reading 39% proficiency, ranked #9 of 270 in OK (top 3%) — families likely to look elsewhere, expect single-tenant / working-renter base with shorter leases; only 15% free/reduced lunch — higher-income household profile.
- Zoned schools: Northwood Es (math 47% / reading 37%, grade F, #84 of 845 statewide, top 11%, 469 students, 0% FRL); Piedmont Hs (math 38% / reading 44%, grade F, #24 of 447 statewide, top 5%, 1,422 students, 0% FRL).
- Market conditions: 496 active listings in the ZIP; 1 comparable units currently listed for rent nearby; solid renter incomes; 260 units permitted in Canadian County in 2024 (0 in 5+ unit buildings).
Forward outlook
- Local home prices are declining (-3.0%/yr); year-one equity from $2k of loan paydown is wiped out by about $8k of value loss. Plan a longer hold.
- Canadian County population projected at +64% by 2050 — long-run rental-demand tailwind backs the buy-and-hold thesis.
Negotiation context
- It's been on market 45 days — a 3% lower offer ($254k) is reasonable based on typical stale-listing flexibility.
Questions for the listing agent
- It's been on market 45 days. Have you received any prior offers? Is the seller open to a 11% concession, seller financing, or rate buy-down credit?
- What does the HOA fee cover, when was the last increase, and are there any pending special assessments or reserve-fund shortfalls?
- Is there a deadline driving the sale (1031 exchange, divorce, estate, relocation)? That informs how much negotiation room exists.
- Schools are F-rated, which usually means shorter tenancies and higher turnover. Who's the typical renter profile here, and what's been the actual vacancy rate?
- Crime grade is F in this area — have there been break-ins, vandalism, or insurance claims at this property in the last 3 years? What carrier currently insures it and at what premium?
- The area grade is low — what's the realistic commute time and amenity access for the typical tenant pool here? Any planned neighborhood developments (good or bad) we should know about?
- What's the average days-on-market for RENTAL listings here right now (not sales)? A rising rental-DOM trend means longer vacancies and softer asking-rent achievability than the comps imply.
- What's the recent tenant-quality profile in this submarket — average credit score on applications, eviction rate, late-payment / NSF rate, and stable-employment percentage? A property-management company in the area should have these aggregated.
- How much new for-sale + rental construction is in the pipeline within 1–3 miles? Heavy new supply typically softens prices + rents 12–24 months out; constrained supply supports both.
Investment metrics
- 1% rule
- 0.89% ✗
- Cap rate
- 6.35%
- Cash-on-cash
- 0.22%
- DSCR
- 1.01
- GRM
- 9.3
CMA / ARV
- ARV (on-the-fly)
- $280,016
- Comps found
- 12
Show comp detail 12 sales within ~0.75 mi
| Address | Dist | Beds/Ba | Sqft | Sold | Price | $/sf | Match |
|---|---|---|---|---|---|---|---|
| 14212 S Babbling Brook Dr | 0.22mi | 5/2.0 | 1,959 (+4%) | 2mo | $285,000 | $145 | 81 |
| 14204 Little Falls Ln | 0.13mi | 4/2.0 (-1) | 1,833 (-3%) | 2mo | $269,990 | $147 | 80 |
| 12549 NW 142nd St | 0.12mi | 4/2.0 (-1) | 1,833 (-3%) | 4mo | $287,000 | $157 | 79 |
| 14209 Little Falls Ln | 0.14mi | 4/2.5 (-1) | 1,822 (-4%) | 5mo | $269,990 | $148 | 78 |
| 12525 NW 142nd St | 0.07mi | 4/2.0 (-1) | 1,796 (-5%) | 4mo | $262,990 | $146 | 78 |
| 14217 Little Falls Ln | 0.13mi | 4/2.0 (-1) | 1,833 (-3%) | 5mo | $269,990 | $147 | 78 |
| 14117 S Babbling Brook Dr | 0.21mi | 4/2.0 (-1) | 1,822 (-4%) | 3mo | $215,000 | $118 | 75 |
| 14248 Babbling Brook Dr | 0.20mi | 4/2.0 (-1) | 1,786 (-6%) | 2mo | $265,000 | $148 | 73 |
| 12541 NW 142nd St | 0.15mi | 4/2.0 (-1) | 2,031 (+7%) | 3mo | $299,000 | $147 | 71 |
| 14409 Center Village Way | 0.46mi | 4/2.0 (-1) | 1,967 (+4%) | 1mo | $359,900 | $183 | 64 |
| 14312 Village Trl | 0.52mi | 4/2.0 (-1) | 1,967 (+4%) | 2mo | $372,900 | $190 | 61 |
| 14308 Village Trl | 0.52mi | 4/2.0 (-1) | 2,028 (+7%) | 4mo | $369,900 | $182 | 53 |
Match score weights: distance 35% · size 25% · config 20% · recency 20%. Top-matched comps best support the ARV.
Projected returns pro-forma
-3.0% appreciation · 3.0% rent growth · sell at horizon
- IRR
- -15.9%
- Equity multiple
- 0.43×
- Total profit
- $-41,562
- Equity at exit
- $39,065
- IRR
- -7.5%
- Equity multiple
- 0.52×
- Total profit
- $-34,904
- Equity at exit
- $22,653
Cash invested: $73,360 (down + closing). Projections, not guarantees.
Landlord ↔ Tenant lean methodology
- Overall (STATE)
- 83 Strongly Landlord-Friendly
- State Oklahoma
- 83 Strongly Landlord-Friendly · R+20
- County
- — inherits STATE
- City
- — inherits STATE
ZIP-level market 73078
- Home prices YoY
- -14.2%
- Active inventory
- 496
- Price-to-rent
- 9.3×
Monthly cashflow live
- Estimated rent
- $2,338 medium interval (Pro) →
- Mortgage (P&I)
- −$1,374
- Tax est. 1.5%
- −$328 /mo · $3,930/yr
- Insurance
- −$109
- HOA
- −$23
- Vacancy / Maint / Mgmt
- −$491
- Net cashflow
- $13
Break-even live
Sensitivity live
| Price | -10% $194 | -5% $104 | +0% $13 | +5% $-77 | +10% $-168 |
|---|---|---|---|---|---|
| Rent | -10% $-171 | -5% $-79 | +0% $13 | +5% $106 | +10% $198 |
| Rate | -1.0pp $145 | -0.5pp $80 | base $13 | +0.5pp $-55 | +1.0pp $-124 |
UW: 25.0% down · 7.5% · 30yr · 1.5% tax · 5.0% vac · 8.0% maint · 8.0% mgmt
Financing live
Cash to close
- Down payment
- $65,500
- Closing costs
- $7,860
- Reserves months
- —
- Total cash needed
- —
Loan-product check · same deal, 3 products live
Conventional
25% down · 7.5% · 30yr
- Down + closing
- —
- Monthly P&I
- —
- Monthly cashflow
- —
- DSCR
- —
- Eligible?
- —
Personal DTI + credit; lowest rate.
DSCR
20% down · 8.5% · 30yr
- Down + closing
- —
- Monthly P&I
- —
- Monthly cashflow
- —
- DSCR
- —
- Eligible?
- —
No personal income docs; deal must DSCR.
Hard money
10% down · 12.0% · 12mo
- Down + closing
- —
- Monthly P&I
- —
- Monthly cashflow
- —
- DSCR
- —
- Eligible?
- —
Short-term bridge; refi at stabilization.
Rent comps 1 comps
| Address | Beds | Baths | Sqft | Rent | $/sqft | DOM | Units | Dist |
|---|---|---|---|---|---|---|---|---|
| 11520 NW 134th Ter Oklahoma City, OK | 4.0 | 3.0 | 2300 | $2,695 | $1.17 | 3d | 1 | 1.39mi |
HOA detail
- Monthly dues
- $23 · $276/yr
Listing history 3 events
-
2026-04-13status Pending
-
2026-04-09price $262,000
-
2026-02-27$267,990 Active
ⓘ Source: listings_history table (triggers on properties + properties_extension) + one-shot
backfill from property_details.listing_events for pre-trigger history.
Nearby sold comps map
Loading sold comps map…
Walkable amenities ~0.75 mi
Loading nearby amenities…
Taxation est. · year 1
- Rental income
- $28,054
- − Mortgage interest
- −$14,676
- − Property taxes
- −$3,930
- − Insurance
- −$1,310
- − Repairs & maintenance
- −$2,244
- − Management
- −$2,244
- − HOA
- −$276
- − Depreciation
- −$7,622
- Taxable loss
- −$4,249
- Est. tax savings @ 24.0%
- +$1,020
- After-tax cash flow
- $1,179/yr
For passive investors: Depreciation is non-cash, so a rental often shows a tax loss while cash-flowing — sheltering income. Rental losses are passive: they offset passive income freely, and up to $25,000/yr can offset ordinary (W-2) income if you actively participate and your MAGI is under $100k (phasing out to $0 by $150k); unused losses carry forward. On sale, claimed depreciation is recaptured at up to 25%, and gains may owe capital-gains tax (a 1031 exchange can defer both). Figures are a year-1 estimate at your 24.0% rate — not tax advice; consult a CPA.
Condition & rehab AI · 13 photos
This home is in excellent condition with no visible repairs needed. It offers a great opportunity for a potential buyer or renter looking for a move-in ready property.
Value-add opportunities
- Both Paint exterior siding — Enhances curb appeal and resale value
- Both Replace carpet with hardwood flooring — Improves aesthetics and increases rental value
- Both Install smart home features — Enhances convenience and marketability
Renovation cost estimate screening
Value-add ROI direction
- Both Paint exterior siding — Enhances curb appeal and resale value ↑
- Both Replace carpet with hardwood flooring — Improves aesthetics and increases rental value ↑
- Both Install smart home features — Enhances convenience and marketability ↑
ⓘ Cost ranges are severity-bucket heuristics (US national rule-of-thumb). Get contractor quotes + a written scope before underwriting a rehab budget.
Schools (NCES district)
- District
- Piedmont
- NCES district ID
- 4023970
- Math proficiency
- 37% ▼ -15.00%
- Reading proficiency
- 39% ▼ -9.00%
- Median HH income
- $83,943
- Composite
- 36.08/100
- National rank
- #4762
- State rank
- #9 of 270 in OK
Livability — Oklahoma City
- Score
- 80/100
- State rank
- #3
- US rank
- #1635
Category grades
Schools grade is shown separately in the Schools card above.
Census & demographics
- Census place
- Oklahoma City, OK
- County
- Canadian County · 154,341 people
- City population
- 498,656
- Metro
- Oklahoma City, OK
- Population (ZIP)
- 13,021
- Household income
- $105,441
- Rent vs Own
- Severe rent burden
- 48.0
Population outlook (Canadian County) Hauer SSP2
- Today (2025)
- 174,062 people
- By 2030
- 195,170 · +12.1%
- By 2040
- 239,293 · +37.5%
- By 2050
- 285,457 · +64.0%
- By 2075
- 403,766 · +132.0%
- By 2100
- 498,766 · +186.5%
Race, ethnicity, and origin ACS 2023
- Neighborhood character
- Predominantly White (77%)
- Race & ethnicity
- White 77% Two or more races 11% Hispanic / Latino 10% Black 3% Asian 3% Native American 1%
- Hispanic origin (detail)
- Mexican 8%
- Common ancestry
- Slovak 4% Iranian 3% Serbian 1%
- Foreign-born
- 4% · Canada, Vietnam
- Languages at home
- 93% English-only · Spanish 5%
Political lean MEDSL · Canadian
- 2024 margin
- Solid R (+40.4) · D 28.8% · R 69.2% · Other 2.0%
- 2008→2024 swing
- +11.9pp toward D · 2008: -52.2pp · 2024: -40.4pp
- All cycles
- 2024: R+40.4 2020: R+43.3 2016: R+51.2 2012: R+54.4 2008: R+52.2
Not yet ingested
- Civics
- —
Market trends
- HPI YoY
- ▼ -43.50%
- Current HPI
- 262.6535
- Rent YoY
- —
- Metro
- Oklahoma City, OK
- State GDP YoY
- ▲ 1.55%
- F500 in state
- 6
Industry mix (Fortune 500 HQ in OK)
| Industry | F500 HQs | Revenue |
|---|---|---|
| Energy | 3 | $48B |
|
||
Price history
-2.2% since first listed3 events — show timeline
- 2026-04-13 Pending — MLSOK
- 2026-04-09 Price Changed $262,000 MLSOK
- 2026-02-27 Listed $267,990 MLSOK
Cash-flow waterfall
monthlySold comps — $/sqft
last 12 mo · ≤1 miLoading sold comps…