8993 River Rd · Lancaster, VA
Flood risk 1/10 · Minimal
- FEMA flood zone
- X (unshaded)
- Chance of flooding over 30 yrs
- 0.0%
- Est. flood insurance / yr
- $507 – $1,088
Fire risk 4/10 · Minor
- Est. fire insurance / yr
- $666 – $1,236
Heat risk 9/10 · Severe
- Hot days now (above 105°F)
- 7 days/yr
- Hot days in 30 yrs
- 17 days/yr
Wind risk 6/10 · Moderate
- Chance of severe wind over 30 yrs
- 70.0%
Air-quality risk 1/10 · Minimal
- Unhealthy air days now
- 0 days/yr
- Unhealthy air days in 30 yrs
- 0 days/yr
Risk factors via First Street. Map © Google.
Why this score? — see what drove the D grade
The composite is a weighted blend of 9 inputs, each scored 0–100. Each bar is that input's sub-score; the figure is the points it added to the 100-point composite (weight × sub-score).
- ARV discount +15.0/15.0
- Cash flow +10.5/30.0
- Schools +3.3/10.0
- DSCR +3.0/10.0
- Livability +2.9/5.0
- Rent growth +2.5/5.0
- Condition / age +2.5/5.0
- 1% rule +2.0/10.0
- Appreciation +0.0/10.0
$235,000
🖨 Deal sheet (PDF) 📄 Offer letter ✓ Due diligence
Listing remarks MLS
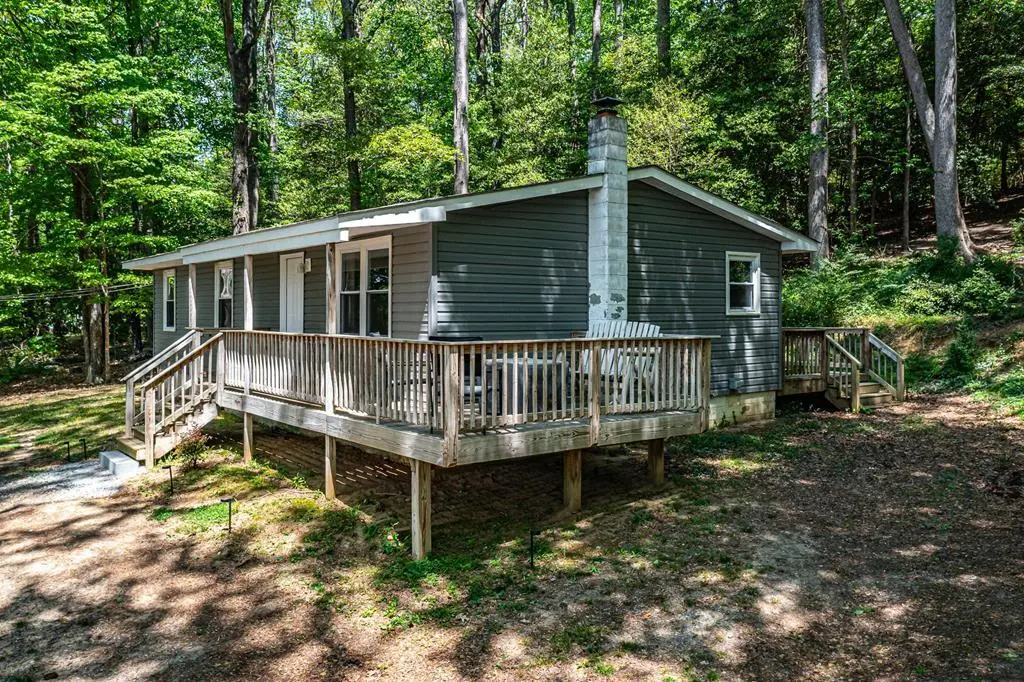
Fantastic 3 bedroom 2 bathroom ranch house that is part of Heritage Point Neighborhood. Renovated and updated in 2020. You will have access to the neighborhood amenities, beach, pool, clubhouse, tennis courts, boat ramp and dock.
Key facts
- 1.25 acre lot
- Community pool
- Built 1979
Property features AI
Finance
- HOA & community: Homeowners association with annual fee (clubhouse and pool access); Community features include pool, clubhouse, playground, and tennis courts
Exterior
- Parking: Circular driveway; Driveway (unpaved)
- Utilities: Shared well water; Septic tank sewer
- Home design: Single family residence; One story; One level; Frame construction with vinyl siding
- Construction: Composition roof
- Exterior features: Deck; Front porch; Side porch; Sliding doors; Has view; Community pool available
Interior
- Kitchen: Microwave; Refrigerator; Electric water heater
- Flooring: Vinyl
- Bathrooms: 2 full bathrooms
- Heating & cooling: Heat pump heating; Electric heating; Heat pump cooling; Electric cooling; Ceiling fan(s) for cooling
- Interior features: Built-in bookcases; Built-in features; Ceiling fans; Double vanity; Walk-in closet(s); 5 total rooms
- Laundry & utility: Washer; Dryer; Washer hookup
Neighborhood map
What this means for you Summary
Snapshot
- This is a 4-bed/1.5-bath single-family listed at $235k.
Deal economics
- At list price, monthly cash flow is $-121 ($-1k/yr) — negative.
- To cash-flow at today's rent, offer at most $214k (9.1% below list).
- To meet the 1% rule (rent ≥ 1% of price), the offer needs to be $166k (29.6% below list).
- Recommended offer: $166k (29.6% below list) — sets the bar for 1% rule.
- Cap rate 5.7% vs local median 1.3% in Lancaster — top-decile yield for the area; either an underpriced asset or a hidden risk that comps aren't pricing in. Stress-test before assuming the spread holds.
Location & tenants
- Location reads 58/100 on livability (#489 in VA) — a working-class tenant base; expect higher turnover. Strengths: health & safety A+, crime A, cost of living A; Watch: amenities F, commute F, employment F.
- Lancaster County Public School District (rural): math 27% / reading 49% proficiency, ranked #125 of 131 in VA (top 95%) — families likely to look elsewhere, expect single-tenant / working-renter base with shorter leases; 64% free/reduced lunch — lower-income household profile, screen leases tightly.
- Zoned schools: Lancaster Primary (math 27% / reading 37%, grade F, #992 of 1,108 statewide, top 90%, 316 students, 127% FRL); Lancaster Middle (math 22% / reading 47%, grade F, #328 of 342 statewide, top 96%, 237 students, 99% FRL); Lancaster High (math 37% / reading 57%, grade D-, #305 of 319 statewide, top 97%, 403 students, 100% FRL) — zoned schools average 109% FRL vs 64% district-wide (45 pts higher); higher-poverty schools than district average — tighter screening recommended.
- Market conditions: 117 active listings in the ZIP; 127 units permitted in Lancaster County in 2024 (0 in 5+ unit buildings).
Forward outlook
- Local home prices are declining (-3.0%/yr); year-one equity from $2k of loan paydown is wiped out by about $7k of value loss. Plan a longer hold.
- Lancaster County population projected at -34% by 2050 — secular population decline; favor cash flow + early exit over multi-decade hold.
Negotiation context
- It's been on market 57 days — a 3% lower offer ($228k) is reasonable based on typical stale-listing flexibility.
- 3 sale attempts since 6y ago with the ask held roughly flat each time — persistent listings suggest the price (not the market) is what's stuck; bring a comps-based counter.
- Current owner paid $130k; list at $235k implies a 81% gain — meaningful room to come down on a strong offer.
Risks & watch-outs
- Climate carrying-cost: major wind risk, 70% chance of damaging wind over 30y; extreme-heat days projected 7→17/yr by 2055 (HVAC capex compounding) — expect insurance premiums to compound above CPI over the hold.
Questions for the listing agent
- What do current leases actually rent for vs. the listed asking? Can we see a recent rent roll and the last 12 months of T-12 income?
- It's been on market 57 days. Have you received any prior offers? Is the seller open to a 30% concession, seller financing, or rate buy-down credit?
- Built in 1979 — when were the roof, HVAC, electrical panel, plumbing, and water heater last replaced?
- What does the HOA fee cover, when was the last increase, and are there any pending special assessments or reserve-fund shortfalls?
- Is there a deadline driving the sale (1031 exchange, divorce, estate, relocation)? That informs how much negotiation room exists.
- Schools are B-rated — typically a magnet for longer-tenancy family renters. What's the average tenant stay here, and is there a school-zone premium baked into asking?
- The area grade is low — what's the realistic commute time and amenity access for the typical tenant pool here? Any planned neighborhood developments (good or bad) we should know about?
- What's the average days-on-market for RENTAL listings here right now (not sales)? A rising rental-DOM trend means longer vacancies and softer asking-rent achievability than the comps imply.
- What's the recent tenant-quality profile in this submarket — average credit score on applications, eviction rate, late-payment / NSF rate, and stable-employment percentage? A property-management company in the area should have these aggregated.
- How much new for-sale + rental construction is in the pipeline within 1–3 miles? Heavy new supply typically softens prices + rents 12–24 months out; constrained supply supports both.
Investment metrics
- 1% rule
- 0.70% ✗
- Cap rate
- 5.68%
- Cash-on-cash
- -2.20%
- DSCR
- 0.90
- GRM
- 11.8
CMA / ARV
- ARV (median comp)
- $302,304
- List price
- $235,000
- Delta
- -22.26%
- Verdict
- UNDERPRICED
- Comps
- 2 within 1.0 mi
Projected returns pro-forma
-3.0% appreciation · 3.0% rent growth · sell at horizon
- IRR
- -20.0%
- Equity multiple
- 0.30×
- Total profit
- $-45,872
- Equity at exit
- $35,039
- IRR
- -13.1%
- Equity multiple
- 0.24×
- Total profit
- $-50,241
- Equity at exit
- $20,319
Cash invested: $65,800 (down + closing). Projections, not guarantees.
Landlord ↔ Tenant lean methodology
- Overall (STATE)
- 55 Moderately Landlord-Leaning
- State Virginia
- 55 Moderately Landlord-Leaning · D+2
- County
- — inherits STATE
- City
- — inherits STATE
ZIP-level market 22503
- Home prices YoY
- -6.7%
- Active inventory
- 117
- Price-to-rent
- 11.8×
Monthly cashflow live
- Estimated rent
- $1,655 medium interval (Pro) →
- Mortgage (P&I)
- −$1,232
- Tax from tax record
- −$63 /mo · $756/yr
- Insurance
- −$98
- HOA
- −$35
- Vacancy / Maint / Mgmt
- −$348
- Net cashflow
- $-121
Break-even live
Sensitivity live
| Price | -10% $12 | -5% $-54 | +0% $-121 | +5% $-187 | +10% $-254 |
|---|---|---|---|---|---|
| Rent | -10% $-252 | -5% $-186 | +0% $-121 | +5% $-55 | +10% $10 |
| Rate | -1.0pp $-2 | -0.5pp $-61 | base $-121 | +0.5pp $-182 | +1.0pp $-244 |
UW: 25.0% down · 7.5% · 30yr · 1.5% tax · 5.0% vac · 8.0% maint · 8.0% mgmt
Financing live
Cash to close
- Down payment
- $58,750
- Closing costs
- $7,050
- Reserves months
- —
- Total cash needed
- —
Loan-product check · same deal, 3 products live
Conventional
25% down · 7.5% · 30yr
- Down + closing
- —
- Monthly P&I
- —
- Monthly cashflow
- —
- DSCR
- —
- Eligible?
- —
Personal DTI + credit; lowest rate.
DSCR
20% down · 8.5% · 30yr
- Down + closing
- —
- Monthly P&I
- —
- Monthly cashflow
- —
- DSCR
- —
- Eligible?
- —
No personal income docs; deal must DSCR.
Hard money
10% down · 12.0% · 12mo
- Down + closing
- —
- Monthly P&I
- —
- Monthly cashflow
- —
- DSCR
- —
- Eligible?
- —
Short-term bridge; refi at stabilization.
HOA detail
- Monthly dues
- $35 · $420/yr
- Likely covers
- pool
Listing history 24 events
-
2026-06-21days on market $235,000 Active 57 DOM
-
2026-06-21days on market $235,000 Active 56 DOM
-
2026-06-18days on market $235,000 Active 54 DOM
-
2026-06-17days on market $235,000 Active 53 DOM
-
2026-06-17price $235,000 Active 52 DOM
-
2026-06-16days on market $240,000 Active 52 DOM
-
2026-06-15days on market $240,000 Active 51 DOM
-
2026-06-15days on market $240,000 Active 50 DOM
-
2026-06-13days on market $240,000 Active 49 DOM
-
2026-06-12days on market $240,000 Active 48 DOM
-
2026-06-09days on market $240,000 Active 45 DOM
-
2026-06-08days on market $240,000 Active 44 DOM
-
2026-06-08days on market $240,000 Active 43 DOM
-
2026-06-05days on market $240,000 Active 41 DOM
-
2026-06-03days on market $240,000 Active 39 DOM
-
2026-06-02days on market $240,000 Active 38 DOM
-
2026-06-01days on market $240,000 Active 37 DOM
-
2026-05-31days on market $240,000 Active 36 DOM
-
2026-04-24$240,000 Active 229-char remark
Show marketing remark (229 chars)
Fantastic 3 bedroom 2 bathroom ranch house that is part of Heritage Point Neighborhood. Renovated and updated in 2020. You will have access to the neighborhood amenities, beach, pool, clubhouse, tennis courts, boat ramp and dock.
-
2026-04-24$240,000 Active 253-char remark
Show marketing remark (229 chars)
Fantastic 3 bedroom 2 bathroom ranch house that is part of Heritage Point Neighborhood. Renovated and updated in 2020. You will have access to the neighborhood amenities, beach, pool, clubhouse, tennis courts, boat ramp and dock.
-
2020-12-18soldstatus $129,900
Show marketing remark (338 chars)
Home has been 100% remodeled. Three bedrooms and two baths. Master has it's own bath. All new kitchen and appliances. New HVAC. Large deck off front and another off the back. Home is sitting off the rod on over n acre of wooded land. Enjoy all the benefits of Heritage Point subdivision. Boat ramp, Beach, tennis and pool with club house.
-
2020-10-04$129,900
Show marketing remark (338 chars)
Home has been 100% remodeled. Three bedrooms and two baths. Master has it's own bath. All new kitchen and appliances. New HVAC. Large deck off front and another off the back. Home is sitting off the rod on over n acre of wooded land. Enjoy all the benefits of Heritage Point subdivision. Boat ramp, Beach, tennis and pool with club house.
-
2020-01-27soldstatus $15,000
ⓘ Source: listings_history table (triggers on properties + properties_extension) + one-shot
backfill from property_details.listing_events for pre-trigger history.
Tax reassessment forecast VA · Resets to sale price
- Current annual tax
- $756 · $63/mo
- Projected year-2 tax
- $1,927 · $161/mo
- Expected delta
- +$1,171/yr (+$98/mo · 154.8%)
ⓘ Screening estimate from a state-policy table — verify with the county assessor before closing.
Climate risk First Street
- Flood 1/10 Low FEMA zone X (unshaded) · 0% chance over 30 yrs
- Wildfire 4/10 Moderate
- Heat 9/10 Extreme 7 d/yr ≥105°F today · 17 d/yr by 30 yrs out
- Wind 6/10 Major 70% chance of damaging wind over 30 yrs
- Air quality 1/10 Low 0 unhealthy d/yr today · 0 by 30 yrs out
Nearby sold comps map
Loading sold comps map…
Walkable amenities ~0.75 mi
Loading nearby amenities…
Taxation est. · year 1
- Rental income
- $19,860
- − Mortgage interest
- −$13,164
- − Property taxes
- −$756
- − Insurance
- −$1,175
- − Repairs & maintenance
- −$1,589
- − Management
- −$1,589
- − HOA
- −$420
- − Depreciation
- −$6,836
- Taxable loss
- −$5,669
- Est. tax savings @ 24.0%
- +$1,360
- After-tax cash flow
- $-90/yr
For passive investors: Depreciation is non-cash, so a rental often shows a tax loss while cash-flowing — sheltering income. Rental losses are passive: they offset passive income freely, and up to $25,000/yr can offset ordinary (W-2) income if you actively participate and your MAGI is under $100k (phasing out to $0 by $150k); unused losses carry forward. On sale, claimed depreciation is recaptured at up to 25%, and gains may owe capital-gains tax (a 1031 exchange can defer both). Figures are a year-1 estimate at your 24.0% rate — not tax advice; consult a CPA.
Schools (NCES district)
- District
- Lancaster County Public School District
- NCES district ID
- 5102160
- Math proficiency
- 27% ▼ -44.00%
- Reading proficiency
- 49% ▼ -20.00%
- Median HH income
- $48,210
- Composite
- 32.58/100
- National rank
- #5680
- State rank
- #125 of 131 in VA
Livability — Lancaster
- Score
- 58/100
- State rank
- #489
- US rank
- #21544
Category grades
Schools grade is shown separately in the Schools card above.
Census & demographics
- Population (ZIP)
- 4,046
Population outlook (Lancaster County) Hauer SSP2
- Today (2025)
- 9,870 people
- By 2030
- 9,172 · -7.1%
- By 2040
- 7,719 · -21.8%
- By 2050
- 6,551 · -33.6%
- By 2075
- 5,110 · -48.2%
- By 2100
- 3,884 · -60.6%
Race, ethnicity, and origin ACS 2023
- Neighborhood character
- Majority White (59%)
- Race & ethnicity
- White 59% Black 35% Two or more races 3% Hispanic / Latino 2%
- Common ancestry
- Italian 2% Lithuanian 1% Slovak 1%
- Foreign-born
- 3% · Canada, China, Jamaica
- Languages at home
- 97% English-only · Spanish 1% Chinese 1%
Political lean MEDSL · Lancaster
- 2024 margin
- Lean R (+7.0) · D 46.1% · R 53.1%
- 2008→2024 swing
- -1.1pp toward R · 2008: -5.9pp · 2024: -7.0pp
- All cycles
- 2024: R+7.0 2020: R+4.6 2016: R+10.0 2012: R+8.6 2008: R+5.9
Not yet ingested
- Civics
- —
Market trends
- HPI YoY
- ▼ -19.39%
- Current HPI
- 271.6442
- Rent YoY
- —
- Metro
- —
- State GDP YoY
- ▲ 2.40%
- F500 in state
- 50
Industry mix (Fortune 500 HQ in VA)
| Industry | F500 HQs | Revenue |
|---|---|---|
| Aerospace / Defense | 4 | $236B |
|
||
| Technology / Defense | 3 | $32B |
|
||
| Financial Services | 2 | $176B |
|
||
| Utilities | 2 | $27B |
|
||
| Insurance | 2 | $25B |
|
||
| Technology | 2 | $15B |
|
||
Price history
+1466.7% since first listed8 events — show timeline
- 2026-06-10 Price Changed $235,000 CBRAR
- 2026-06-10 Price Changed $235,000 NNAR
- 2026-04-24 Listed $240,000 NNAR
- 2026-04-24 Listed $240,000 CBRAR
- 2020-12-18 Sold (Public Records) $129,900 Public Records
- 2020-12-18 Sold (MLS) $129,900 NNAR
- 2020-10-04 Listed $129,900 NNAR
- 2020-01-27 Sold (Public Records) $15,000 Public Records
Property tax history
+6.9%/yrLatest (2025): $756 · +0.0% YoY. Source: county tax records.
Cash-flow waterfall
monthlySold comps — $/sqft
last 12 mo · ≤1 miLoading sold comps…