8517 Hearth Dr #36 · Houston, TX
Flood risk 8/10 · Major
- FEMA flood zone
- X (unshaded)
- Chance of flooding over 30 yrs
- 0.99%
- Est. flood insurance / yr
- $507 – $1,088
Fire risk 1/10 · Minimal
- Est. fire insurance / yr
- $1,222 – $2,270
Heat risk 9/10 · Severe
- Hot days now (above 109°F)
- 7 days/yr
- Hot days in 30 yrs
- 25 days/yr
Wind risk 9/10 · Severe
- Chance of severe wind over 30 yrs
- 99.0%
Air-quality risk 2/10 · Minimal
- Unhealthy air days now
- 2 days/yr
- Unhealthy air days in 30 yrs
- 2 days/yr
Risk factors via First Street. Map © Google.
Why this score? — see what drove the D- grade
The composite is a weighted blend of 9 inputs, each scored 0–100. Each bar is that input's sub-score; the figure is the points it added to the 100-point composite (weight × sub-score).
- 1% rule +10.0/10.0
- ARV discount +7.5/15.0
- Cash flow +6.1/30.0
- Livability +3.7/5.0
- Appreciation +2.7/10.0
- Schools +2.7/10.0
- Condition / age +2.5/5.0
- Rent growth +1.8/5.0
- DSCR +0.4/10.0
$79,000
🖨 Deal sheet (PDF) 📄 Offer letter ✓ Due diligence
Listing remarks
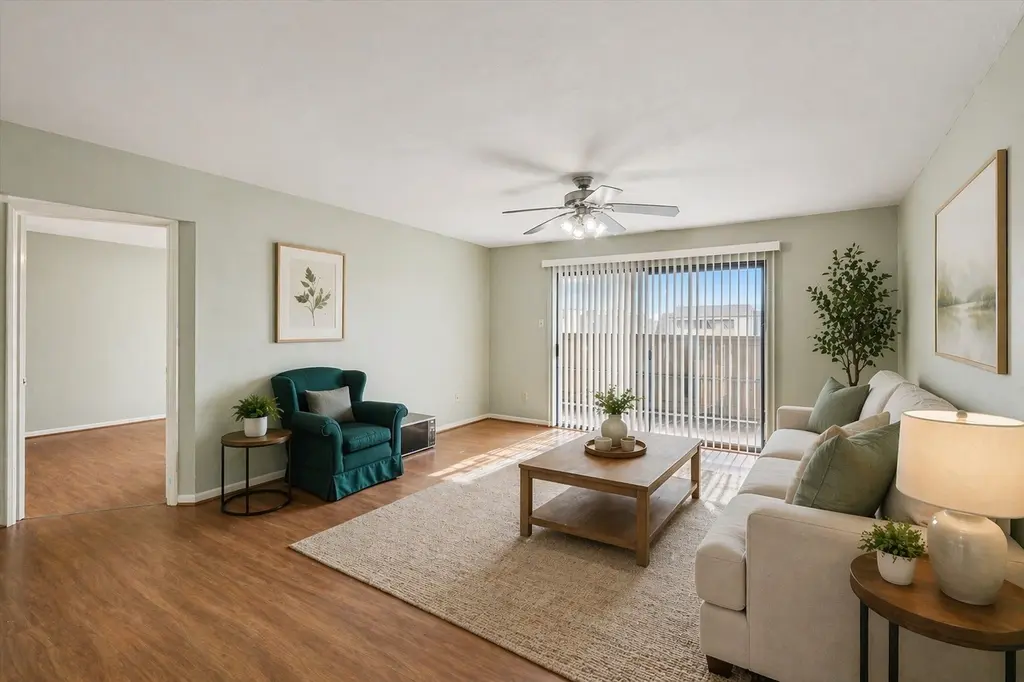
Completely remodeled 2 bedroom with 2 full bathrooms. Utility room inside. New appliances. Very desirable location close to Medical Center, NRG Stadium. The posibilities on this unit are endless and can make a good investment.
Key facts
- Remodeled
- Utility room
- Desirable location
Tags
Property features AI
Finance
- HOA & community: Monthly association fee; Association amenities include guard and community pool; Association fee covers insurance, grounds and structure maintenance, sewer, trash, and water
Exterior
- Parking: Garage; Carport
- Security: Gated/guarded community
- Utilities: Public water
- Home design: Residential property; Single-story; Full ownership; Slab foundation
- Construction: Stone and stucco exterior; Composition roof; Built in 1979
- Exterior features: Storage
Interior
- Kitchen: Electric cooktop; Oven; Refrigerator
- Bedrooms: Primary bedroom (third level); Bedroom (third level)
- Flooring: Plank flooring; Vinyl flooring
- Bathrooms: 2 full bathrooms
- Heating & cooling: Central heating (electric); Central air conditioning (electric)
- Interior features: Elevator; Kitchen/family room combo; Tub with shower; Window treatments / coverings
- Laundry & utility: Laundry in utility room; Electric dryer hookup
Neighborhood map
What this means for you Summary
Snapshot
- This is a 2-bed/2.0-bath condo listed at $79k.
Deal economics
- At list price, monthly cash flow is $-215 ($-3k/yr) — negative.
- To cash-flow at today's rent, offer at most $48k (39.4% below list).
- Meets the 1% rule at list price ($1k rent vs $79k).
- Recommended offer: $48k (39.4% below list) — sets the bar for cash-flow.
- Cap rate 4.0% vs local median 3.2% in Houston — meaningfully above typical; check what's discounted (condition, days-on-market, listing class) to confirm the premium yield is real.
Location & tenants
- Location reads 74/100 on livability (#184 in TX, #4,771 nationally) — a middle-class / working-renter tenant base. Strengths: amenities A+, cost of living A+, housing A+; Watch: crime F.
- Houston ISD (urban): math 27% / reading 35% proficiency, ranked #593 of 826 in TX (top 72%) — families likely to look elsewhere, expect single-tenant / working-renter base with shorter leases; 71% free/reduced lunch — lower-income household profile, screen leases tightly.
- Zoned schools: Longfellow El (math 12% / reading 27%, grade F, #3,583 of 4,322 statewide, top 86%, 682 students, 75% FRL); Pershing Middle (math 36% / reading 49%, grade D-, #553 of 1,662 statewide, top 34%, 1,390 students, 60% FRL); Bellaire H S (math 45% / reading 62%, grade C-, #428 of 1,632 statewide, top 27%, 3,170 students, 48% FRL).
- Market conditions: Rents soft (-2.8%/yr); 272 active listings in the ZIP; 40 comparable units currently listed for rent nearby; rentals leasing fast (median 14d on market — plan ~1-2 weeks tenant-placement turnaround); 29,883 units permitted in Harris County in 2024 (8,621 in 5+ unit buildings).
Forward outlook
- Local home prices are declining (-3.0%/yr); year-one equity from $546 of loan paydown is wiped out by about $2k of value loss. Plan a longer hold.
- Harris County population projected at +47% by 2050 — long-run rental-demand tailwind backs the buy-and-hold thesis.
Negotiation context
- It's been on market 61 days — a 6% lower offer ($74k) is reasonable based on typical stale-listing flexibility.
- 4 sale attempts since 20y ago; this cycle's ask is 5583% above the opening price — seller raised mid-cycle; expect resistance to lowballs.
Risks & watch-outs
- Watch-outs: flood insurance adds $66/mo; HOA is 47% of rent.
- Climate carrying-cost: severe flood risk; severe wind risk, 99% chance of damaging wind over 30y; extreme-heat days projected 7→25/yr by 2055 (HVAC capex compounding) — expect insurance premiums to compound above CPI over the hold.
Questions for the listing agent
- What do current leases actually rent for vs. the listed asking? Can we see a recent rent roll and the last 12 months of T-12 income?
- It's been on market 61 days. Have you received any prior offers? Is the seller open to a 39% concession, seller financing, or rate buy-down credit?
- Built in 1979 — when were the roof, HVAC, electrical panel, plumbing, and water heater last replaced?
- What's the actual annual flood-insurance premium (NFIP or private), and is the property in a SFHA with mandatory coverage?
- What does the HOA fee cover, when was the last increase, and are there any pending special assessments or reserve-fund shortfalls?
- Any open or pending special assessments — roof, HVAC, plumbing, elevator, façade? What's the per-unit balance and payoff schedule, and is the seller paying it off at close or rolling it to the buyer?
- Why hasn't it sold? Are there any deal-killer items the seller is aware of (foundation, flood, title, zoning, code violations)?
- Is there a deadline driving the sale (1031 exchange, divorce, estate, relocation)? That informs how much negotiation room exists.
- Schools are D-rated, which usually means shorter tenancies and higher turnover. Who's the typical renter profile here, and what's been the actual vacancy rate?
- Crime grade is F in this area — have there been break-ins, vandalism, or insurance claims at this property in the last 3 years? What carrier currently insures it and at what premium?
- The area grade is low — what's the realistic commute time and amenity access for the typical tenant pool here? Any planned neighborhood developments (good or bad) we should know about?
- What's the average days-on-market for RENTAL listings here right now (not sales)? A rising rental-DOM trend means longer vacancies and softer asking-rent achievability than the comps imply.
- What's the recent tenant-quality profile in this submarket — average credit score on applications, eviction rate, late-payment / NSF rate, and stable-employment percentage? A property-management company in the area should have these aggregated.
- How much new apartment / multifamily construction is in the pipeline within 1–3 miles? Heavy new supply (>2% of stock underway) typically softens rents 12–24 months out; light construction supports rent growth.
Investment metrics
- 1% rule
- 1.57% ✓
- Cap rate
- 4.04%
- Cash-on-cash
- -8.05%
- DSCR
- 0.64
- GRM
- 5.3
CMA / ARV
No comps found within radius.
Projected returns pro-forma
-3.0% appreciation · 0.0% rent growth · sell at horizon
- IRR
- -47.0%
- Equity multiple
- -0.34×
- Total profit
- $-29,709
- Equity at exit
- $11,779
- IRR
- —
- Equity multiple
- -1.53×
- Total profit
- $-55,864
- Equity at exit
- $6,830
Cash invested: $22,120 (down + closing). Projections, not guarantees.
Landlord ↔ Tenant lean methodology
- Overall (STATE)
- 87 Strongly Landlord-Friendly
- State Texas
- 87 Strongly Landlord-Friendly · R+5
- County
- — inherits STATE
- City
- — inherits STATE
ZIP-level market 77054
- Home prices YoY
- -2.6%
- Rents YoY
- -2.8%
- Active inventory
- 272
- Price-to-rent
- 5.3×
Monthly cashflow live
- Estimated rent
- $1,242 high interval (Pro) →
- Mortgage (P&I)
- −$414
- Tax est. 1.5%
- −$99 /mo · $1,185/yr
- Insurance
- −$33
- Flood insurance flood zone
- −$66 /mo · $798/yr
- HOA
- −$584
- Vacancy / Maint / Mgmt
- −$261
- Net cashflow
- $-215
Break-even live
Sensitivity live
| Price | -10% $-160 | -5% $-188 | +0% $-215 | +5% $-242 | +10% $-269 |
|---|---|---|---|---|---|
| Rent | -10% $-313 | -5% $-264 | +0% $-215 | +5% $-166 | +10% $-117 |
| Rate | -1.0pp $-175 | -0.5pp $-195 | base $-215 | +0.5pp $-235 | +1.0pp $-256 |
UW: 25.0% down · 7.5% · 30yr · 1.5% tax · 5.0% vac · 8.0% maint · 8.0% mgmt
Financing live
Cash to close
- Down payment
- $19,750
- Closing costs
- $2,370
- Reserves months
- —
- Total cash needed
- —
Loan-product check · same deal, 3 products live
Conventional
25% down · 7.5% · 30yr
- Down + closing
- —
- Monthly P&I
- —
- Monthly cashflow
- —
- DSCR
- —
- Eligible?
- —
Personal DTI + credit; lowest rate.
DSCR
20% down · 8.5% · 30yr
- Down + closing
- —
- Monthly P&I
- —
- Monthly cashflow
- —
- DSCR
- —
- Eligible?
- —
No personal income docs; deal must DSCR.
Hard money
10% down · 12.0% · 12mo
- Down + closing
- —
- Monthly P&I
- —
- Monthly cashflow
- —
- DSCR
- —
- Eligible?
- —
Short-term bridge; refi at stabilization.
Rent comps 40 comps
| Address | Beds | Baths | Sqft | Rent | $/sqft | DOM | Units | Dist |
|---|---|---|---|---|---|---|---|---|
| 8415 Hearth Dr Unit 1019639P Houston, TX | 3.0 | 2.0 | 1496 | $5,205 | $3.48 | 0d | 1 | 0.01mi |
| 8415 Hearth Dr #25 Houston, TX | 3.0 | 2.0 | 1500 | $3,950 | $2.63 | 45d | 1 | 0.01mi |
| 8521 Hearth Dr Houston, TX | 2.0 | 2.0 | 1092 | $1,195 | $1.09 | 45d | 1 | 0.03mi |
| 2801 S Bartell Dr Houston, TX | 2.0 | 2.0 | 1289 | $1,808 | $1.40 | 13d | 1 | 0.08mi |
| 8435 Hearth Dr Houston, TX | 2.0 | 2.0 | 1040 | $950 | $0.91 | 45d | 1 | 0.08mi |
| 2501 Westridge St Unit 424 Houston, TX | 2.0 | 2.0 | 1005 | $1,239 | $1.23 | 7d | 1 | 0.11mi |
| 2501 Westridge St Unit 2558 Houston, TX | 2.0 | 2.0 | 1005 | $1,223 | $1.22 | 0d | 1 | 0.11mi |
| 2501 Westridge St Unit 422 Houston, TX | 2.0 | 2.0 | 1005 | $1,239 | $1.23 | 9d | 1 | 0.11mi |
| 2820 S Bartell Dr Houston, TX | 1.0 | 1.0 | 780 | $850 | $1.09 | 45d | 3 | 0.14mi |
| 2400 South Loop W Houston, TX | 1.0–2.0 | 1.0–2.0 | 723 | $1,250 | $1.73 | 1d | 26 | 0.14mi |
| 2501 Westridge St Unit 2047 Houston, TX | 2.0 | 2.0 | 1005 | $1,274 | $1.27 | 12d | 1 | 0.15mi |
| 8800 Lakes at 610 Dr Houston, TX | 2.0 | 2.0 | 951 | $1,280 | $1.35 | 26d | 1 | 0.18mi |
| 2401 Westridge St Unit 1-1009 Houston, TX | 2.0 | 2.0 | 841 | $998 | $1.19 | 26d | 1 | 0.18mi |
| 2401 Westridge St Unit 2112 Houston, TX | 2.0 | 2.0 | 812 | $1,019 | $1.25 | 9d | 1 | 0.18mi |
| 2401 Westridge St Unit 422 Houston, TX | 2.0 | 2.0 | 812 | $989 | $1.22 | 9d | 1 | 0.18mi |
| 2401 Westridge St Unit 2-2314 Houston, TX | 2.0 | 1.0 | 812 | $999 | $1.23 | 45d | 1 | 0.18mi |
| 2401 Westridge St Unit 1-1013 Houston, TX | 2.0 | 2.0 | 844 | $1,250 | $1.48 | 45d | 1 | 0.18mi |
| 2401 Westridge St Unit 2-2610 Houston, TX | 2.0 | 1.0 | 812 | $824 | $1.01 | 26d | 1 | 0.18mi |
| 2401 Westridge St Unit 425 Houston, TX | 2.0 | 2.0 | 812 | $1,013 | $1.25 | 12d | 1 | 0.18mi |
| 2401 Westridge St Unit 1-1009 Houston, TX | 2.0 | 2.0 | 844 | $1,000 | $1.18 | 45d | 1 | 0.18mi |
| 2401 Westridge St Unit 2-2008 Houston, TX | 2.0 | 2.0 | 844 | $950 | $1.13 | 46d | 1 | 0.18mi |
| 2407 Westridge St Houston, TX | 2.0 | 2.0 | 975 | $1,199 | $1.23 | 45d | 1 | 0.20mi |
| 2401 Westridge St Houston, TX | 1.0–2.0 | 1.0–2.0 | 723 | $1,250 | $1.73 | 9d | 30 | 0.20mi |
| 2818 S Bartell Dr Houston, TX | 1.0 | 1.0 | 780 | $795 | $1.02 | 45d | 1 | 0.20mi |
| 2600 Westridge St Houston, TX | 1.0–2.0 | 1.0–2.0 | 790 | $1,349 | $1.71 | 0d | 74 | 0.20mi |
| 8410 W Bartell Dr Unit 2047 Houston, TX | 2.0 | 2.0 | 892 | $1,069 | $1.20 | 12d | 1 | 0.22mi |
| 8410 W Bartell Dr Unit 2047 Houston, TX | 2.0 | 2.0 | 892 | $1,059 | $1.19 | 0d | 1 | 0.22mi |
| 8416 W Bartell Dr Houston, TX | 2.0 | 2.0 | 892 | $1,195 | $1.34 | 26d | 1 | 0.24mi |
| 8410 W Bartell Dr Unit 421 Houston, TX | 2.0 | 2.0 | 892 | $1,034 | $1.16 | 7d | 1 | 0.28mi |
| 8410 W Bartell Dr Unit 422 Houston, TX | 2.0 | 2.0 | 892 | $1,034 | $1.16 | 9d | 1 | 0.28mi |
| 8410 W Bartell Dr Unit 2187 Houston, TX | 2.0 | 2.0 | 892 | $1,018 | $1.14 | 0d | 1 | 0.28mi |
| 8900 Lakes at 610 Dr Houston, TX | 1.0–2.0 | 1.0–2.0 | 981 | $1,810 | $1.84 | 45d | 35 | 0.31mi |
| 8900 Lakes at 610 Dr Houston, TX | 1.0–2.0 | 1.0–2.0 | 981 | $1,920 | $1.96 | 1d | 20 | 0.31mi |
| 8877 Lakes At 610 Dr Houston, TX | 1.0–2.0 | 1.0–2.0 | 964 | $1,808 | $1.87 | 13d | 2 | 0.31mi |
| 8877 Lakes At 610 Dr Houston, TX | 1.0–2.0 | 1.0–2.0 | 1005 | $1,808 | $1.80 | 9d | 3 | 0.31mi |
| 8877 Lakes At 610 Dr Houston, TX | 1.0–2.0 | 1.0–2.0 | 964 | $1,808 | $1.87 | 0d | 3 | 0.31mi |
| 8877 Lakes at 610 Dr Unit RAMC3 Houston, TX | 2.0 | 2.0 | 1289 | $1,808 | $1.40 | 45d | 1 | 0.32mi |
| 8877 Lakes at 610 Dr Unit RAMC1 Houston, TX | 1.0 | 1.0 | 854 | $1,325 | $1.55 | 45d | 1 | 0.32mi |
| 8877 Lakes at 610 Dr Unit RAMC2 Houston, TX | 2.0 | 2.0 | 1122 | $1,595 | $1.42 | 45d | 1 | 0.32mi |
| 8877 Lakes at 610 Dr Unit RAMC4 Houston, TX | 2.0 | 1.0 | 1035 | $1,497 | $1.45 | 45d | 1 | 0.32mi |
HOA detail condo
- Monthly dues
- $584 · $7,008/yr
- Assessments
- None detected in remarks — confirm with the listing agent.
Listing history 18 events
-
2026-06-21days on market $79,000 Active 61 DOM
-
2026-06-18days on market $79,000 Active 58 DOM
-
2026-06-17days on market $79,000 Active 57 DOM
-
2026-06-16days on market $79,000 Active 56 DOM
-
2026-06-15days on market $79,000 Active 55 DOM
-
2026-06-13days on market $79,000 Active 53 DOM
-
2026-06-10days on market $79,000 Active 49 DOM
-
2026-06-08days on market $79,000 Active 48 DOM
-
2026-06-07days on market $79,000 Active 47 DOM
-
2026-06-04days on market $79,000 Active 44 DOM
-
2026-06-01days on market $79,000 Active 41 DOM
-
2026-05-31days on market $79,000 Active 40 DOM
-
2026-04-23$1,390
-
2026-04-21$79,000 Active 229-char remark
-
2026-03-31historical
-
2025-11-21$88,000 Active
-
2006-10-12historical
-
2006-04-12$53,000
ⓘ Source: listings_history table (triggers on properties + properties_extension) + one-shot
backfill from property_details.listing_events for pre-trigger history.
Climate risk First Street
- Flood 8/10 Severe FEMA zone X (unshaded) · 99% chance over 30 yrs
- Wildfire 1/10 Low
- Heat 9/10 Extreme 7 d/yr ≥109°F today · 25 d/yr by 30 yrs out
- Wind 9/10 Extreme 99% chance of damaging wind over 30 yrs
- Air quality 2/10 Low 2 unhealthy d/yr today · 2 by 30 yrs out
Nearby sold comps map
Loading sold comps map…
Walkable amenities ~0.75 mi
Loading nearby amenities…
Taxation est. · year 1
- Rental income
- $14,909
- − Mortgage interest
- −$4,425
- − Property taxes
- −$1,185
- − Insurance
- −$1,192
- − Repairs & maintenance
- −$1,193
- − Management
- −$1,193
- − HOA
- −$7,008
- − Depreciation
- −$2,298
- Taxable loss
- −$3,585
- Est. tax savings @ 24.0%
- +$860
- After-tax cash flow
- $-1,718/yr
For passive investors: Depreciation is non-cash, so a rental often shows a tax loss while cash-flowing — sheltering income. Rental losses are passive: they offset passive income freely, and up to $25,000/yr can offset ordinary (W-2) income if you actively participate and your MAGI is under $100k (phasing out to $0 by $150k); unused losses carry forward. On sale, claimed depreciation is recaptured at up to 25%, and gains may owe capital-gains tax (a 1031 exchange can defer both). Figures are a year-1 estimate at your 24.0% rate — not tax advice; consult a CPA.
Schools (NCES district)
- District
- Houston ISD
- NCES district ID
- 4823640
- Math proficiency
- 27% ▼ -18.00%
- Reading proficiency
- 35% ▼ -6.00%
- Median HH income
- $46,054
- Composite
- 26.63/100
- National rank
- #7173
- State rank
- #593 of 826 in TX
Livability — Houston
- Score
- 74/100
- State rank
- #184
- US rank
- #4771
Category grades
Schools grade is shown separately in the Schools card above.
Census & demographics
- Census place
- Houston, TX
- County
- Harris County · 4,702,590 people
- City population
- 3,226,434
- Metro
- Houston-The Woodlands-Sugar Land, TX
- Population (ZIP)
- 28,272
- Household income
- $62,106
- Rent vs Own
- Severe rent burden
- 2814.0
Population outlook (Harris County) Hauer SSP2
- Today (2025)
- 5,571,493 people
- By 2030
- 6,089,821 · +9.3%
- By 2040
- 7,142,806 · +28.2%
- By 2050
- 8,185,864 · +46.9%
- By 2075
- 10,574,329 · +89.8%
- By 2100
- 12,109,958 · +117.4%
Race, ethnicity, and origin ACS 2023
- Neighborhood character
- Highly diverse neighborhood (Simpson 0.72)
- Race & ethnicity
- Black 41% Asian 22% White 20% Hispanic / Latino 14% Two or more races 10%
- Hispanic origin (detail)
- Mexican 7%
- Common ancestry
- Slovak 2% Romanian 1% Italian 1%
- Foreign-born
- 29% · China, Canada, Jamaica
- Languages at home
- 67% English-only · Spanish 9% Chinese 7% Other Indo-European 5%
Political lean MEDSL · Harris
- 2024 margin
- Lean D (+5.5) · D 52.0% · R 46.4% · Other 1.6%
- 2008→2024 swing
- +3.9pp toward D · 2008: 1.6pp · 2024: 5.5pp
- All cycles
- 2024: D+5.5 2020: D+13.3 2016: D+12.4 2012: D+0.1 2008: D+1.6
Not yet ingested
- Civics
- —
Market trends
- HPI YoY
- ▼ -4.51%
- Current HPI
- 170.4017
- Rent YoY
- ▼ -2.82%
- Metro
- Houston-The Woodlands-Sugar Land, TX
- State GDP YoY
- ▲ 3.95%
- F500 in state
- 110
Industry mix (Fortune 500 HQ in TX)
| Industry | F500 HQs | Revenue |
|---|---|---|
| Energy | 16 | $1,198B |
|
||
| Technology | 5 | $198B |
|
||
| Engineering / Construction | 4 | $72B |
|
||
| Energy Services | 3 | $60B |
|
||
| Utilities | 3 | $41B |
|
||
| Healthcare | 2 | $330B |
|
||
Price history
-97.4% since first listed6 events — show timeline
- 2026-04-23 Listed for Rent $1,390 HARMLS
- 2026-04-21 Listed $79,000 HARMLS
- 2026-03-31 Listing Removed — HARMLS
- 2025-11-21 Listed $88,000 HARMLS
- 2006-10-12 Listing Removed — HARMLS
- 2006-04-12 Listed $53,000 HARMLS
Cash-flow waterfall
monthlySold comps — $/sqft
last 12 mo · ≤1 miLoading sold comps…