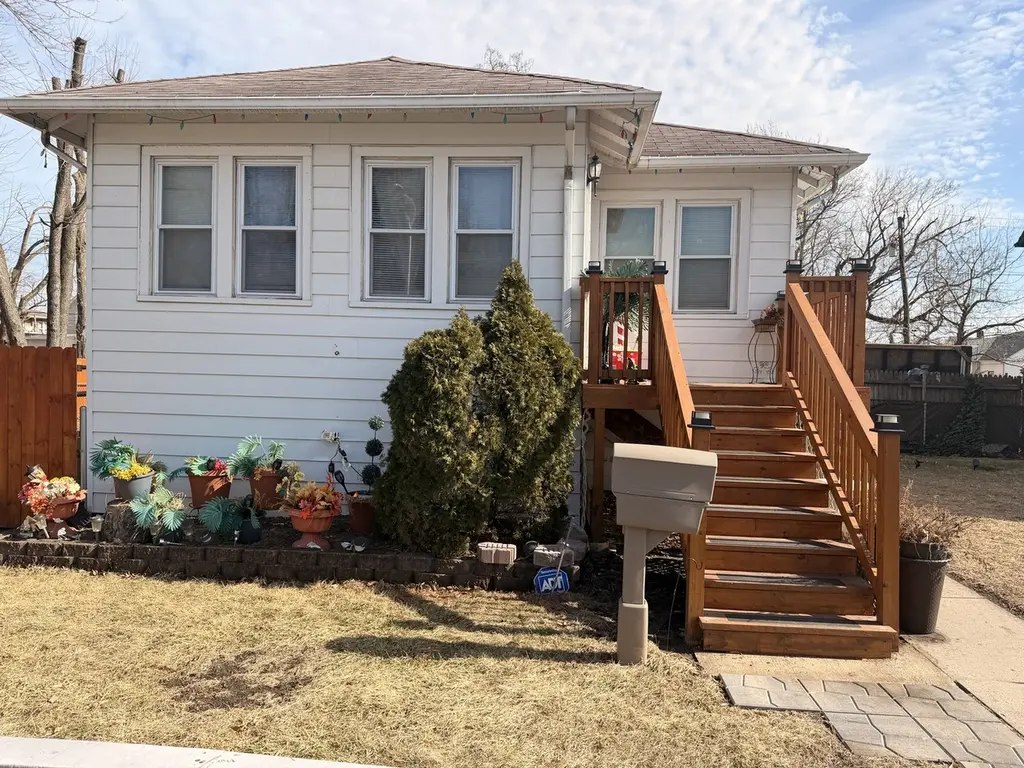
16951 Winchester Ave · Hazel Crest, IL
Flood risk 1/10 · Minimal
- FEMA flood zone
- X (unshaded)
- Chance of flooding over 30 yrs
- 0.0%
- Est. flood insurance / yr
- $473 – $860
Fire risk 1/10 · Minimal
- Est. fire insurance / yr
- $804 – $1,492
Heat risk 3/10 · Minor
- Hot days now (above 102°F)
- 7 days/yr
- Hot days in 30 yrs
- 15 days/yr
Wind risk 2/10 · Minimal
- Chance of severe wind over 30 yrs
- —
Air-quality risk 3/10 · Minor
- Unhealthy air days now
- 4 days/yr
- Unhealthy air days in 30 yrs
- 4 days/yr
Risk factors via First Street. Map © Google.
Why this score? — see what drove the C+ grade
The composite is a weighted blend of 9 inputs, each scored 0–100. Each bar is that input's sub-score; the figure is the points it added to the 100-point composite (weight × sub-score).
- Cash flow +27.4/30.0
- DSCR +9.6/10.0
- 1% rule +7.5/10.0
- ARV discount +7.5/15.0
- Livability +3.8/5.0
- Rent growth +2.5/5.0
- Condition / age +2.5/5.0
- Schools +0.7/10.0
- Appreciation +0.0/10.0
$195,000
🖨 Deal sheet (PDF) 📄 Offer letter ✓ Due diligence
Listing remarks MLS
NICE HOME AND HAS THREE LOTS. 76'X122' AND FENCED YARD WITH A NEWER GARAGE BUILT IN 2007 WITH PLENTY OF SPACE. UPDATES ARE HIGH EFFICIENCY FURNACE AND A. C 2013, WINDOWS 2008, REFINISHED HARDWOOD FLOOR IN 2012, CIRCUIT BREAKERS 2001, KITCHEN CABINETS IN 2005 AND APPLIANCES STAY. LARGE LIVING ROOM, DINING ROOM, FULL BATHROOM REMODELED 2016 AND TWO GREAT SIZE BEDROOMS. BASEMENT IS FINISHED WITH 1'2 BATHROOM AND FAMILY ROOM AND STORAGE ROOMS AND WORK AREA. THE YARD HAS NICE TREES AND IT IS SPACIOUS FOR THE SUMMER TIME. STORAGE SHED AND MUCH MORE.
Key facts
- Heated garage
- Four-seasons room
- Finished basement
Tags
Property features AI
Finance
- Other: Parcel number 29302170100000 (additional parcels: 29302170110000, 29302170120000)
- HOA & community: No master association fee required
Exterior
- Parking: Detached garage; Approximately 2.5 garage spaces; Approximately 6.5 total parking spaces
- Utilities: Public water; Public sewer; 200+ amp electrical service
- Home design: Detached single-family home; One-story layout; Fee simple ownership; Rehab completed in 2025; Vinyl siding exterior; Built before 1978 (age category 91-100 years)
- Construction: Vinyl siding construction
- Exterior features: Enclosed porch (7 x 16); Heated sun room (13 x 15); Lot dimensions approximately 76 x 122; Lot is less than 0.25 acre
Interior
- Kitchen: Kitchen on the main level
- Bedrooms: Two bedrooms total (one on the main level, one bedroom in the basement); Potential for a third bedroom
- Bathrooms: One full bathroom; One half bathroom; Basement contains a bathroom
- Heating & cooling: Natural gas heating; Central air conditioning
- Interior features: Finished full basement with walk-out access; 8 total rooms
- Laundry & utility: Laundry room in the basement (7 x 7)
Neighborhood map
What this means for you Summary
Snapshot
- This is a 2-bed/1.0-bath single-family listed at $195k.
Deal economics
- At list price, monthly cash flow is $571 ($7k/yr) — positive.
- The deal already cash-flows at list — no discount required.
- Meets the 1% rule at list price ($2k rent vs $195k).
- Recommended offer: $192k (1.5% below list) — sets the bar for market timing.
Location & tenants
- Location reads 75/100 on livability (#229 in IL, #4,242 nationally) — a middle-class / working-renter tenant base. Strengths: commute A+, cost of living A+, housing A+; Watch: health & safety C-, schools D-, crime F.
- Thornton Twp Hsd 205 (suburban): math 7% / reading 8% proficiency, ranked #594 of 620 in IL (top 96%) — low school quality limits family demand, transient renter base, plan for 1-2y turnover.
- Market conditions: 79 active listings in the ZIP; 3 comparable units currently listed for rent nearby; rentals leasing fast (median 2d on market — plan ~1-2 weeks tenant-placement turnaround); 6,272 units permitted in Cook County in 2024 (4,658 in 5+ unit buildings).
Forward outlook
- Local home prices are declining (-3.0%/yr); year-one equity from $1k of loan paydown is wiped out by about $6k of value loss. Plan a longer hold.
- At projected returns (-3.0% appreciation + 3.0% rent growth), your $55k cash investment doubles in ~10 years — after that, you're playing with house money.
Negotiation context
- It's been on market 15 days — a 2% lower offer ($192k) is reasonable based on typical stale-listing flexibility.
- 2 sale attempts since 7y ago with the ask held roughly flat each time — persistent listings suggest the price (not the market) is what's stuck; bring a comps-based counter.
- Current owner paid $72k; list at $195k implies a 169% gain — meaningful room to come down on a strong offer.
Risks & watch-outs
- Watch-outs: built in 1926 — expect roof / HVAC / electrical / plumbing capex.
Questions for the listing agent
- Built in 1926 — when were the roof, HVAC, electrical panel, plumbing, and water heater last replaced?
- Is there a deadline driving the sale (1031 exchange, divorce, estate, relocation)? That informs how much negotiation room exists.
- Schools are D-rated, which usually means shorter tenancies and higher turnover. Who's the typical renter profile here, and what's been the actual vacancy rate?
- Crime grade is F in this area — have there been break-ins, vandalism, or insurance claims at this property in the last 3 years? What carrier currently insures it and at what premium?
- What's the average days-on-market for RENTAL listings here right now (not sales)? A rising rental-DOM trend means longer vacancies and softer asking-rent achievability than the comps imply.
- What's the recent tenant-quality profile in this submarket — average credit score on applications, eviction rate, late-payment / NSF rate, and stable-employment percentage? A property-management company in the area should have these aggregated.
- How much new for-sale + rental construction is in the pipeline within 1–3 miles? Heavy new supply typically softens prices + rents 12–24 months out; constrained supply supports both.
Investment metrics
- 1% rule
- 1.25% ✓
- Cap rate
- 9.81%
- Cash-on-cash
- 12.55%
- DSCR
- 1.56
- GRM
- 6.7
CMA / ARV
- ARV (on-the-fly)
- $127,872
- Comps found
- 12
Show comp detail 12 sales within ~0.75 mi
| Address | Dist | Beds/Ba | Sqft | Sold | Price | $/sf | Match |
|---|---|---|---|---|---|---|---|
| 16942 Winchester Ave | 0.03mi | 2/1.0 | 874 (+1%) | 10mo | $75,000 | $86 | 88 |
| 2222 170th St | 0.40mi | 2/1.0 | 864 (0%) | 9mo | $182,000 | $211 | 74 |
| 16735 Dixie Hwy | 0.22mi | 2/1.0 | 965 (+12%) | 1mo | $153,000 | $159 | 69 |
| 16777 Head Ave | 0.38mi | 2/1.0 | 830 (-4%) | 12mo | $150,000 | $181 | 66 |
| 16973 Jodave Ave | 0.13mi | 3/2.0 (+1) | 800 (-7%) | 9mo | $17,500 | $22 | 66 |
| 16768 Bulger Ave | 0.30mi | 2/1.0 | 954 (+10%) | 4mo | $125,000 | $131 | 65 |
| 16807 Wood St | 0.26mi | 3/1.0 (+1) | 985 (+14%) | 0mo | $90,000 | $91 | 59 |
| 16784 Trapet Ave | 0.34mi | 3/1.0 (+1) | 970 (+12%) | 1mo | $96,000 | $99 | 58 |
| 1514 173rd St | 0.65mi | 3/1.0 (+1) | 924 (+7%) | 3mo | $137,000 | $148 | 51 |
| 16535 Hermitage Ave | 0.56mi | 3/1.0 (+1) | 956 (+11%) | 6mo | $133,900 | $140 | 46 |
| 16521 Wood St | 0.56mi | 3/1.0 (+1) | 952 (+10%) | 12mo | $170,000 | $179 | 42 |
| 2041 175th St | 0.72mi | 2/1.0 | 952 (+10%) | 12mo | $220,000 | $231 | 39 |
Match score weights: distance 35% · size 25% · config 20% · recency 20%. Top-matched comps best support the ARV.
Projected returns pro-forma
-3.0% appreciation · 3.0% rent growth · sell at horizon
- IRR
- 2.3%
- Equity multiple
- 1.09×
- Total profit
- $4,809
- Equity at exit
- $29,075
- IRR
- 11.9%
- Equity multiple
- 1.94×
- Total profit
- $51,181
- Equity at exit
- $16,860
Cash invested: $54,600 (down + closing). Projections, not guarantees.
Landlord ↔ Tenant lean methodology
- Overall (STATE)
- 43 Moderately Tenant-Leaning
- State Illinois
- 43 Moderately Tenant-Leaning · D+7
- County
- — inherits STATE
- City
- — inherits STATE
ZIP-level market 60429
- Home prices YoY
- -14.0%
- Active inventory
- 79
- Price-to-rent
- 6.7×
Monthly cashflow live
- Estimated rent
- $2,436 medium interval (Pro) →
- Mortgage (P&I)
- −$1,023
- Tax from tax record
- −$250 /mo · $3,000/yr
- Insurance
- −$81
- HOA
- −$0
- Vacancy / Maint / Mgmt
- −$512
- Net cashflow
- $571
Break-even live
Sensitivity live
| Price | -10% $681 | -5% $626 | +0% $571 | +5% $516 | +10% $461 |
|---|---|---|---|---|---|
| Rent | -10% $379 | -5% $475 | +0% $571 | +5% $667 | +10% $763 |
| Rate | -1.0pp $669 | -0.5pp $621 | base $571 | +0.5pp $520 | +1.0pp $469 |
UW: 25.0% down · 7.5% · 30yr · 1.5% tax · 5.0% vac · 8.0% maint · 8.0% mgmt
Financing live
Cash to close
- Down payment
- $48,750
- Closing costs
- $5,850
- Reserves months
- —
- Total cash needed
- —
Loan-product check · same deal, 3 products live
Conventional
25% down · 7.5% · 30yr
- Down + closing
- —
- Monthly P&I
- —
- Monthly cashflow
- —
- DSCR
- —
- Eligible?
- —
Personal DTI + credit; lowest rate.
DSCR
20% down · 8.5% · 30yr
- Down + closing
- —
- Monthly P&I
- —
- Monthly cashflow
- —
- DSCR
- —
- Eligible?
- —
No personal income docs; deal must DSCR.
Hard money
10% down · 12.0% · 12mo
- Down + closing
- —
- Monthly P&I
- —
- Monthly cashflow
- —
- DSCR
- —
- Eligible?
- —
Short-term bridge; refi at stabilization.
Rent comps 3 comps
| Address | Beds | Baths | Sqft | Rent | $/sqft | DOM | Units | Dist |
|---|---|---|---|---|---|---|---|---|
| 2308 170th St Hazel Crest, IL | 3.0 | 2.0 | 1020 | $2,400 | $2.35 | 2d | 1 | 0.48mi |
| 16752 Artesian Ave Hazel Crest, IL | 3.0 | 1.0 | 867 | $2,500 | $2.88 | 2d | 1 | 0.68mi |
| 16125 Marshfield Ave Markham, IL | 3.0 | 1.0 | 1043 | $2,400 | $2.30 | 2d | 1 | 1.07mi |
Listing history 11 events
-
2026-06-21statusdays on market $195,000 Contingent - Continue to Show 15 DOM
-
2026-06-18days on market $195,000 Active 12 DOM
-
2026-06-17days on market $195,000 Active 11 DOM
-
2026-06-16days on market $195,000 Active 10 DOM
-
2026-06-15days on market $195,000 Active 9 DOM
-
2026-06-13days on market $195,000 Active 7 DOM
-
2026-06-13days on market $195,000 Active 6 DOM
-
2026-06-09days on market $195,000 Active 3 DOM
-
2026-06-08days on market $195,000 Active 2 DOM
-
2026-06-07remarks 699-char remark
-
2026-06-07$195,000 Active 1 DOM
ⓘ Source: listings_history table (triggers on properties + properties_extension) + one-shot
backfill from property_details.listing_events for pre-trigger history.
Tax reassessment forecast IL · Partial reset (capped growth)
- Current annual tax
- $3,000 · $250/mo
- Projected year-2 tax
- $3,713 · $309/mo
- Expected delta
- +$713/yr (+$59/mo · 23.8%)
ⓘ Screening estimate from a state-policy table — verify with the county assessor before closing.
Climate risk First Street
- Flood 1/10 Low FEMA zone X (unshaded) · 0% chance over 30 yrs
- Wildfire 1/10 Low
- Heat 3/10 Moderate 7 d/yr ≥102°F today · 15 d/yr by 30 yrs out
- Wind 2/10 Low
- Air quality 3/10 Moderate 4 unhealthy d/yr today · 4 by 30 yrs out
Nearby sold comps map
Loading sold comps map…
Walkable amenities ~0.75 mi
Loading nearby amenities…
Taxation est. · year 1
- Rental income
- $29,238
- − Mortgage interest
- −$10,923
- − Property taxes
- −$3,000
- − Insurance
- −$975
- − Repairs & maintenance
- −$2,339
- − Management
- −$2,339
- − Depreciation
- −$5,673
- Taxable income
- $3,989
- Est. tax owed @ 24.0%
- −$957
- After-tax cash flow
- $5,895/yr
For passive investors: Depreciation is non-cash, so a rental often shows a tax loss while cash-flowing — sheltering income. Rental losses are passive: they offset passive income freely, and up to $25,000/yr can offset ordinary (W-2) income if you actively participate and your MAGI is under $100k (phasing out to $0 by $150k); unused losses carry forward. On sale, claimed depreciation is recaptured at up to 25%, and gains may owe capital-gains tax (a 1031 exchange can defer both). Figures are a year-1 estimate at your 24.0% rate — not tax advice; consult a CPA.
Schools (NCES district)
- District
- Thornton Twp Hsd 205
- NCES district ID
- 1738970
- Math proficiency
- 7% ▬ 0.00%
- Reading proficiency
- 8% ▼ -2.00%
- Median HH income
- $43,392
- Composite
- 6.92/100
- National rank
- #9976
- State rank
- #594 of 620 in IL
Livability — Hazel Crest
- Score
- 75/100
- State rank
- #229
- US rank
- #4242
Category grades
Schools grade is shown separately in the Schools card above.
Census & demographics
- Census place
- Hazel Crest, IL
- City population
- 14,602
- Population (ZIP)
- 14,602
Population outlook (Cook County) Hauer SSP2
- Today (2025)
- 5,347,519 people
- By 2030
- 5,357,703 · +0.2%
- By 2040
- 5,324,924 · -0.4%
- By 2050
- 5,230,762 · -2.2%
- By 2075
- 4,785,735 · -10.5%
- By 2100
- 4,188,836 · -21.7%
Race, ethnicity, and origin ACS 2023
- Neighborhood character
- Predominantly Black (83%)
- Race & ethnicity
- Black 83% White 7% Hispanic / Latino 7% Two or more races 4%
- Hispanic origin (detail)
- Mexican 6%
- Common ancestry
- Romanian 1% Iranian 1%
- Foreign-born
- 5% · Canada
- Languages at home
- 93% English-only · Spanish 6%
Political lean MEDSL · Cook
- 2024 margin
- Solid D (+42.0) · D 70.4% · R 28.4% · Other 1.2%
- 2008→2024 swing
- -11.4pp toward R · 2008: 53.4pp · 2024: 42.0pp
- All cycles
- 2024: D+42.0 2020: D+50.3 2016: D+53.0 2012: D+49.4 2008: D+53.4
Not yet ingested
- Civics
- —
Market trends
- HPI YoY
- ▼ -46.04%
- Current HPI
- 282.3552
- Rent YoY
- —
- Metro
- —
- State GDP YoY
- ▲ 1.59%
- F500 in state
- 60
Industry mix (Fortune 500 HQ in IL)
| Industry | F500 HQs | Revenue |
|---|---|---|
| Insurance | 4 | $201B |
|
||
| Consumer Goods | 4 | $87B |
|
||
| Industrial Machinery | 3 | $64B |
|
||
| Healthcare | 2 | $55B |
|
||
| Retail / Pharmacy | 1 | $148B |
|
||
| Agriculture / Food | 1 | $86B |
|
||
Price history
+251.4% since first listed7 events — show timeline
- 2026-06-06 Listed $195,000 MRED as Distributed by MLS Grid
- 2019-07-05 Sold (Public Records) $72,500 Public Records
- 2019-07-02 Sold (MLS) $72,500 MRED as Distributed by MLS Grid
- 2019-06-29 Pending — MRED as Distributed by MLS Grid
- 2019-05-12 Contingent — MRED as Distributed by MLS Grid
- 2019-04-13 Listed $75,000 MRED as Distributed by MLS Grid
- 1996-05-30 Sold (Public Records) $55,500 Public Records
Property tax history
+4.1%/yrLatest (2023): $3,000 · +103.0% YoY. Source: county tax records.
Cash-flow waterfall
monthlySold comps — $/sqft
last 12 mo · ≤1 miLoading sold comps…