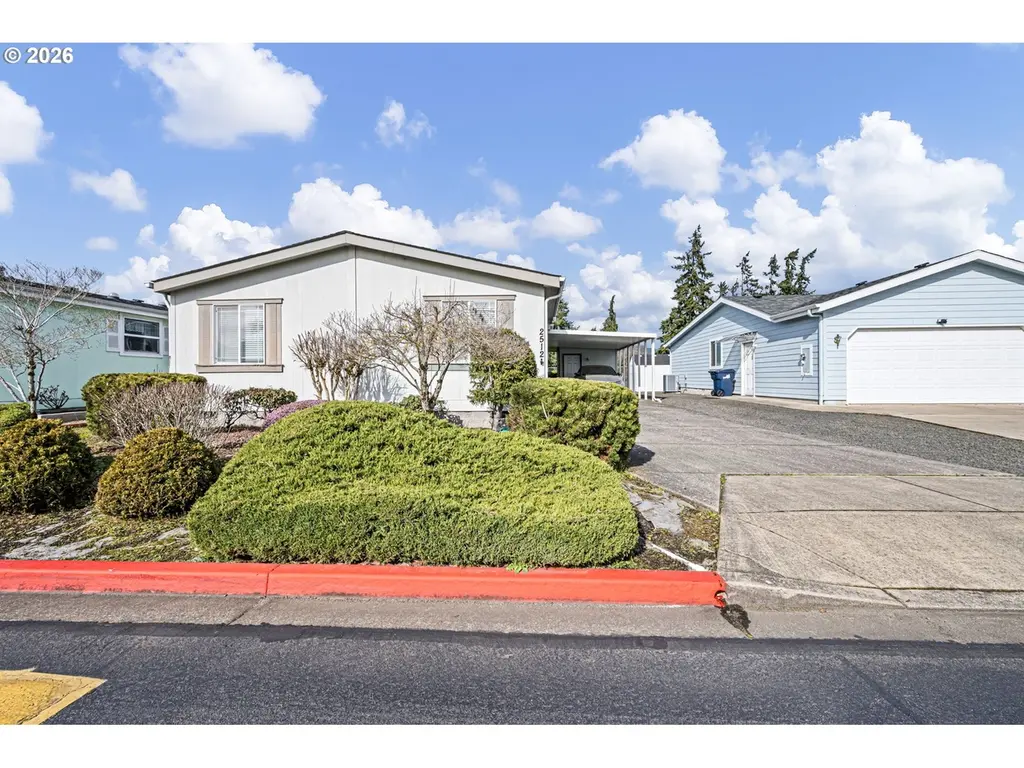
2512 Maia Loop · Springfield, OR
Flood risk 3/10 · Minor
- FEMA flood zone
- X (unshaded)
- Chance of flooding over 30 yrs
- 0.13%
- Est. flood insurance / yr
- $507 – $1,088
Fire risk 5/10 · Moderate
- Est. fire insurance / yr
- $498 – $926
Heat risk 5/10 · Moderate
- Hot days now (above 92°F)
- 7 days/yr
- Hot days in 30 yrs
- 16 days/yr
Wind risk 1/10 · Minimal
- Chance of severe wind over 30 yrs
- —
Air-quality risk 10/10 · Severe
- Unhealthy air days now
- 15 days/yr
- Unhealthy air days in 30 yrs
- 16 days/yr
Risk factors via First Street. Map © Google.
Why this score? — see what drove the F grade
The composite is a weighted blend of 9 inputs, each scored 0–100. Each bar is that input's sub-score; the figure is the points it added to the 100-point composite (weight × sub-score).
- ARV discount +10.9/15.0
- Cash flow +6.4/30.0
- Livability +4.2/5.0
- Rent growth +3.7/5.0
- Condition / age +2.5/5.0
- Schools +2.4/10.0
- 1% rule +0.9/10.0
- DSCR +0.7/10.0
- Appreciation +0.0/10.0
$299,000
🖨 Deal sheet (PDF) 📄 Offer letter ✓ Due diligence
Listing remarks
Step inside this inviting home in the highly sought after Maia Park 55+ community. The layout of this beautiful property offers comfort, convenience and an excellent separation of spaces. The entrance leads you into a spacious, light-filled living area that seamlessly flows into an open-plan family room, perfect for relaxed living or hosting guests. Two neatly-designed bedrooms and a guest bath are situated conveniently off the living room. Toward the rear off the family room, resides the primary suite, complete with a large walk-in closet and luxurious en-suite bathroom. This friendly community is conveniently located near shopping venues, dining options and hospitals, fulfilling all your
Key facts
- Hospitals
- Dining options
- Large walk-in closet
Tags
Property features AI
Finance
- Other: Lot approximately 0.12 acres (5,000–6,999 SqFt)
- Financial info: Land lease in effect (monthly lot rent $65) with lease expiring August 1, 2026
- HOA & community: HOA: Maia Park
Exterior
- Parking: Carport; Extra-deep carport
- Utilities: Electric service (fuel: electricity); Public water; Public sewer
- Home design: Manufactured home on real property; Residential property; Single-level living (main level area 1,620)
- Construction: Built in 2005
- Exterior features: T-111 siding; Level lot
Interior
- Kitchen: Kitchen
- Bedrooms: Primary bedroom (Main); Second bedroom; Third bedroom
- Bathrooms: 2 full bathrooms
- Heating & cooling: Heat pump heating; No central cooling listed
- Interior features: Family room; Great room; Dining room; Living room
- Laundry & utility: Electric hot water
Neighborhood map
What this means for you Summary
Snapshot
- This is a 3-bed/2.0-bath manufactured listed at $299k.
Deal economics
- At list price, monthly cash flow is $-522 ($-6k/yr) — negative.
- To cash-flow at today's rent, offer at most $207k (30.8% below list).
- To meet the 1% rule (rent ≥ 1% of price), the offer needs to be $177k (40.8% below list).
- Recommended offer: $177k (40.8% below list) — sets the bar for 1% rule.
- Cap rate 4.2% vs local median 3.0% in Springfield — top-decile yield for the area; either an underpriced asset or a hidden risk that comps aren't pricing in. Stress-test before assuming the spread holds.
Location & tenants
- Location reads 83/100 on livability (#40 in OR, #934 nationally) — a professional / high-income tenant draw. Strengths: amenities A+, commute A+, housing A+; Watch: crime D+, employment D+.
- Springfield SD 19 (suburban): math 19% / reading 38% proficiency, ranked #48 of 58 in OR (top 83%) — low school quality limits family demand, transient renter base, plan for 1-2y turnover.
- Zoned schools: Yolanda Elementary School (math 24% / reading 54%, grade F, #183 of 412 statewide, top 47%, 358 students, 61% FRL); Briggs Middle School (math 12% / reading 32%, grade F, #119 of 128 statewide, top 94%, 428 students, 62% FRL); Thurston High School (math 22% / reading 52%, grade F, #85 of 143 statewide, top 61%, 1,277 students, 65% FRL).
- Market conditions: Rents rising fast (+4.8%/yr); 166 active listings in the ZIP; 8 comparable units currently listed for rent nearby; rentals at typical pace (median 24d on market — plan ~3-4 weeks tenant-placement turnaround); 1,808 units permitted in Lane County in 2024 (972 in 5+ unit buildings).
- This rent runs 32% of the median local income ($66k/yr) — at the standard rent-burdened threshold; future hikes will face affordability resistance.
Forward outlook
- Local home prices are declining (-3.0%/yr); year-one equity from $2k of loan paydown is wiped out by about $9k of value loss. Plan a longer hold.
- Lane County population projected at +15% by 2050 — long-run rental-demand tailwind backs the buy-and-hold thesis.
Negotiation context
- It's been on market 15 days — a 2% lower offer ($295k) is reasonable based on typical stale-listing flexibility.
- 3 sale attempts with the ask held roughly flat each time — persistent listings suggest the price (not the market) is what's stuck; bring a comps-based counter.
- Current owner paid $38k; list at $299k implies a 697% gain — meaningful room to come down on a strong offer.
Risks & watch-outs
- Climate carrying-cost: moderate wildfire risk; extreme-heat days projected 7→16/yr by 2055 (HVAC capex compounding) — expect insurance premiums to compound above CPI over the hold.
Questions for the listing agent
- What do current leases actually rent for vs. the listed asking? Can we see a recent rent roll and the last 12 months of T-12 income?
- Is there a deadline driving the sale (1031 exchange, divorce, estate, relocation)? That informs how much negotiation room exists.
- Schools are D-rated, which usually means shorter tenancies and higher turnover. Who's the typical renter profile here, and what's been the actual vacancy rate?
- Crime grade is D in this area — have there been break-ins, vandalism, or insurance claims at this property in the last 3 years? What carrier currently insures it and at what premium?
- The area grade is low — what's the realistic commute time and amenity access for the typical tenant pool here? Any planned neighborhood developments (good or bad) we should know about?
- What's the average days-on-market for RENTAL listings here right now (not sales)? A rising rental-DOM trend means longer vacancies and softer asking-rent achievability than the comps imply.
- What's the recent tenant-quality profile in this submarket — average credit score on applications, eviction rate, late-payment / NSF rate, and stable-employment percentage? A property-management company in the area should have these aggregated.
- How much new for-sale + rental construction is in the pipeline within 1–3 miles? Heavy new supply typically softens prices + rents 12–24 months out; constrained supply supports both.
Investment metrics
- 1% rule
- 0.59% ✗
- Cap rate
- 4.20%
- Cash-on-cash
- -7.48%
- DSCR
- 0.67
- GRM
- 14.1
CMA / ARV
- ARV (median comp)
- $323,586
- List price
- $299,000
- Delta
- -7.60%
- Verdict
- FAIR
- Comps
- 20 within 1.0 mi
Show comp detail 5 sales within ~0.75 mi
| Address | Dist | Beds/Ba | Sqft | Sold | Price | $/sf | Match |
|---|---|---|---|---|---|---|---|
| 2717 Maia Loop | 0.13mi | 3/2.0 | 1,716 (+6%) | 2mo | $355,000 | $207 | 82 |
| 2420 Maia Loop | 0.06mi | 3/2.0 | 1,716 (+6%) | 11mo | $365,000 | $213 | 78 |
| 2668 Maia Loop | 0.10mi | 3/2.0 | 1,512 (-7%) | 9mo | $345,000 | $228 | 76 |
| 2569 Maia Loop | 0.06mi | 4/2.0 (+1) | 1,782 (+10%) | 2mo | $330,000 | $185 | 74 |
| 2145 31st St #29 | 0.54mi | 4/2.0 (+1) | 1,809 (+12%) | 13mo | $116,000 | $64 | 39 |
Match score weights: distance 35% · size 25% · config 20% · recency 20%. Top-matched comps best support the ARV.
Projected returns pro-forma
-3.0% appreciation · 4.81% rent growth · sell at horizon
- IRR
- -27.6%
- Equity multiple
- 0.06×
- Total profit
- $-78,454
- Equity at exit
- $44,582
- IRR
- -20.9%
- Equity multiple
- -0.16×
- Total profit
- $-97,377
- Equity at exit
- $25,852
Cash invested: $83,720 (down + closing). Projections, not guarantees.
Landlord ↔ Tenant lean methodology
- Overall (STATE)
- 28 Tenant-Leaning
- State Oregon
- 28 Tenant-Leaning · D+6
- County
- — inherits STATE
- City
- — inherits STATE
ZIP-level market 97477
- Rents YoY
- 4.8%
- Active inventory
- 166
- Price-to-rent
- 14.1×
Monthly cashflow live
- Estimated rent
- $1,770 high interval (Pro) →
- Mortgage (P&I)
- −$1,568
- Tax from tax record
- −$227 /mo · $2,729/yr
- Insurance
- −$125
- HOA
- −$0
- Lot rent leased land?
- −$0
- Vacancy / Maint / Mgmt
- −$372
- Net cashflow
- $-522
Break-even live
Sensitivity live
| Price | -10% $-352 | -5% $-437 | +0% $-522 | +5% $-606 | +10% $-691 |
|---|---|---|---|---|---|
| Rent | -10% $-661 | -5% $-592 | +0% $-522 | +5% $-452 | +10% $-382 |
| Rate | -1.0pp $-371 | -0.5pp $-446 | base $-522 | +0.5pp $-599 | +1.0pp $-678 |
UW: 25.0% down · 7.5% · 30yr · 1.5% tax · 5.0% vac · 8.0% maint · 8.0% mgmt
Financing live
Cash to close
- Down payment
- $74,750
- Closing costs
- $8,970
- Reserves months
- —
- Total cash needed
- —
Loan-product check · same deal, 3 products live
Conventional
25% down · 7.5% · 30yr
- Down + closing
- —
- Monthly P&I
- —
- Monthly cashflow
- —
- DSCR
- —
- Eligible?
- —
Personal DTI + credit; lowest rate.
DSCR
20% down · 8.5% · 30yr
- Down + closing
- —
- Monthly P&I
- —
- Monthly cashflow
- —
- DSCR
- —
- Eligible?
- —
No personal income docs; deal must DSCR.
Hard money
10% down · 12.0% · 12mo
- Down + closing
- —
- Monthly P&I
- —
- Monthly cashflow
- —
- DSCR
- —
- Eligible?
- —
Short-term bridge; refi at stabilization.
Rent comps 8 comps
| Address | Beds | Baths | Sqft | Rent | $/sqft | DOM | Units | Dist |
|---|---|---|---|---|---|---|---|---|
| 2700 Pierce Pkwy Springfield, OR | 3.0 | 1.0–2.0 | 876 | $2,365 | $2.70 | 16d | 11 | 0.29mi |
| 2654 U St Springfield, OR | 4.0 | 2.5 | 1880 | $2,895 | $1.54 | 46d | 1 | 0.31mi |
| 1890 M St Springfield, OR | 1.0–3.0 | 1.0–2.0 | 1033 | $1,599 | $1.55 | 23d | 1 | 0.48mi |
| 1422 Lawnridge Ave Springfield, OR | 4.0 | 2.0 | 2012 | $2,695 | $1.34 | 16d | 1 | 0.83mi |
| 2650 31st St Springfield, OR | 4.0 | 2.0 | 1890 | $2,495 | $1.32 | 46d | 1 | 0.87mi |
| 317 30th St Springfield, OR | 2.0–3.0 | 2.0 | 1200 | $2,405 | $2.00 | 16d | 19 | 1.09mi |
| 280 20th St Unit 1/2 Springfield, OR | 3.0 | 1.0 | 1300 | $1,695 | $1.30 | 23d | 1 | 1.11mi |
| 1239 D St Springfield, OR | 3.0 | 1.0 | 1145 | $2,500 | $2.18 | 46d | 1 | 1.34mi |
Listing history 9 events
-
2026-06-03status $299,000 Pending 15 DOM
-
2026-06-02days on market $299,000 Active 15 DOM
-
2026-06-01days on market $299,000 Active 14 DOM
-
2026-05-31days on market $299,000 Active 13 DOM
-
2026-05-30statusdays on market $299,000 Active 12 DOM
-
2026-05-18status Active 729-char remark
-
2026-05-11status Pending 729-char remark
-
2026-05-08$299,000 Active 729-char remark
-
2005-04-21soldstatus $37,500
ⓘ Source: listings_history table (triggers on properties + properties_extension) + one-shot
backfill from property_details.listing_events for pre-trigger history.
Tax reassessment forecast OR · Resets to sale price
- Current annual tax
- $2,729 · $227/mo
- Projected year-2 tax
- $2,900 · $242/mo
- Expected delta
- +$171/yr (+$14/mo · 6.3%)
ⓘ Screening estimate from a state-policy table — verify with the county assessor before closing.
Climate risk First Street
- Flood 3/10 Moderate FEMA zone X (unshaded) · 13% chance over 30 yrs
- Wildfire 5/10 Major
- Heat 5/10 Major 7 d/yr ≥92°F today · 16 d/yr by 30 yrs out
- Wind 1/10 Low
- Air quality 10/10 Extreme 15 unhealthy d/yr today · 16 by 30 yrs out
Nearby sold comps map
Loading sold comps map…
Walkable amenities ~0.75 mi
Loading nearby amenities…
Taxation est. · year 1
- Rental income
- $21,241
- − Mortgage interest
- −$16,749
- − Property taxes
- −$2,729
- − Insurance
- −$1,495
- − Repairs & maintenance
- −$1,699
- − Management
- −$1,699
- − Depreciation
- −$8,698
- Taxable loss
- −$11,828
- Est. tax savings @ 24.0%
- +$2,839
- After-tax cash flow
- $-3,420/yr
For passive investors: Depreciation is non-cash, so a rental often shows a tax loss while cash-flowing — sheltering income. Rental losses are passive: they offset passive income freely, and up to $25,000/yr can offset ordinary (W-2) income if you actively participate and your MAGI is under $100k (phasing out to $0 by $150k); unused losses carry forward. On sale, claimed depreciation is recaptured at up to 25%, and gains may owe capital-gains tax (a 1031 exchange can defer both). Figures are a year-1 estimate at your 24.0% rate — not tax advice; consult a CPA.
Schools (NCES district)
- District
- Springfield SD 19
- NCES district ID
- 4111670
- Math proficiency
- 19% ▼ -13.00%
- Reading proficiency
- 38% ▼ -10.00%
- Median HH income
- $42,236
- Composite
- 24.14/100
- National rank
- #7746
- State rank
- #48 of 58 in OR
Livability — Springfield
- Score
- 83/100
- State rank
- #40
- US rank
- #934
Category grades
Schools grade is shown separately in the Schools card above.
Census & demographics
- Census place
- Springfield, OR
- County
- Lane County · 310,476 people
- City population
- 76,907
- Metro
- Eugene-Springfield, OR
- Population (ZIP)
- 37,534
- Household income
- $65,662
- Rent vs Own
- Severe rent burden
- 1817.0
Population outlook (Lane County) Hauer SSP2
- Today (2025)
- 391,933 people
- By 2030
- 405,860 · +3.6%
- By 2040
- 429,386 · +9.6%
- By 2050
- 452,016 · +15.3%
- By 2075
- 508,825 · +29.8%
- By 2100
- 531,208 · +35.5%
Race, ethnicity, and origin ACS 2023
- Neighborhood character
- Predominantly White (77%)
- Race & ethnicity
- White 77% Hispanic / Latino 13% Two or more races 10% Asian 1% Native American 1%
- Hispanic origin (detail)
- Mexican 10%
- Common ancestry
- Lithuanian 4% Portuguese 4% Italian 3%
- Foreign-born
- 6% · Canada
- Languages at home
- 89% English-only · Spanish 9% Other Asian/Pacific 1%
Political lean MEDSL · Lane
- 2024 margin
- Strong D (+23.1) · D 60.0% · R 36.9% · Other 3.1%
- 2008→2024 swing
- -4.3pp toward R · 2008: 27.4pp · 2024: 23.1pp
- All cycles
- 2024: D+23.1 2020: D+24.3 2016: D+18.9 2012: D+23.4 2008: D+27.4
Not yet ingested
- Civics
- —
Market trends
- HPI YoY
- ▼ -489.08%
- Current HPI
- 299.6863
- Rent YoY
- ▲ 4.81%
- Metro
- Eugene-Springfield, OR
- State GDP YoY
- ▲ 2.05%
- F500 in state
- 2
Industry mix (Fortune 500 HQ in OR)
| Industry | F500 HQs | Revenue |
|---|---|---|
| Consumer Goods | 1 | $51B |
|
||
Price history
+697.3% since first listed7 events — show timeline
- 2026-06-02 Pending — RMLS
- 2026-05-29 Relisted — RMLS
- 2026-05-27 Pending — RMLS
- 2026-05-18 Relisted — RMLS
- 2026-05-11 Pending — RMLS
- 2026-05-08 Listed $299,000 RMLS
- 2005-04-21 Sold (Public Records) $37,500 Public Records
Property tax history
+3.4%/yrLatest (2025): $2,729 · +1.6% YoY. Source: county tax records.
Cash-flow waterfall
monthlySold comps — $/sqft
last 12 mo · ≤1 miLoading sold comps…