138 Buddy Ln · Chimney Rock Village, NC
Flood risk 1/10 · Minimal
- FEMA flood zone
- X (unshaded)
- Chance of flooding over 30 yrs
- 0.0%
- Est. flood insurance / yr
- $507 – $1,088
Fire risk 4/10 · Minor
- Est. fire insurance / yr
- $906 – $1,684
Heat risk 5/10 · Moderate
- Hot days now (above 102°F)
- 8 days/yr
- Hot days in 30 yrs
- 21 days/yr
Wind risk 2/10 · Minimal
- Chance of severe wind over 30 yrs
- —
Air-quality risk 3/10 · Minor
- Unhealthy air days now
- 3 days/yr
- Unhealthy air days in 30 yrs
- 3 days/yr
Risk factors via First Street. Map © Google.
Why this score? — see what drove the D grade
The composite is a weighted blend of 9 inputs, each scored 0–100. Each bar is that input's sub-score; the figure is the points it added to the 100-point composite (weight × sub-score).
- Cash flow +12.4/30.0
- ARV discount +7.5/15.0
- Appreciation +5.0/10.0
- DSCR +3.7/10.0
- Schools +3.6/10.0
- Livability +3.2/5.0
- 1% rule +2.5/10.0
- Rent growth +2.5/5.0
- Condition / age +2.5/5.0
$239,900
🖨 Deal sheet (PDF) 📄 Offer letter ✓ Due diligence
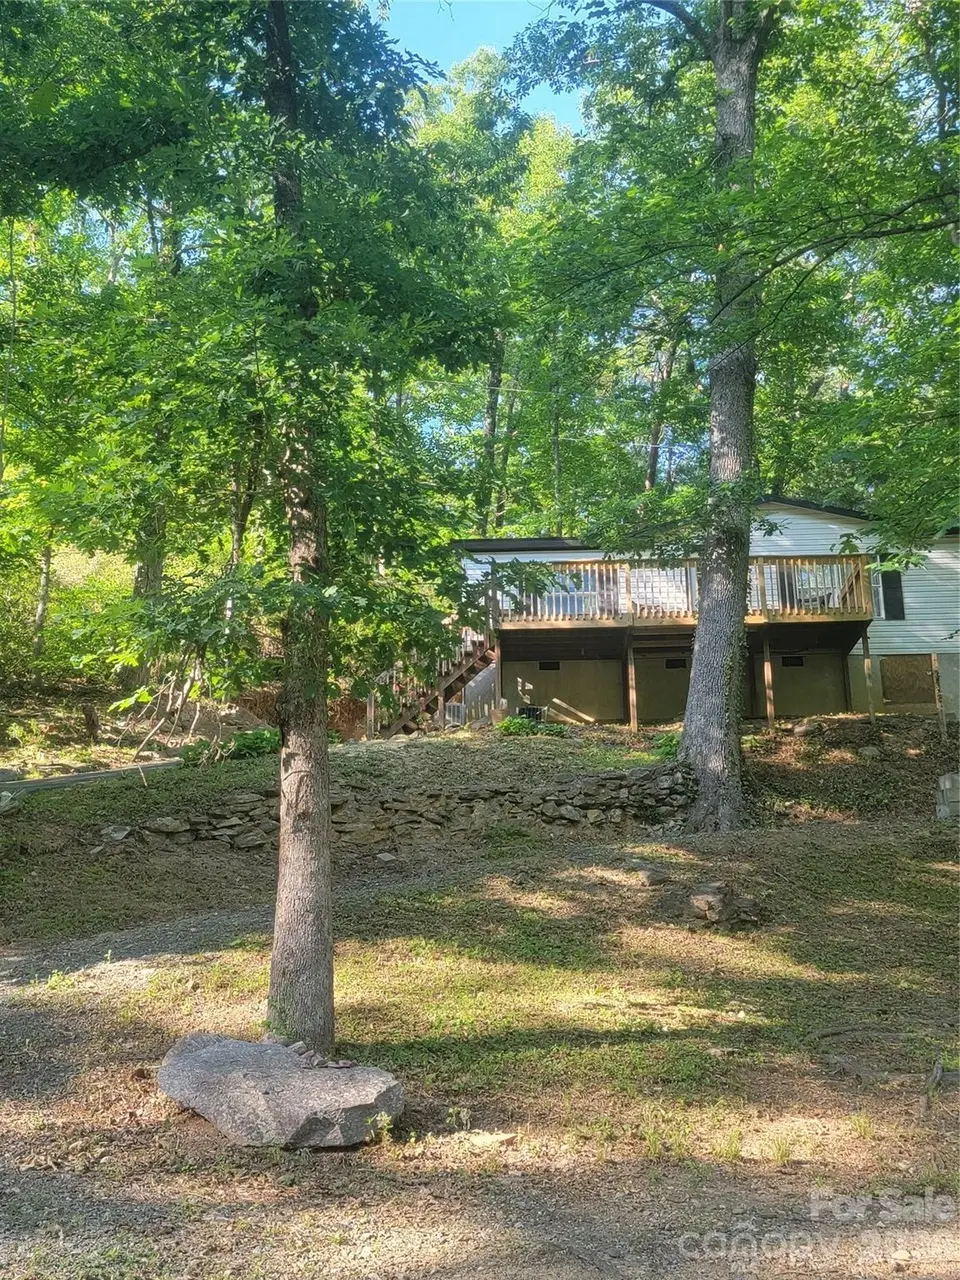
Listing remarks
Huge reduction. Lake Lure is open! Unbelievable location with Lake Lure Marina and Flowering Bridge gardens just steps away from end of Buddy Lane. Lake Lure to the left and Chimney Rock shops to the right, yet very private. Convenience and affordability. View of mountains from deck and bedrooms. Chimney and flag atop Chimney Rock Park visible from deck. This home sits on . 16 acre lot and has an extra lot that conveys that is . 22 acres for a total of . 37 acres. Home sits partially on additional lot. This home has a newer heat pump, permanent foundation and fresh decking boards. All this with the convenience of Chimney Rock water and Lake Lure sewer. This is a rare opportunity to own a 3/
Key facts
- Fresh decking boards
- Paved driveway
- Permanent foundation
Tags
Property features AI
Finance
- Other: Property allows manufactured homes; no additional restrictions noted; Has additional parcels; Zoning: R86B
- Financial info: No special investor or multifamily financial details provided
- HOA & community: No HOA
Exterior
- Parking: Driveway parking; Approximately 4 open parking spaces; Additional paved drive to the left (steep) and a more level parking area in the lower yard
- Utilities: City water; Public sewer; Cable available; Electricity connected
- Home design: Manufactured doublewide single-family residence; One story (single level); Completed development; Crawl space foundation
- Construction: Manufactured construction; Vinyl exterior; Composition roof
- Exterior features: Deck; Shed(s); Hilly lot; Asphalt and gravel driveway/road surface; Publicly maintained road access
Interior
- Kitchen: Electric range; Refrigerator; Counter and cabinet space (standard kitchen appliances included)
- Bedrooms: 3 bedrooms on the main level
- Flooring: Laminate flooring; Linoleum flooring
- Bathrooms: 2 full bathrooms on the main level
- Heating & cooling: Heat pump heating; Ceiling fans; Electric cooling
- Interior features: Open floor plan with 1 main living room (14' x 12'); Washer and dryer included; Electric range; Refrigerator
- Laundry & utility: Laundry located in common area (washer and dryer included)
Neighborhood map
What this means for you Summary
Snapshot
- This is a 3-bed/2.0-bath manufactured listed at $240k.
Deal economics
- At list price, monthly cash flow is $-39 ($-474/yr) — negative.
- To cash-flow at today's rent, offer at most $233k (2.9% below list).
- To meet the 1% rule (rent ≥ 1% of price), the offer needs to be $180k (25.0% below list).
- Recommended offer: $180k (25.0% below list) — sets the bar for 1% rule.
Location & tenants
- Location reads 63/100 on livability (#402 in NC) — a middle-class / working-renter tenant base. Strengths: crime A-, cost of living B+, housing B+; Watch: amenities F, commute F, health & safety F.
- Rutherford County Schools (rural): math 43% / reading 44% proficiency, ranked #98 of 178 in NC (top 55%) — families likely to look elsewhere, expect single-tenant / working-renter base with shorter leases; 60% free/reduced lunch — lower-income household profile, screen leases tightly.
- Zoned schools: Pinnacle Elementary School (math 32% / reading 37%, grade F, #835 of 1,410 statewide, top 62%, 234 students, 99% FRL); R-S Middle School (math 32% / reading 43%, grade F, #256 of 475 statewide, top 55%, 574 students, 100% FRL); R-S Central High School (math 62% / reading 42%, grade D+, #292 of 535 statewide, top 56%, 758 students, 100% FRL) — zoned schools average 99% FRL vs 60% district-wide (39 pts higher); higher-poverty schools than district average — tighter screening recommended.
- Market conditions: 7 active listings in the ZIP; 1 comparable units currently listed for rent nearby; 193 units permitted in Rutherford County in 2024 (0 in 5+ unit buildings).
Forward outlook
- In year one you build about $9k of equity ($2k loan paydown + $7k appreciation (3.0% local appreciation)).
- Rutherford County population projected at -17% by 2050 — secular population decline; favor cash flow + early exit over multi-decade hold.
- At projected returns (3.0% appreciation + 3.0% rent growth), your $67k cash investment doubles in ~7 years — after that, you're playing with house money.
- By year 4, paydown + projected appreciation supports a ~$30k cash-out refi (75% LTV) — recoverable capital for the next deal without selling this one.
Negotiation context
- It's been on market 23 days — a 2% lower offer ($236k) is reasonable based on typical stale-listing flexibility.
- 3 sale attempts since 2y ago; this cycle's ask has dropped $40k (14%) from the opening price — seller is motivated, your offer sets the floor, not the list.
- Current owner paid $69k; list at $240k implies a 248% gain — meaningful room to come down on a strong offer.
Risks & watch-outs
- Climate carrying-cost: extreme-heat days projected 8→21/yr by 2055 (HVAC capex compounding) — expect insurance premiums to compound above CPI over the hold.
Questions for the listing agent
- What do current leases actually rent for vs. the listed asking? Can we see a recent rent roll and the last 12 months of T-12 income?
- Is there a deadline driving the sale (1031 exchange, divorce, estate, relocation)? That informs how much negotiation room exists.
- Schools are D-rated, which usually means shorter tenancies and higher turnover. Who's the typical renter profile here, and what's been the actual vacancy rate?
- The area grade is low — what's the realistic commute time and amenity access for the typical tenant pool here? Any planned neighborhood developments (good or bad) we should know about?
- What's the average days-on-market for RENTAL listings here right now (not sales)? A rising rental-DOM trend means longer vacancies and softer asking-rent achievability than the comps imply.
- What's the recent tenant-quality profile in this submarket — average credit score on applications, eviction rate, late-payment / NSF rate, and stable-employment percentage? A property-management company in the area should have these aggregated.
- How much new for-sale + rental construction is in the pipeline within 1–3 miles? Heavy new supply typically softens prices + rents 12–24 months out; constrained supply supports both.
Investment metrics
- 1% rule
- 0.75% ✗
- Cap rate
- 6.10%
- Cash-on-cash
- -0.71%
- DSCR
- 0.97
- GRM
- 11.1
CMA / ARV
No comps found within radius.
Projected returns pro-forma
3.0% appreciation · 3.0% rent growth · sell at horizon
- IRR
- 6.8%
- Equity multiple
- 1.39×
- Total profit
- $26,291
- Equity at exit
- $107,869
- IRR
- 9.6%
- Equity multiple
- 2.44×
- Total profit
- $97,027
- Equity at exit
- $166,240
Cash invested: $67,172 (down + closing). Projections, not guarantees.
Landlord ↔ Tenant lean methodology
- Overall (STATE)
- 85 Strongly Landlord-Friendly
- State North Carolina
- 85 Strongly Landlord-Friendly · R+3
- County
- — inherits STATE
- City
- — inherits STATE
ZIP-level market 28720
- Active inventory
- 7
- Price-to-rent
- 11.1×
Monthly cashflow live
- Estimated rent
- $1,800 medium interval (Pro) →
- Mortgage (P&I)
- −$1,258
- Tax from tax record
- −$103 /mo · $1,242/yr
- Insurance
- −$100
- HOA
- −$0
- Vacancy / Maint / Mgmt
- −$378
- Net cashflow
- $-39
Break-even live
Sensitivity live
| Price | -10% $96 | -5% $28 | +0% $-39 | +5% $-107 | +10% $-175 |
|---|---|---|---|---|---|
| Rent | -10% $-182 | -5% $-111 | +0% $-39 | +5% $32 | +10% $103 |
| Rate | -1.0pp $81 | -0.5pp $22 | base $-39 | +0.5pp $-102 | +1.0pp $-165 |
UW: 25.0% down · 7.5% · 30yr · 1.5% tax · 5.0% vac · 8.0% maint · 8.0% mgmt
Financing live
Cash to close
- Down payment
- $59,975
- Closing costs
- $7,197
- Reserves months
- —
- Total cash needed
- —
Loan-product check · same deal, 3 products live
Conventional
25% down · 7.5% · 30yr
- Down + closing
- —
- Monthly P&I
- —
- Monthly cashflow
- —
- DSCR
- —
- Eligible?
- —
Personal DTI + credit; lowest rate.
DSCR
20% down · 8.5% · 30yr
- Down + closing
- —
- Monthly P&I
- —
- Monthly cashflow
- —
- DSCR
- —
- Eligible?
- —
No personal income docs; deal must DSCR.
Hard money
10% down · 12.0% · 12mo
- Down + closing
- —
- Monthly P&I
- —
- Monthly cashflow
- —
- DSCR
- —
- Eligible?
- —
Short-term bridge; refi at stabilization.
Rent comps 1 comps
| Address | Beds | Baths | Sqft | Rent | $/sqft | DOM | Units | Dist |
|---|---|---|---|---|---|---|---|---|
| 398 Main St Unit 2 Chimney Rock, NC | 2.0 | 1.0 | 870 | $1,800 | $2.07 | 15d | 1 | 0.63mi |
Listing history 22 events
-
2026-06-22days on market $239,900 Active 23 DOM
-
2026-06-19days on market $239,900 Active 21 DOM
-
2026-06-18days on market $239,900 Active 20 DOM
-
2026-06-17days on market $239,900 Active 19 DOM
-
2026-06-16days on market $239,900 Active 18 DOM
-
2026-06-15days on market $239,900 Active 17 DOM
-
2026-06-14days on market $239,900 Active 15 DOM
-
2026-06-13days on market $239,900 Active 14 DOM
-
2026-06-10days on market $239,900 Active 12 DOM
-
2026-06-09days on market $239,900 Active 11 DOM
-
2026-06-08days on market $239,900 Active 10 DOM
-
2026-06-07days on market $239,900 Active 9 DOM
-
2026-06-02days on market $239,900 Active 4 DOM
-
2026-06-01days on market $239,900 Active 3 DOM
-
2026-05-31days on market $239,900 Active 2 DOM
-
2026-05-30days on market $239,900 Active 1 DOM
-
2026-05-18price $239,900
-
2026-01-09price $259,900
-
2025-12-01$279,900 Active
-
2025-01-30$275,000 Active
-
2024-07-12$299,900 Active
-
2007-08-17soldstatus $69,000
ⓘ Source: listings_history table (triggers on properties + properties_extension) + one-shot
backfill from property_details.listing_events for pre-trigger history.
Tax reassessment forecast NC · Resets to sale price
- Current annual tax
- $1,242 · $103/mo
- Projected year-2 tax
- $1,967 · $164/mo
- Expected delta
- +$726/yr (+$60/mo · 58.4%)
ⓘ Screening estimate from a state-policy table — verify with the county assessor before closing.
Climate risk First Street
- Flood 1/10 Low FEMA zone X (unshaded) · 0% chance over 30 yrs
- Wildfire 4/10 Moderate
- Heat 5/10 Major 8 d/yr ≥102°F today · 21 d/yr by 30 yrs out
- Wind 2/10 Low
- Air quality 3/10 Moderate 3 unhealthy d/yr today · 3 by 30 yrs out
Nearby sold comps map
Loading sold comps map…
Walkable amenities ~0.75 mi
Loading nearby amenities…
Taxation est. · year 1
- Rental income
- $21,600
- − Mortgage interest
- −$13,438
- − Property taxes
- −$1,242
- − Insurance
- −$1,200
- − Repairs & maintenance
- −$1,728
- − Management
- −$1,728
- − Depreciation
- −$6,979
- Taxable loss
- −$4,714
- Est. tax savings @ 24.0%
- +$1,131
- After-tax cash flow
- $658/yr
For passive investors: Depreciation is non-cash, so a rental often shows a tax loss while cash-flowing — sheltering income. Rental losses are passive: they offset passive income freely, and up to $25,000/yr can offset ordinary (W-2) income if you actively participate and your MAGI is under $100k (phasing out to $0 by $150k); unused losses carry forward. On sale, claimed depreciation is recaptured at up to 25%, and gains may owe capital-gains tax (a 1031 exchange can defer both). Figures are a year-1 estimate at your 24.0% rate — not tax advice; consult a CPA.
Schools (NCES district)
- District
- Rutherford County Schools
- NCES district ID
- 3704080
- Math proficiency
- 43% ▼ -1.00%
- Reading proficiency
- 44% ▼ -2.00%
- Median HH income
- $36,490
- Composite
- 36.11/100
- National rank
- #4753
- State rank
- #98 of 178 in NC
Livability — Chimney Rock Village
- Score
- 63/100
- State rank
- #402
- US rank
- #15350
Category grades
Schools grade is shown separately in the Schools card above.
Census & demographics
- Census place
- Chimney Rock Village, NC
- Population (ZIP)
- 135
Population outlook (Rutherford County) Hauer SSP2
- Today (2025)
- 63,695 people
- By 2030
- 61,670 · -3.2%
- By 2040
- 57,212 · -10.2%
- By 2050
- 52,763 · -17.2%
- By 2075
- 44,493 · -30.1%
- By 2100
- 38,127 · -40.1%
Race, ethnicity, and origin ACS 2023
- Neighborhood character
- Predominantly White (100%)
- Race & ethnicity
- White 100%
- Common ancestry
- Slovak 27% Romanian 4% Serbian 3%
- Foreign-born
- 1%
- Languages at home
- 93% English-only · Spanish 6% Other Indo-European 1%
Political lean MEDSL · Rutherford
- 2024 margin
- Solid R (+47.8) · D 25.8% · R 73.6%
- 2008→2024 swing
- -16.0pp toward R · 2008: -31.8pp · 2024: -47.8pp
- All cycles
- 2024: R+47.8 2020: R+45.8 2016: R+47.9 2012: R+33.5 2008: R+31.8
Not yet ingested
- Civics
- —
Market trends
- HPI YoY
- —
- Current HPI
- —
- Rent YoY
- —
- Metro
- —
- State GDP YoY
- ▲ 3.28%
- F500 in state
- 26
Industry mix (Fortune 500 HQ in NC)
| Industry | F500 HQs | Revenue |
|---|---|---|
| Financial Services | 2 | $213B |
|
||
| Retail | 2 | $95B |
|
||
| Industrial Conglomerate | 1 | $38B |
|
||
| Metals / Steel | 1 | $35B |
|
||
| Utilities | 1 | $30B |
|
||
| Industrial Machinery | 1 | $19B |
|
||
Price history
+247.7% since first listed6 events — show timeline
- 2026-05-18 Price Changed $239,900 CANOPYMLS as Distributed by MLS Grid
- 2026-01-09 Price Changed $259,900 CANOPYMLS as Distributed by MLS Grid
- 2025-12-01 Listed $279,900 CANOPYMLS as Distributed by MLS Grid
- 2025-01-30 Listed $275,000 CANOPYMLS as Distributed by MLS Grid
- 2024-07-12 Listed $299,900 CANOPYMLS as Distributed by MLS Grid
- 2007-08-17 Sold (Public Records) $69,000 Public Records
Property tax history
+8.7%/yrLatest (2025): $1,242 · +15.0% YoY. Source: county tax records.
Cash-flow waterfall
monthlySold comps — $/sqft
last 12 mo · ≤1 miLoading sold comps…