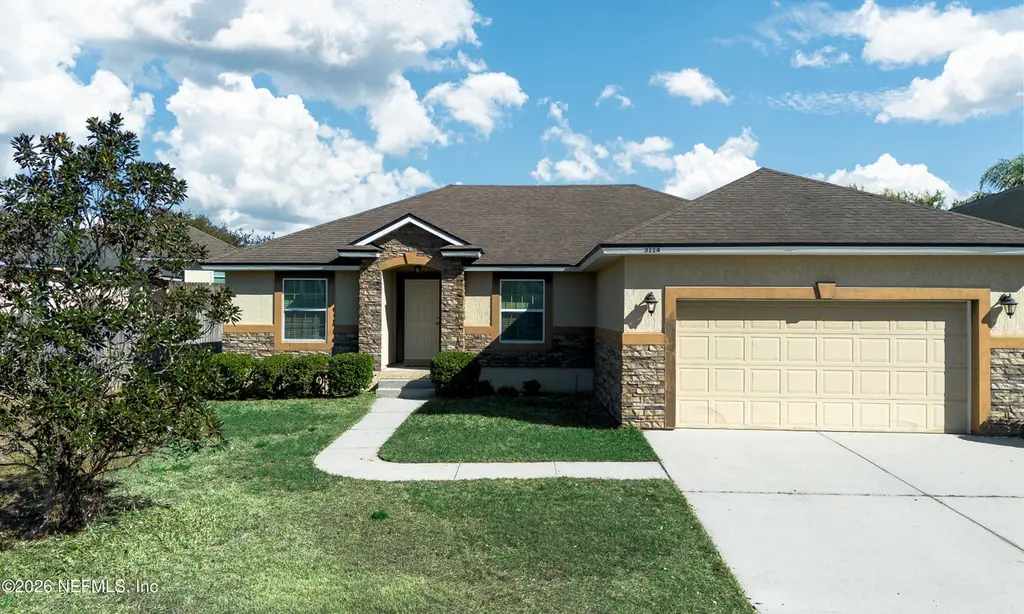
3114 Zeyno Dr · Middleburg, FL
Flood risk 1/10 · Minimal
- FEMA flood zone
- X (unshaded)
- Chance of flooding over 30 yrs
- 0.0%
- Est. flood insurance / yr
- $507 – $1,088
Fire risk 6/10 · Moderate
- Est. fire insurance / yr
- $947 – $1,759
Heat risk 8/10 · Major
- Hot days now (above 108°F)
- 7 days/yr
- Hot days in 30 yrs
- 19 days/yr
Wind risk 9/10 · Severe
- Chance of severe wind over 30 yrs
- 99.0%
Air-quality risk 3/10 · Minor
- Unhealthy air days now
- 3 days/yr
- Unhealthy air days in 30 yrs
- 3 days/yr
Risk factors via First Street. Map © Google.
Why this score? — see what drove the D grade
The composite is a weighted blend of 9 inputs, each scored 0–100. Each bar is that input's sub-score; the figure is the points it added to the 100-point composite (weight × sub-score).
- Cash flow +12.7/30.0
- ARV discount +7.1/15.0
- Schools +5.1/10.0
- DSCR +3.8/10.0
- Rent growth +3.3/5.0
- Livability +3.2/5.0
- 1% rule +2.8/10.0
- Condition / age +2.5/5.0
- Appreciation +0.0/10.0
$289,000
🖨 Deal sheet (PDF) 📄 Offer letter ✓ Due diligence
Listing remarks
Welcome to this beautifully maintained 3-bedroom, 2-bathroom home located in a quiet, well-kept community. Property features a desirable split floorplan, offering both comfort and privacy. Pride of ownership is evident throughout, making this home truly move-in ready. Enjoy the added benefits of NO CDD fees and a low HOA, helping keep your monthly costs down. Conveniently located just minutes from top-rated Clay County schools, local parks, shopping, dining, and with easy access to major highways for an easy commute. This well-cared-for home offers the perfect combination of location, value, and lifestyle. Don't miss the opportunity to make it yours!
Key facts
- 8,712 sq ft lot
- 2 garage spots
- Built 2013
Property features AI
Finance
- HOA & community: Has association (The Retreat); Association fee $350 annually
Exterior
- Parking: Garage; 2-car garage
- Security: Fire alarm
- Utilities: Public sewer; Electricity connected; Cable available
- Home design: Single family residence; One story
- Construction: Shingle roof
- Exterior features: Asphalt road surface
Interior
- Kitchen: Dishwasher; Electric range; Refrigerator; Electric water heater
- Bedrooms: 3 bedrooms
- Flooring: Carpet; Laminate
- Bathrooms: 2 full bathrooms
- Heating & cooling: Central heating; Central air conditioning
- Interior features: Fire alarm; Unfurnished
Neighborhood map
What this means for you Summary
Snapshot
- This is a 3-bed/2.0-bath single-family listed at $289k.
Deal economics
- At list price, monthly cash flow is $-32 ($-381/yr) — negative.
- To cash-flow at today's rent, offer at most $283k (1.9% below list).
- To meet the 1% rule (rent ≥ 1% of price), the offer needs to be $226k (21.7% below list).
- Recommended offer: $226k (21.7% below list) — sets the bar for 1% rule.
- Cap rate 6.2% vs local median 3.8% in Middleburg — top-decile yield for the area; either an underpriced asset or a hidden risk that comps aren't pricing in. Stress-test before assuming the spread holds.
Location & tenants
- Location reads 65/100 on livability (#657 in FL) — a middle-class / working-renter tenant base. Strengths: cost of living A+, housing A+; Watch: amenities F, commute F, health & safety F.
- Clay (suburban): math 58% / reading 59% proficiency, ranked #14 of 73 in FL (top 19%) — acceptable for families but not a draw, mixed tenant base, ~2y average lease.
- Zoned schools: Shadowlawn Elementary School (math 70% / reading 63%, grade B+, #473 of 2,144 statewide, top 23%, 735 students, 49% FRL); Lake Asbury Junior High School (math 65% / reading 58%, grade B+, #124 of 571 statewide, top 22%, 1,037 students, 41% FRL); Middleburg High School (math 41% / reading 52%, grade D-, #216 of 667 statewide, top 33%, 1,852 students, 47% FRL).
- Market conditions: Rents rising (+3.4%/yr); 609 active listings in the ZIP; 5 comparable units currently listed for rent nearby; rentals at typical pace (median 20d on market — plan ~3-4 weeks tenant-placement turnaround); solid renter incomes; 1,876 units permitted in Clay County in 2024 (14 in 5+ unit buildings).
- This rent runs 32% of the median local income ($84k/yr) — at the standard rent-burdened threshold; future hikes will face affordability resistance.
Forward outlook
- Local home prices are declining (-3.0%/yr); year-one equity from $2k of loan paydown is wiped out by about $9k of value loss. Plan a longer hold.
- Clay County population projected at +19% by 2050 — long-run rental-demand tailwind backs the buy-and-hold thesis.
Negotiation context
- It's been on market 106 days — a 9% lower offer ($263k) is reasonable based on typical stale-listing flexibility.
- Current owner paid $13k; list at $289k implies a 2123% gain — meaningful room to come down on a strong offer.
Risks & watch-outs
- Climate carrying-cost: severe wind risk, 99% chance of damaging wind over 30y; major wildfire risk; extreme-heat days projected 7→19/yr by 2055 (HVAC capex compounding) — expect insurance premiums to compound above CPI over the hold.
Questions for the listing agent
- What do current leases actually rent for vs. the listed asking? Can we see a recent rent roll and the last 12 months of T-12 income?
- It's been on market 106 days. Have you received any prior offers? Is the seller open to a 22% concession, seller financing, or rate buy-down credit?
- What does the HOA fee cover, when was the last increase, and are there any pending special assessments or reserve-fund shortfalls?
- Why hasn't it sold? Are there any deal-killer items the seller is aware of (foundation, flood, title, zoning, code violations)?
- Is there a deadline driving the sale (1031 exchange, divorce, estate, relocation)? That informs how much negotiation room exists.
- Schools are B-rated — typically a magnet for longer-tenancy family renters. What's the average tenant stay here, and is there a school-zone premium baked into asking?
- The area grade is low — what's the realistic commute time and amenity access for the typical tenant pool here? Any planned neighborhood developments (good or bad) we should know about?
- What's the average days-on-market for RENTAL listings here right now (not sales)? A rising rental-DOM trend means longer vacancies and softer asking-rent achievability than the comps imply.
- What's the recent tenant-quality profile in this submarket — average credit score on applications, eviction rate, late-payment / NSF rate, and stable-employment percentage? A property-management company in the area should have these aggregated.
- How much new for-sale + rental construction is in the pipeline within 1–3 miles? Heavy new supply typically softens prices + rents 12–24 months out; constrained supply supports both.
Investment metrics
- 1% rule
- 0.78% ✗
- Cap rate
- 6.16%
- Cash-on-cash
- -0.47%
- DSCR
- 0.98
- GRM
- 10.6
CMA / ARV
- ARV (on-the-fly)
- $286,224
- Comps found
- 12
Show comp detail 12 sales within ~0.75 mi
| Address | Dist | Beds/Ba | Sqft | Sold | Price | $/sf | Match |
|---|---|---|---|---|---|---|---|
| 3255 Ginny Lake Dr | 0.13mi | 4/2.0 (+1) | 1,638 (+2%) | 2mo | $310,000 | $189 | 84 |
| 3104 Zeyno Dr | 0.03mi | 4/2.0 (+1) | 1,750 (+9%) | 8mo | $282,000 | $161 | 72 |
| 3012 Sunset Ridge Dr | 0.33mi | 3/2.0 | 1,620 (+1%) | 14mo | $275,000 | $170 | 72 |
| 4035 Edgeland Trl | 0.25mi | 3/2.0 | 1,649 (+2%) | 15mo | $300,000 | $182 | 71 |
| 3225 Ginny Lake Dr | 0.09mi | 3/2.0 | 1,787 (+11%) | 7mo | $310,000 | $173 | 71 |
| 3167 Pine Haven Dr | 0.03mi | 4/2.0 (+1) | 1,760 (+10%) | 11mo | $303,000 | $172 | 68 |
| 3251 Ginny Lake Dr | 0.12mi | 4/2.0 (+1) | 1,772 (+10%) | 6mo | $344,000 | $194 | 67 |
| 3228 Deer Creek Dr | 0.11mi | 4/2.0 (+1) | 1,758 (+9%) | 11mo | $330,000 | $188 | 66 |
| 2828 Ravine Hill Dr | 0.19mi | 3/2.0 | 1,782 (+11%) | 17mo | $279,500 | $157 | 59 |
| 2779 Windemere Ct | 0.49mi | 3/4.0 | 1,678 (+4%) | 6mo | $332,000 | $198 | 57 |
| 2832 Ravine Hill Dr | 0.19mi | 4/2.0 (+1) | 1,821 (+13%) | 13mo | $305,000 | $167 | 54 |
| 2644 Ravine Hill Dr | 0.21mi | 4/2.0 (+1) | 1,821 (+13%) | 13mo | $324,000 | $178 | 53 |
Match score weights: distance 35% · size 25% · config 20% · recency 20%. Top-matched comps best support the ARV.
Projected returns pro-forma
-3.0% appreciation · 3.35% rent growth · sell at horizon
- IRR
- -16.8%
- Equity multiple
- 0.41×
- Total profit
- $-48,130
- Equity at exit
- $43,091
- IRR
- -8.1%
- Equity multiple
- 0.49×
- Total profit
- $-41,515
- Equity at exit
- $24,987
Cash invested: $80,920 (down + closing). Projections, not guarantees.
Landlord ↔ Tenant lean methodology
- Overall (STATE)
- 87 Strongly Landlord-Friendly
- State Florida
- 87 Strongly Landlord-Friendly · R+3
- County
- — inherits STATE
- City
- — inherits STATE
ZIP-level market 32068
- Home prices YoY
- -27.5%
- Rents YoY
- 3.4%
- Active inventory
- 609
- Price-to-rent
- 10.6×
Monthly cashflow live
- Estimated rent
- $2,263 high interval (Pro) →
- Mortgage (P&I)
- −$1,516
- Tax from tax record
- −$155 /mo · $1,858/yr
- Insurance
- −$120
- HOA
- −$29
- Lot rent
- −$0
- Vacancy / Maint / Mgmt
- −$475
- Net cashflow
- $-32
Break-even live
Sensitivity live
| Price | -10% $132 | -5% $50 | +0% $-32 | +5% $-114 | +10% $-195 |
|---|---|---|---|---|---|
| Rent | -10% $-211 | -5% $-121 | +0% $-32 | +5% $58 | +10% $147 |
| Rate | -1.0pp $114 | -0.5pp $42 | base $-32 | +0.5pp $-107 | +1.0pp $-183 |
UW: 25.0% down · 7.5% · 30yr · 1.5% tax · 5.0% vac · 8.0% maint · 8.0% mgmt
Financing live
Cash to close
- Down payment
- $72,250
- Closing costs
- $8,670
- Reserves months
- —
- Total cash needed
- —
Loan-product check · same deal, 3 products live
Conventional
25% down · 7.5% · 30yr
- Down + closing
- —
- Monthly P&I
- —
- Monthly cashflow
- —
- DSCR
- —
- Eligible?
- —
Personal DTI + credit; lowest rate.
DSCR
20% down · 8.5% · 30yr
- Down + closing
- —
- Monthly P&I
- —
- Monthly cashflow
- —
- DSCR
- —
- Eligible?
- —
No personal income docs; deal must DSCR.
Hard money
10% down · 12.0% · 12mo
- Down + closing
- —
- Monthly P&I
- —
- Monthly cashflow
- —
- DSCR
- —
- Eligible?
- —
Short-term bridge; refi at stabilization.
Rent comps 5 comps
| Address | Beds | Baths | Sqft | Rent | $/sqft | DOM | Units | Dist |
|---|---|---|---|---|---|---|---|---|
| 3107 Zeyno Dr Middleburg, FL | 4.0 | 2.5 | 1791 | $2,100 | $1.17 | 26d | 1 | 0.06mi |
| 2738 Ravine Hill Dr Middleburg, FL | 4.0 | 2.0 | 1872 | $2,179 | $1.16 | 5d | 1 | 0.21mi |
| 3627 County Road 218 Middleburg, FL | 3.0 | 2.0 | 2008 | $2,995 | $1.49 | 19d | 1 | 0.59mi |
| 2930 Ravines Rd Middleburg, FL | 2.0 | 2.0 | 1268 | $1,599 | $1.26 | 26d | 1 | 0.61mi |
| 1637 Ascend Ln Middleburg, FL | 1.0–3.0 | 1.0–2.0 | 1204 | $2,129 | $1.77 | 0d | 9 | 1.20mi |
HOA detail
- Monthly dues
- $29 · $348/yr
Listing history 18 events
-
2026-06-22days on market $289,000 Active 106 DOM
-
2026-06-21pricedays on market $289,000 Active 105 DOM
-
2026-06-18days on market $292,000 Active 102 DOM
-
2026-06-17days on market $292,000 Active 101 DOM
-
2026-06-16days on market $292,000 Active 100 DOM
-
2026-06-15days on market $292,000 Active 99 DOM
-
2026-06-13days on market $292,000 Active 97 DOM
-
2026-06-13days on market $292,000 Active 96 DOM
-
2026-06-09days on market $292,000 Active 93 DOM
-
2026-06-08days on market $292,000 Active 92 DOM
-
2026-06-07days on market $292,000 Active 91 DOM
-
2026-06-03days on market $292,000 Active 87 DOM
-
2026-06-02pricedays on market $292,000 Active 86 DOM
-
2026-06-01days on market $295,000 Active 85 DOM
-
2026-05-31days on market $295,000 Active 84 DOM
-
2026-04-02price $295,000
-
2026-03-07$298,000 Active
-
2012-11-19soldstatus $13,000
ⓘ Source: listings_history table (triggers on properties + properties_extension) + one-shot
backfill from property_details.listing_events for pre-trigger history.
Tax reassessment forecast FL · Resets to sale price
- Current annual tax
- $1,858 · $155/mo
- Projected year-2 tax
- $2,399 · $200/mo
- Expected delta
- +$540/yr (+$45/mo · 29.1%)
ⓘ Screening estimate from a state-policy table — verify with the county assessor before closing.
Climate risk First Street
- Flood 1/10 Low FEMA zone X (unshaded) · 0% chance over 30 yrs
- Wildfire 6/10 Major
- Heat 8/10 Severe 7 d/yr ≥108°F today · 19 d/yr by 30 yrs out
- Wind 9/10 Extreme 99% chance of damaging wind over 30 yrs
- Air quality 3/10 Moderate 3 unhealthy d/yr today · 3 by 30 yrs out
Nearby sold comps map
Loading sold comps map…
Walkable amenities ~0.75 mi
Loading nearby amenities…
Taxation est. · year 1
- Rental income
- $27,160
- − Mortgage interest
- −$16,188
- − Property taxes
- −$1,858
- − Insurance
- −$1,445
- − Repairs & maintenance
- −$2,173
- − Management
- −$2,173
- − HOA
- −$348
- − Depreciation
- −$8,407
- Taxable loss
- −$5,433
- Est. tax savings @ 24.0%
- +$1,304
- After-tax cash flow
- $922/yr
For passive investors: Depreciation is non-cash, so a rental often shows a tax loss while cash-flowing — sheltering income. Rental losses are passive: they offset passive income freely, and up to $25,000/yr can offset ordinary (W-2) income if you actively participate and your MAGI is under $100k (phasing out to $0 by $150k); unused losses carry forward. On sale, claimed depreciation is recaptured at up to 25%, and gains may owe capital-gains tax (a 1031 exchange can defer both). Figures are a year-1 estimate at your 24.0% rate — not tax advice; consult a CPA.
Schools (NCES district)
- District
- Clay
- NCES district ID
- 1200300
- Math proficiency
- 58% ▼ -8.00%
- Reading proficiency
- 59% ▼ -3.00%
- Median HH income
- $59,379
- Composite
- 50.73/100
- National rank
- #1815
- State rank
- #14 of 73 in FL
Livability — Middleburg
- Score
- 65/100
- State rank
- #657
- US rank
- #13174
Category grades
Schools grade is shown separately in the Schools card above.
Census & demographics
- County
- Clay County · 208,450 people
- City population
- 58,983
- Metro
- Jacksonville, FL
- Population (ZIP)
- 58,983
- Household income
- $84,431
- Rent vs Own
- Severe rent burden
- 975.0
Population outlook (Clay County) Hauer SSP2
- Today (2025)
- 230,495 people
- By 2030
- 242,427 · +5.2%
- By 2040
- 262,244 · +13.8%
- By 2050
- 275,148 · +19.4%
- By 2075
- 295,397 · +28.2%
- By 2100
- 287,592 · +24.8%
Race, ethnicity, and origin ACS 2023
- Neighborhood character
- Predominantly White (74%)
- Race & ethnicity
- White 74% Hispanic / Latino 13% Two or more races 10% Black 7%
- Hispanic origin (detail)
- Mexican 2% Puerto Rican 5%
- Common ancestry
- Slovak 2% Romanian 2% Lithuanian 2%
- Foreign-born
- 7% · Canada, Jamaica
- Languages at home
- 87% English-only · Spanish 9% Arabic 1% German/W. Germanic 1%
Political lean MEDSL · Clay
- 2024 margin
- Solid R (+39.3) · D 29.9% · R 69.2%
- 2008→2024 swing
- +3.6pp toward D · 2008: -42.8pp · 2024: -39.3pp
- All cycles
- 2024: R+39.3 2020: R+37.1 2016: R+44.3 2012: R+45.8 2008: R+42.8
Not yet ingested
- Civics
- —
Market trends
- HPI YoY
- ▼ -115.99%
- Current HPI
- 305.2531
- Rent YoY
- ▲ 3.35%
- Metro
- Jacksonville, FL
- State GDP YoY
- ▲ 3.28%
- F500 in state
- 36
Industry mix (Fortune 500 HQ in FL)
| Industry | F500 HQs | Revenue |
|---|---|---|
| Industrial Technology | 2 | $29B |
|
||
| Insurance | 2 | $17B |
|
||
| Retail | 1 | $60B |
|
||
| Technology Distribution | 1 | $58B |
|
||
| Homebuilding | 1 | $35B |
|
||
| Technology Manufacturing | 1 | $35B |
|
||
Price history
+2169.2% since first listed3 events — show timeline
- 2026-04-02 Price Changed $295,000 realMLS
- 2026-03-07 Listed $298,000 realMLS
- 2012-11-19 Sold (Public Records) $13,000 Public Records
Property tax history
+2.9%/yrLatest (2025): $1,858 · +4.2% YoY. Source: county tax records.
Cash-flow waterfall
monthlySold comps — $/sqft
last 12 mo · ≤1 miLoading sold comps…