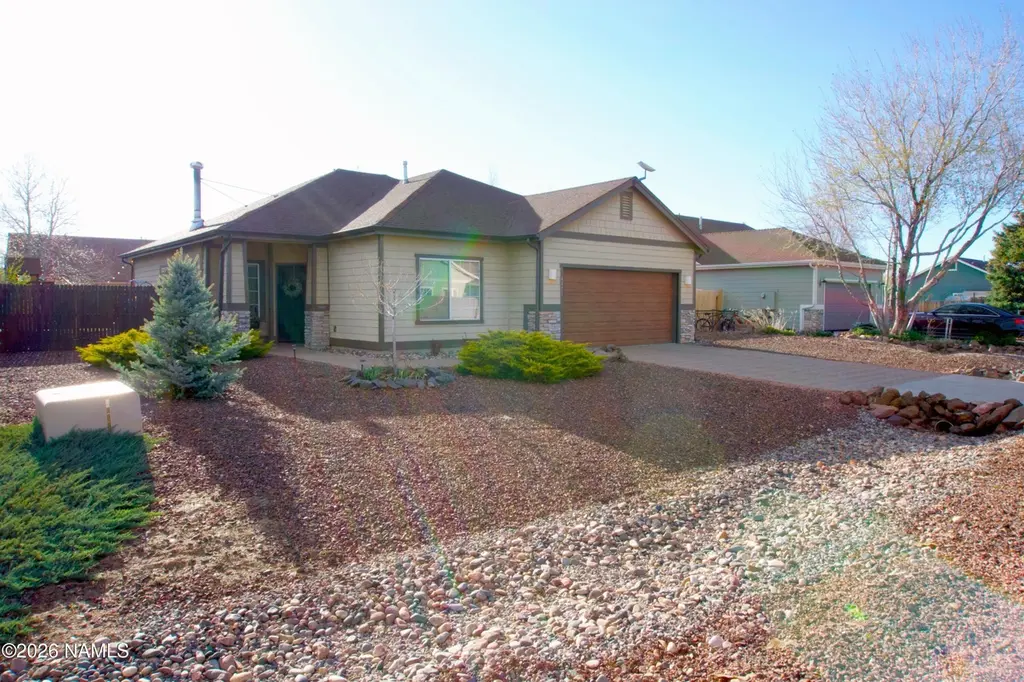
4471 Deer Springs Dr · Bellemont, AZ
Flood risk 3/10 · Minor
- FEMA flood zone
- X (unshaded)
- Chance of flooding over 30 yrs
- 0.2%
- Est. flood insurance / yr
- $507 – $1,088
Fire risk 8/10 · Major
- Est. fire insurance / yr
- $610 – $1,132
Heat risk 2/10 · Minimal
- Hot days now (above 86°F)
- 8 days/yr
- Hot days in 30 yrs
- 21 days/yr
Wind risk 1/10 · Minimal
- Chance of severe wind over 30 yrs
- —
Air-quality risk 2/10 · Minimal
- Unhealthy air days now
- 1 days/yr
- Unhealthy air days in 30 yrs
- 1 days/yr
Risk factors via First Street. Map © Google.
Why this score? — see what drove the D- grade
The composite is a weighted blend of 9 inputs, each scored 0–100. Each bar is that input's sub-score; the figure is the points it added to the 100-point composite (weight × sub-score).
- Cash flow +11.7/30.0
- ARV discount +9.1/15.0
- DSCR +3.5/10.0
- Appreciation +3.5/10.0
- 1% rule +2.5/10.0
- Rent growth +2.5/5.0
- Livability +2.5/5.0
- Condition / age +2.5/5.0
- Schools +2.1/10.0
$545,000
🖨 Deal sheet 📄 Offer letter ✓ Due diligence
Listing remarks
4471 Deer Springs Rd offers the Northern Arizona lifestyle desired by many! Located in the Flagstaff Meadows community of Bellemont, this 3 bedroom, 2 bathroom home sits on a . 19 acre lot just 13 minutes west of Flagstaff and offers access to outdoor adventure, open skies, and the beauty of Coconino National Forest. Inside, the 1,418 square foot floor plan feels comfortable, functional, and easy to live in. The kitchen features a new range and dishwasher installed in 2025, and new ceiling fans add a fresh touch throughout the home. The attached 2 car garage offers added versatility with an insulated garage door, garage heater, and bookshelves that convey with the property. The backyard is
Key facts
- New ceiling fans
- New dishwasher
- Garage heater
Tags
Property features AI
Finance
- HOA & community: Part of Flagstaff Meadows POA; Monthly association fee of $72; Playground in the community
Exterior
- Parking: Attached 2-car garage; RV access/parking; Garage door opener
- Security: Smoke detectors
- Utilities: Electricity available; Natural gas available
- Home design: Single-family residence; One story
- Construction: Slab foundation
- Exterior features: Partial fencing; Workshop; Level lot; Mountain and forest views; Paved, publicly maintained road
Interior
- Kitchen: Gas range; ENERGY STAR qualified refrigerator
- Flooring: Carpet; Laminate
- Bathrooms: 2 bathrooms
- Heating & cooling: Natural gas forced-air heating; Ceiling fans; Wall/window cooling units
- Interior features: Eat-in kitchen; Pantry; Smart thermostat; Breakfast bar; Double pane windows with aluminum frames; Wood burning stove
- Laundry & utility: Hall laundry
Neighborhood map
What this means for you Summary
Snapshot
- This is a 3-bed/2.0-bath single-family listed at $545k.
Deal economics
- At list price, monthly cash flow is $-156 ($-2k/yr) — negative.
- To cash-flow at today's rent, offer at most $518k (5.0% below list).
- To meet the 1% rule (rent ≥ 1% of price), the offer needs to be $406k (25.4% below list).
- Recommended offer: $406k (25.4% below list) — sets the bar for 1% rule.
Location & tenants
- Location reads: area grade D — affects rentability + tenant quality, not the cash-flow math above.
- Flagstaff Unified District (4192) (urban): math 18% / reading 29% proficiency, ranked #158 of 249 in AZ (top 64%) — low school quality limits family demand, transient renter base, plan for 1-2y turnover.
- Market conditions: 45 active listings in the ZIP; 698 units permitted in Coconino County in 2024 (354 in 5+ unit buildings).
Forward outlook
- Local home prices are declining (-2.9%/yr); year-one equity from $4k of loan paydown is wiped out by about $16k of value loss. Plan a longer hold.
- Coconino County population projected at +20% by 2050 — long-run rental-demand tailwind backs the buy-and-hold thesis.
Negotiation context
- It's been on market 38 days — a 3% lower offer ($529k) is reasonable based on typical stale-listing flexibility.
- 2 sale attempts with the ask held roughly flat each time — persistent listings suggest the price (not the market) is what's stuck; bring a comps-based counter.
Risks & watch-outs
- Climate carrying-cost: severe wildfire risk — expect insurance premiums to compound above CPI over the hold.
Questions for the listing agent
- What do current leases actually rent for vs. the listed asking? Can we see a recent rent roll and the last 12 months of T-12 income?
- It's been on market 38 days. Have you received any prior offers? Is the seller open to a 25% concession, seller financing, or rate buy-down credit?
- What does the HOA fee cover, when was the last increase, and are there any pending special assessments or reserve-fund shortfalls?
- Is there a deadline driving the sale (1031 exchange, divorce, estate, relocation)? That informs how much negotiation room exists.
- The area grade is low — what's the realistic commute time and amenity access for the typical tenant pool here? Any planned neighborhood developments (good or bad) we should know about?
- What's the average days-on-market for RENTAL listings here right now (not sales)? A rising rental-DOM trend means longer vacancies and softer asking-rent achievability than the comps imply.
- What's the recent tenant-quality profile in this submarket — average credit score on applications, eviction rate, late-payment / NSF rate, and stable-employment percentage? A property-management company in the area should have these aggregated.
- How much new for-sale + rental construction is in the pipeline within 1–3 miles? Heavy new supply typically softens prices + rents 12–24 months out; constrained supply supports both.
Investment metrics
- 1% rule
- 0.75% ✗
- Cap rate
- 5.95%
- Cash-on-cash
- -1.22%
- DSCR
- 0.95
- GRM
- 11.2
CMA / ARV
- ARV (median comp)
- $564,661
- List price
- $545,000
- Delta
- -3.48%
- Verdict
- FAIR
- Comps
- 20 within 1.0 mi
Show comp detail 12 sales within ~0.75 mi
| Address | Dist | Beds/Ba | Sqft | Sold | Price | $/sf | Match |
|---|---|---|---|---|---|---|---|
| 4581 Alpine Dr | 0.09mi | 3/2.0 | 1,427 (+1%) | 10mo | $550,000 | $385 | 87 |
| 11721 Pegasus Rd | 0.24mi | 3/2.0 | 1,387 (-2%) | 3mo | $529,000 | $381 | 83 |
| 11600 W Cove Crest Dr | 0.17mi | 3/2.0 | 1,455 (+3%) | 9mo | $545,000 | $375 | 80 |
| 11507 W Cove Crest Dr | 0.17mi | 3/2.0 | 1,539 (+8%) | 2mo | $560,000 | $364 | 77 |
| 4323 Deer Springs Dr | 0.09mi | 3/2.0 | 1,524 (+8%) | 9mo | $599,000 | $393 | 75 |
| 4675 Cygnus Rd | 0.39mi | 3/2.0 | 1,396 (-2%) | 5mo | $509,900 | $365 | 75 |
| 11780 Pegasus Rd | 0.23mi | 3/2.0 | 1,561 (+10%) | 2mo | $580,000 | $372 | 71 |
| 12311 Pegasus Rd | 0.56mi | 3/2.0 | 1,380 (-3%) | 1mo | $486,000 | $352 | 69 |
| 11950 Pegasus Rd | 0.34mi | 3/2.0 | 1,572 (+11%) | 7mo | $569,000 | $362 | 60 |
| 12361 Pegasus Rd | 0.57mi | 3/2.5 | 1,540 (+9%) | 3mo | $480,000 | $312 | 55 |
| 11901 Pegasus Rd | 0.32mi | 3/2.5 | 1,624 (+14%) | 7mo | $520,000 | $320 | 53 |
| 12235 Perseus Rd | 0.55mi | 3/2.5 | 1,624 (+14%) | 0mo | $520,000 | $320 | 48 |
Match score weights: distance 35% · size 25% · config 20% · recency 20%. Top-matched comps best support the ARV.
Projected returns pro-forma
-2.91% appreciation · 3.0% rent growth · sell at horizon
- IRR
- -17.8%
- Equity multiple
- 0.37×
- Total profit
- $-96,333
- Equity at exit
- $83,466
- IRR
- -10.1%
- Equity multiple
- 0.37×
- Total profit
- $-95,630
- Equity at exit
- $50,916
Cash invested: $152,600 (down + closing). Projections, not guarantees.
Landlord ↔ Tenant lean methodology
- Overall (STATE)
- 87 Strongly Landlord-Friendly
- State Arizona
- 87 Strongly Landlord-Friendly · R+3
- County
- — inherits STATE
- City
- — inherits STATE
ZIP-level market 86015
- Home prices YoY
- -1.3%
- Active inventory
- 45
- Price-to-rent
- 11.2×
Monthly cashflow live
- Estimated rent
- $4,064 medium interval (Pro) →
- Mortgage (P&I)
- −$2,858
- Tax from tax record
- −$209 /mo · $2,506/yr
- Insurance
- −$227
- HOA
- −$72
- Vacancy / Maint / Mgmt
- −$853
- Net cashflow
- $-156
Break-even live
UW: 25.0% down · 7.5% · 30yr · 1.5% tax · 5.0% vac · 8.0% maint · 8.0% mgmt
Financing live
Cash to close
- Down payment
- $136,250
- Closing costs
- $16,350
- Reserves months
- —
- Total cash needed
- —
Loan-product check · same deal, 3 products live
Conventional
25% down · 7.5% · 30yr
- Down + closing
- —
- Monthly P&I
- —
- Monthly cashflow
- —
- DSCR
- —
- Eligible?
- —
Personal DTI + credit; lowest rate.
DSCR
20% down · 8.5% · 30yr
- Down + closing
- —
- Monthly P&I
- —
- Monthly cashflow
- —
- DSCR
- —
- Eligible?
- —
No personal income docs; deal must DSCR.
Hard money
10% down · 12.0% · 12mo
- Down + closing
- —
- Monthly P&I
- —
- Monthly cashflow
- —
- DSCR
- —
- Eligible?
- —
Short-term bridge; refi at stabilization.
HOA detail
- Monthly dues
- $72 · $864/yr
Listing history 22 events
-
2026-06-19days on market $545,000 Active 38 DOM
-
2026-06-18days on market $545,000 Active 37 DOM
-
2026-06-17days on market $545,000 Active 36 DOM
-
2026-06-17price $545,000 Active 35 DOM
-
2026-06-16days on market $560,000 Active 35 DOM
-
2026-06-15days on market $560,000 Active 34 DOM
-
2026-06-14days on market $560,000 Active 32 DOM
-
2026-06-13days on market $560,000 Active 31 DOM
-
2026-06-10days on market $560,000 Active 29 DOM
-
2026-06-09days on market $560,000 Active 28 DOM
-
2026-06-08days on market $560,000 Active 27 DOM
-
2026-06-07days on market $560,000 Active 26 DOM
-
2026-06-05days on market $560,000 Active 23 DOM
-
2026-06-03days on market $560,000 Active 22 DOM
-
2026-06-02days on market $560,000 Active 21 DOM
-
2026-06-01days on market $560,000 Active 20 DOM
-
2026-05-31days on market $560,000 Active 19 DOM
-
2026-05-30days on market $560,000 Active 18 DOM
-
2026-04-24$569,000 Active 1422-char remark
-
2022-06-21soldstatus $500,000
-
2016-04-27soldstatus $255,000
-
2004-03-15soldstatus $169,225
ⓘ Source: listings_history table (triggers on properties + properties_extension) + one-shot
backfill from property_details.listing_events for pre-trigger history.
Tax reassessment forecast AZ · Resets to sale price
- Current annual tax
- $2,506 · $209/mo
- Projected year-2 tax
- $3,597 · $300/mo
- Expected delta
- +$1,091/yr (+$91/mo · 43.5%)
ⓘ Screening estimate from a state-policy table — verify with the county assessor before closing.
Climate risk First Street
- Flood 3/10 Moderate FEMA zone X (unshaded) · 20% chance over 30 yrs
- Wildfire 8/10 Severe
- Heat 2/10 Low 8 d/yr ≥86°F today · 21 d/yr by 30 yrs out
- Wind 1/10 Low
- Air quality 2/10 Low 1 unhealthy d/yr today · 1 by 30 yrs out
Nearby sold comps map
Loading sold comps map…
Walkable amenities ~0.75 mi
Loading nearby amenities…
Taxation est. · year 1
- Rental income
- $48,766
- − Mortgage interest
- −$30,528
- − Property taxes
- −$2,506
- − Insurance
- −$2,725
- − Repairs & maintenance
- −$3,901
- − Management
- −$3,901
- − HOA
- −$864
- − Depreciation
- −$15,855
- Taxable loss
- −$11,515
- Est. tax savings @ 24.0%
- +$2,764
- After-tax cash flow
- $897/yr
For passive investors: Depreciation is non-cash, so a rental often shows a tax loss while cash-flowing — sheltering income. Rental losses are passive: they offset passive income freely, and up to $25,000/yr can offset ordinary (W-2) income if you actively participate and your MAGI is under $100k (phasing out to $0 by $150k); unused losses carry forward. On sale, claimed depreciation is recaptured at up to 25%, and gains may owe capital-gains tax (a 1031 exchange can defer both). Figures are a year-1 estimate at your 24.0% rate — not tax advice; consult a CPA.
Schools (NCES district)
- District
- Flagstaff Unified District (4192)
- NCES district ID
- 0402860
- Math proficiency
- 18% ▼ -16.00%
- Reading proficiency
- 29% ▼ -10.00%
- Median HH income
- $53,510
- Composite
- 21.11/100
- National rank
- #8437
- State rank
- #158 of 249 in AZ
Livability — Bellemont
No livability data for this city. (Only ~50 U.S. cities are tracked.)
Census & demographics
- Census place
- Bellemont, AZ
- Population (ZIP)
- 1,447
Population outlook (Coconino County) Hauer SSP2
- Today (2025)
- 150,645 people
- By 2030
- 156,857 · +4.1%
- By 2040
- 168,714 · +12.0%
- By 2050
- 181,082 · +20.2%
- By 2075
- 218,399 · +45.0%
- By 2100
- 238,853 · +58.6%
Race, ethnicity, and origin ACS 2023
- Neighborhood character
- Highly diverse neighborhood (Simpson 0.77)
- Race & ethnicity
- White 44% Native American 23% Two or more races 22% Hispanic / Latino 17% Asian 4%
- Hispanic origin (detail)
- Mexican 15% Puerto Rican 1%
- Common ancestry
- Slovak 4% Iranian 2% Italian 2%
- Foreign-born
- 4%
- Languages at home
- 71% English-only · Other Asian/Pacific 3% Spanish 3% Tagalog/Filipino 1%
Political lean MEDSL · Coconino
- 2024 margin
- D (+19.9) · D 59.2% · R 39.4% · Other 1.4%
- 2008→2024 swing
- +2.9pp toward D · 2008: 17.0pp · 2024: 19.9pp
- All cycles
- 2024: D+19.9 2020: D+24.1 2016: D+19.4 2012: D+14.9 2008: D+17.0
Not yet ingested
- Civics
- —
Market trends
- HPI YoY
- ▼ -2.91%
- Current HPI
- 219.9374
- Rent YoY
- —
- Metro
- —
- State GDP YoY
- ▲ 4.54%
- F500 in state
- 20
Industry mix (Fortune 500 HQ in AZ)
| Industry | F500 HQs | Revenue |
|---|---|---|
| Technology | 2 | $13B |
|
||
| Mining / Metals | 1 | $23B |
|
||
| Environmental Services | 1 | $16B |
|
||
| Metals / Steel | 1 | $14B |
|
||
| Technology Distribution | 1 | $9B |
|
||
| Homebuilding | 1 | $8B |
|
||
Price history
+222.1% since first listed8 events — show timeline
- 2026-06-16 Price Changed $545,000 NAZMLS
- 2026-05-28 Price Changed $560,000 NAZMLS
- 2026-05-22 Relisted — NAZMLS
- 2026-05-22 Listing Removed — NAZMLS
- 2026-04-24 Listed $569,000 NAZMLS
- 2022-06-21 Sold (Public Records) $500,000 Public Records
- 2016-04-27 Sold (Public Records) $255,000 Public Records
- 2004-03-15 Sold (Public Records) $169,225 Public Records
Property tax history
+8.0%/yrLatest (2025): $2,506 · +6.4% YoY. Source: county tax records.
Cash-flow waterfall
monthlySold comps — $/sqft
last 12 mo · ≤1 miLoading sold comps…