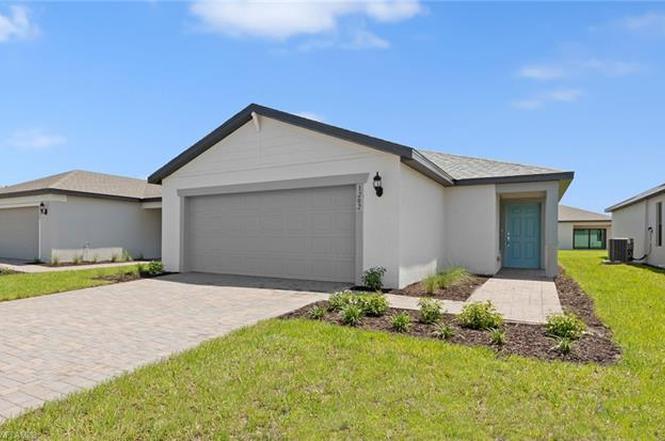
1202 Caloosa Cove Dr · LaBelle, FL
Flood risk No data
- FEMA flood zone
- —
- Chance of flooding over 30 yrs
- —
- Est. flood insurance / yr
- —
Fire risk No data
- Est. fire insurance / yr
- —
Heat risk No data
- Hot days now (above threshold)
- —
- Hot days in 30 yrs
- —
Wind risk No data
- Chance of severe wind over 30 yrs
- —
Air-quality risk No data
- Unhealthy air days now
- —
- Unhealthy air days in 30 yrs
- —
Risk factors via First Street. Map © Google.
Why this score? — see what drove the D+ grade
The composite is a weighted blend of 9 inputs, each scored 0–100. Each bar is that input's sub-score; the figure is the points it added to the 100-point composite (weight × sub-score).
- Cash flow +11.8/30.0
- Appreciation +10.0/10.0
- ARV discount +7.5/15.0
- 1% rule +3.9/10.0
- Livability +3.6/5.0
- DSCR +3.5/10.0
- Schools +3.1/10.0
- Rent growth +2.5/5.0
- Condition / age +2.5/5.0
$265,000
🖨 Deal sheet (PDF) 📄 Offer letter ✓ Due diligence
Listing remarks
NEW CONSTRUCTION, available now! This single-family Bryce floorplan offers 3 bedrooms, 2 bathrooms, and a 2-car garage. Thoughtfully designed, the entry opens into a bright gathering room that flows seamlessly into the kitchen, which features stainless steel Whirlpool appliances, white cabinets, quartz countertops, and a subway tile backsplash. Two secondary bedrooms and the laundry room are tucked away on one side of the home for added privacy. The owner’s suite provides a comfortable retreat with a spacious walk-in closet and well-appointed bathroom. Caloosa Cove, located in LaBelle - just east of Fort Myers, Florida, offers new homes with a unique selection of homes designed to fit
Key facts
- Gated community
- New construction
- Neighborhood tot lot
Tags
Property features AI
Finance
- Other: Lot is regular-shaped with developer-provided dimensions; Architectural restrictions apply; Irrigation uses reclaimed water; Part of a 137-unit community; building has 1 unit and 1 floor
- HOA & community: Mandatory HOA (managed by developer); Monthly HOA fee of $103.38; HOA covers recreation facilities; Community is gated with playground and sidewalks; Total annual recurring HOA fees approximately $1,236
Exterior
- Parking: Attached 2-car garage; Covered parking; Paved driveway
- Security: Impact resistant doors and windows; Smoke detectors
- Utilities: Central water; Central sewer; Cable available
- Home design: Single-family, 1-story (ranch) design; Rear of home faces east; Residential property in Caloosa Cove development
- Construction: Concrete block construction; Built in 2025
- Exterior features: Room for pool; Automatic sprinkler system; Impact resistant windows and doors; Stucco exterior; Shingle roof; Landscaped view
Interior
- Kitchen: Electric cooktop; Dishwasher; Disposal; Microwave; Kitchen island; Eat-in kitchen
- Bedrooms: 3 bedrooms
- Flooring: Carpet; Tile
- Bathrooms: 2 full bathrooms; Master bath with shower (no tub)
- Heating & cooling: Central electric heat; Central electric cooling
- Interior features: Built-in cabinets; Pantry; Smoke detectors; Walk-in closet; Island in kitchen; Eat-in kitchen; Laundry in residence; Auto garage door
- Laundry & utility: Laundry located inside the residence
Neighborhood map
What this means for you Summary
Snapshot
- This is a 3-bed/2.0-bath land listed at $265k.
Deal economics
- At list price, monthly cash flow is $-71 ($-847/yr) — negative.
- To cash-flow at today's rent, offer at most $255k (3.9% below list).
- To meet the 1% rule (rent ≥ 1% of price), the offer needs to be $236k (11.0% below list).
- Recommended offer: $233k (12.0% below list) — sets the bar for market timing.
- Cap rate 6.0% vs local median 4.8% in LaBelle — meaningfully above typical; check what's discounted (condition, days-on-market, listing class) to confirm the premium yield is real.
Location & tenants
- Location reads 72/100 on livability (#324 in FL) — a middle-class / working-renter tenant base. Strengths: cost of living A+, housing A+, health & safety A+; Watch: commute F, employment F.
- Hendry (town): math 35% / reading 40% proficiency, ranked #65 of 73 in FL (top 89%) — families likely to look elsewhere, expect single-tenant / working-renter base with shorter leases; 75% free/reduced lunch — lower-income household profile, screen leases tightly.
- Zoned schools: Labelle Elementary School (math 37% / reading 37%, grade F, #1,609 of 2,144 statewide, top 77%, 437 students, 77% FRL); Labelle High School (math 42% / reading 41%, grade F, #284 of 667 statewide, top 43%, 1,451 students, 62% FRL).
- Market conditions: 950 active listings in the ZIP; 2 comparable units currently listed for rent nearby; 557 units permitted in Hendry County in 2024 (45 in 5+ unit buildings).
- At $2,359/mo this rent would consume 50% of the median local household income ($57k/yr) (locally 498% of renters already pay >50% of income on rent) — very limited rent-growth headroom before tenants either downsize or default.
Forward outlook
- In year one you build about $28k of equity ($2k loan paydown + $26k appreciation (10.0% local appreciation)).
- Hendry County population projected to shrink 7% by 2050 — rents likely to lag national; underwrite the cash flow, not the appreciation.
- At projected returns (10.0% appreciation + 3.0% rent growth), your $74k cash investment doubles in ~3 years — after that, you're playing with house money.
- By year 2, paydown + projected appreciation supports a ~$46k cash-out refi (75% LTV) — recoverable capital for the next deal without selling this one.
Negotiation context
- It's been on market 318 days — a 12% lower offer ($233k) is reasonable based on typical stale-listing flexibility.
- 3 sale attempts; this cycle's ask has dropped $65k (20%) from the opening price — seller is motivated, your offer sets the floor, not the list.
Questions for the listing agent
- What do current leases actually rent for vs. the listed asking? Can we see a recent rent roll and the last 12 months of T-12 income?
- It's been on market 318 days. Have you received any prior offers? Is the seller open to a 12% concession, seller financing, or rate buy-down credit?
- What does the HOA fee cover, when was the last increase, and are there any pending special assessments or reserve-fund shortfalls?
- Why hasn't it sold? Are there any deal-killer items the seller is aware of (foundation, flood, title, zoning, code violations)?
- Is there a deadline driving the sale (1031 exchange, divorce, estate, relocation)? That informs how much negotiation room exists.
- The area grade is low — what's the realistic commute time and amenity access for the typical tenant pool here? Any planned neighborhood developments (good or bad) we should know about?
- What's the average days-on-market for RENTAL listings here right now (not sales)? A rising rental-DOM trend means longer vacancies and softer asking-rent achievability than the comps imply.
- What's the recent tenant-quality profile in this submarket — average credit score on applications, eviction rate, late-payment / NSF rate, and stable-employment percentage? A property-management company in the area should have these aggregated.
- How much new for-sale + rental construction is in the pipeline within 1–3 miles? Heavy new supply typically softens prices + rents 12–24 months out; constrained supply supports both.
Investment metrics
- 1% rule
- 0.89% ✗
- Cap rate
- 5.97%
- Cash-on-cash
- -1.14%
- DSCR
- 0.95
- GRM
- 9.4
CMA / ARV
No comps found within radius.
Projected returns pro-forma
10.0% appreciation · 3.0% rent growth · sell at horizon
- IRR
- 23.5%
- Equity multiple
- 2.89×
- Total profit
- $139,930
- Equity at exit
- $238,733
- IRR
- 20.9%
- Equity multiple
- 6.60×
- Total profit
- $415,803
- Equity at exit
- $514,837
Cash invested: $74,200 (down + closing). Projections, not guarantees.
Landlord ↔ Tenant lean methodology
- Overall (STATE)
- 87 Strongly Landlord-Friendly
- State Florida
- 87 Strongly Landlord-Friendly · R+3
- County
- — inherits STATE
- City
- — inherits STATE
ZIP-level market 33935
- Home prices YoY
- 16.3%
- Active inventory
- 950
- Price-to-rent
- 9.4×
Monthly cashflow live
- Estimated rent
- $2,359 medium interval (Pro) →
- Mortgage (P&I)
- −$1,390
- Tax est. 1.5%
- −$331 /mo · $3,975/yr
- Insurance
- −$110
- HOA
- −$103
- Vacancy / Maint / Mgmt
- −$495
- Net cashflow
- $-71
Break-even live
Sensitivity live
| Price | -10% $113 | -5% $21 | +0% $-71 | +5% $-162 | +10% $-254 |
|---|---|---|---|---|---|
| Rent | -10% $-257 | -5% $-164 | +0% $-71 | +5% $23 | +10% $116 |
| Rate | -1.0pp $63 | -0.5pp $-3 | base $-71 | +0.5pp $-139 | +1.0pp $-209 |
UW: 25.0% down · 7.5% · 30yr · 1.5% tax · 5.0% vac · 8.0% maint · 8.0% mgmt
Financing live
Cash to close
- Down payment
- $66,250
- Closing costs
- $7,950
- Reserves months
- —
- Total cash needed
- —
Loan-product check · same deal, 3 products live
Conventional
25% down · 7.5% · 30yr
- Down + closing
- —
- Monthly P&I
- —
- Monthly cashflow
- —
- DSCR
- —
- Eligible?
- —
Personal DTI + credit; lowest rate.
DSCR
20% down · 8.5% · 30yr
- Down + closing
- —
- Monthly P&I
- —
- Monthly cashflow
- —
- DSCR
- —
- Eligible?
- —
No personal income docs; deal must DSCR.
Hard money
10% down · 12.0% · 12mo
- Down + closing
- —
- Monthly P&I
- —
- Monthly cashflow
- —
- DSCR
- —
- Eligible?
- —
Short-term bridge; refi at stabilization.
Rent comps 2 comps
| Address | Beds | Baths | Sqft | Rent | $/sqft | DOM | Units | Dist |
|---|---|---|---|---|---|---|---|---|
| 1024 Caloosa Breeze Dr Labelle, FL | 4.0 | 2.0 | 1480 | $2,100 | $1.42 | 25d | 1 | 0.04mi |
| 985 Quail Run Fort Denaud, FL | 2.0 | 2.0 | 1748 | $2,000 | $1.14 | 25d | 1 | 1.44mi |
HOA detail
- Monthly dues
- $103 · $1,236/yr
- Likely covers
- pool
Listing history 10 events
-
2026-05-21status Pending
-
2026-05-02price $265,000
-
2026-05-02status Active
-
2026-02-09status Pending
-
2026-01-12price $266,310
-
2025-11-21price $294,310
-
2025-10-01status Active
-
2025-07-15price $310,645
-
2025-05-27price $309,645
-
2025-03-04$329,645 Active
ⓘ Source: listings_history table (triggers on properties + properties_extension) + one-shot
backfill from property_details.listing_events for pre-trigger history.
Nearby sold comps map
Loading sold comps map…
Walkable amenities ~0.75 mi
Loading nearby amenities…
Taxation est. · year 1
- Rental income
- $28,311
- − Mortgage interest
- −$14,844
- − Property taxes
- −$3,975
- − Insurance
- −$1,325
- − Repairs & maintenance
- −$2,265
- − Management
- −$2,265
- − HOA
- −$1,236
- − Depreciation
- −$7,709
- Taxable loss
- −$5,308
- Est. tax savings @ 24.0%
- +$1,274
- After-tax cash flow
- $427/yr
For passive investors: Depreciation is non-cash, so a rental often shows a tax loss while cash-flowing — sheltering income. Rental losses are passive: they offset passive income freely, and up to $25,000/yr can offset ordinary (W-2) income if you actively participate and your MAGI is under $100k (phasing out to $0 by $150k); unused losses carry forward. On sale, claimed depreciation is recaptured at up to 25%, and gains may owe capital-gains tax (a 1031 exchange can defer both). Figures are a year-1 estimate at your 24.0% rate — not tax advice; consult a CPA.
Schools (NCES district)
- District
- Hendry
- NCES district ID
- 1200780
- Math proficiency
- 35% ▼ -11.00%
- Reading proficiency
- 40% ▼ -4.00%
- Median HH income
- $37,043
- Composite
- 31.16/100
- National rank
- #6054
- State rank
- #65 of 73 in FL
Livability — LaBelle
- Score
- 72/100
- State rank
- #324
- US rank
- #5736
Category grades
Schools grade is shown separately in the Schools card above.
Census & demographics
- Census place
- LaBelle, FL
- County
- Hendry County · 23,186 people
- Metro
- Clewiston, FL
- Population (ZIP)
- 23,186
- Household income
- $57,009
- Rent vs Own
- Severe rent burden
- 498.0
Population outlook (Hendry County) Hauer SSP2
- Today (2025)
- 38,866 people
- By 2030
- 38,558 · -0.8%
- By 2040
- 37,743 · -2.9%
- By 2050
- 36,117 · -7.1%
- By 2075
- 30,070 · -22.6%
- By 2100
- 21,966 · -43.5%
Race, ethnicity, and origin ACS 2023
- Neighborhood character
- Majority Hispanic (56%)
- Race & ethnicity
- Hispanic / Latino 56% White 39% Two or more races 21% Black 2% Native American 2%
- Hispanic origin (detail)
- Mexican 40% Puerto Rican 3% Cuban 5%
- Common ancestry
- Lithuanian 2% Serbian 2% Slovak 1%
- Foreign-born
- 27% · Canada, Jamaica
- Languages at home
- 50% English-only · Spanish 50%
Political lean MEDSL · Hendry
- 2024 margin
- Solid R (+38.3) · D 30.4% · R 68.7%
- 2008→2024 swing
- -31.1pp toward R · 2008: -7.2pp · 2024: -38.3pp
- All cycles
- 2024: R+38.3 2020: R+23.0 2016: R+14.2 2012: R+5.9 2008: R+7.2
Not yet ingested
- Civics
- —
Market trends
- HPI YoY
- ▲ 75.20%
- Current HPI
- 537.4928
- Rent YoY
- —
- Metro
- Clewiston, FL
- State GDP YoY
- ▲ 3.28%
- F500 in state
- 36
Industry mix (Fortune 500 HQ in FL)
| Industry | F500 HQs | Revenue |
|---|---|---|
| Industrial Technology | 2 | $29B |
|
||
| Insurance | 2 | $17B |
|
||
| Retail | 1 | $60B |
|
||
| Technology Distribution | 1 | $58B |
|
||
| Homebuilding | 1 | $35B |
|
||
| Technology Manufacturing | 1 | $35B |
|
||
Price history
-19.6% since first listed10 events — show timeline
- 2026-05-21 Pending — BEARMLS
- 2026-05-02 Price Changed $265,000 BEARMLS
- 2026-05-02 Relisted — BEARMLS
- 2026-02-09 Pending — BEARMLS
- 2026-01-12 Price Changed $266,310 BEARMLS
- 2025-11-21 Price Changed $294,310 BEARMLS
- 2025-10-01 Relisted — BEARMLS
- 2025-07-15 Price Changed $310,645 BEARMLS
- 2025-05-27 Price Changed $309,645 BEARMLS
- 2025-03-04 Listed $329,645 BEARMLS
Cash-flow waterfall
monthlySold comps — $/sqft
last 12 mo · ≤1 miLoading sold comps…