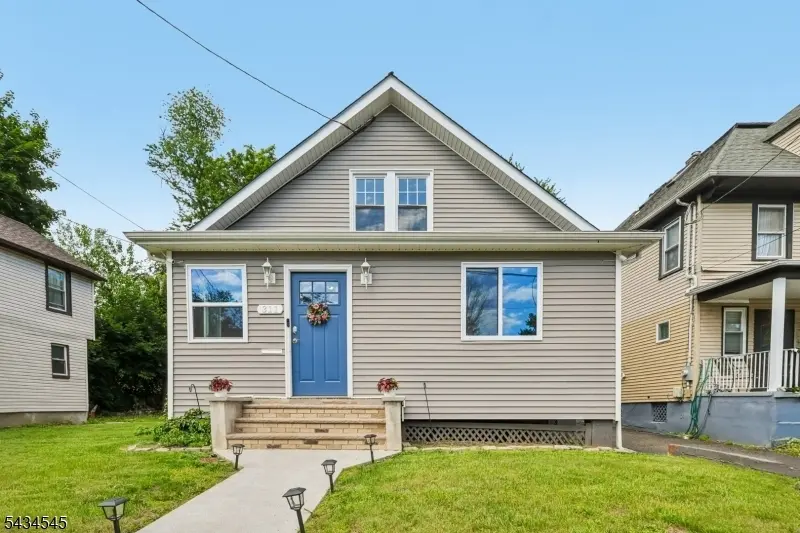
311 Monroe Ave · Plainfield, NJ
Flood risk 1/10 · Minimal
- FEMA flood zone
- X (unshaded)
- Chance of flooding over 30 yrs
- 0.0%
- Est. flood insurance / yr
- $507 – $1,088
Fire risk 1/10 · Minimal
- Est. fire insurance / yr
- $526 – $976
Heat risk 7/10 · Major
- Hot days now (above 101°F)
- 7 days/yr
- Hot days in 30 yrs
- 15 days/yr
Wind risk 6/10 · Moderate
- Chance of severe wind over 30 yrs
- 27.0%
Air-quality risk 4/10 · Minor
- Unhealthy air days now
- 4 days/yr
- Unhealthy air days in 30 yrs
- 5 days/yr
Risk factors via First Street. Map © Google.
Why this score? — see what drove the C- grade
The composite is a weighted blend of 9 inputs, each scored 0–100. Each bar is that input's sub-score; the figure is the points it added to the 100-point composite (weight × sub-score).
- ARV discount +15.0/15.0
- Cash flow +14.8/30.0
- Appreciation +5.0/10.0
- DSCR +4.5/10.0
- 1% rule +4.3/10.0
- Livability +3.2/5.0
- Rent growth +2.5/5.0
- Condition / age +2.5/5.0
- Schools +2.2/10.0
$439,000
🖨 Deal sheet (PDF) 📄 Offer letter ✓ Due diligence
Listing remarks
Welcome home to this charming 4-bedroom, 2 full bath Cape offering comfort, flexibility, and convenience. The inviting enclosed front porch provides the perfect space for a mudroom, playroom, sitting area, or seasonal entryway. Inside, you'll find a versatile floor plan featuring two spacious bedrooms and a full bath on the first level, ideal for guests, or those seeking first-floor living. The second level offers two additional generously sized bedrooms and a second full bath, providing ample space for everyone. The functional kitchen includes a separate door leading to the backyard, offering easy access for outdoor enjoyment and everyday living. Additional features include 2-zone heating
Key facts
- 0.26 acre lot
- Garage
- Listed 15 days
Property features AI
Exterior
- Parking: Detached on-site garage (1-car); Shared driveway
- Utilities: Natural gas service; Public sewer; Public water
- Home design: Cape Cod style
- Construction: Full unfinished basement
- Exterior features: Vinyl siding; Composition shingle roof; Enclosed porch(es)
Interior
- Kitchen: Separate dining area; Dishwasher; Gas range/oven; Microwave; Refrigerator; Wine refrigerator
- Bedrooms: Two bedrooms on the first floor; Two bedrooms on the second floor
- Flooring: Carpeting; Laminate
- Bathrooms: 2 full bathrooms
- Heating & cooling: Multi-zone heating (natural gas); Multi-zone cooling
- Interior features: Enclosed porch; Full unfinished basement with laundry and utility rooms; 7 total rooms
- Laundry & utility: Washer; Dryer; Basement laundry room; Utility room
Neighborhood map
What this means for you Summary
Snapshot
- This is a 4-bed/2.0-bath single-family listed at $439k.
Deal economics
- At list price, monthly cash flow is $119 ($1k/yr) — positive.
- The deal already cash-flows at list — no discount required.
- To meet the 1% rule (rent ≥ 1% of price), the offer needs to be $407k (7.3% below list).
- Recommended offer: $407k (7.3% below list) — sets the bar for 1% rule.
- Cap rate 6.6% vs local median 3.3% in Plainfield — top-decile yield for the area; either an underpriced asset or a hidden risk that comps aren't pricing in. Stress-test before assuming the spread holds.
Location & tenants
- Location reads 65/100 on livability (#384 in NJ) — a middle-class / working-renter tenant base. Strengths: commute A+, housing A-; Watch: crime D+, amenities F, cost of living F.
- Plainfield Public School District (suburban): math 17% / reading 25% proficiency, ranked #588 of 612 in NJ (top 96%) — low school quality limits family demand, transient renter base, plan for 1-2y turnover; 74% free/reduced lunch — lower-income household profile, screen leases tightly.
- Zoned schools: Clinton Elementary School (413 students, 75% FRL); Hubbard Middle School (math 24% / reading 24%, grade F, #365 of 431 statewide, top 86%, 775 students, 91% FRL); Plainfield High School (1,925 students, 78% FRL).
- Market conditions: 1 active listings in the ZIP; 6 comparable units currently listed for rent nearby; rentals leasing fast (median 5d on market — plan ~1-2 weeks tenant-placement turnaround); 1,749 units permitted in Union County in 2024 (1,421 in 5+ unit buildings).
Forward outlook
- In year one you build about $16k of equity ($3k loan paydown + $13k appreciation (3.0% local appreciation)).
- Union County population projected at +17% by 2050 — long-run rental-demand tailwind backs the buy-and-hold thesis.
- At projected returns (3.0% appreciation + 3.0% rent growth), your $123k cash investment doubles in ~6 years — after that, you're playing with house money.
- By year 3, paydown + projected appreciation supports a ~$40k cash-out refi (75% LTV) — recoverable capital for the next deal without selling this one.
Negotiation context
- It's been on market 15 days — a 2% lower offer ($432k) is reasonable based on typical stale-listing flexibility.
- Current owner paid $118k; list at $439k implies a 272% gain — meaningful room to come down on a strong offer.
Risks & watch-outs
- Watch-outs: built in 1921 — expect roof / HVAC / electrical / plumbing capex.
- Climate carrying-cost: major wind risk, 27% chance of damaging wind over 30y; extreme-heat days projected 7→15/yr by 2055 (HVAC capex compounding) — expect insurance premiums to compound above CPI over the hold.
Questions for the listing agent
- Built in 1921 — when were the roof, HVAC, electrical panel, plumbing, and water heater last replaced?
- Is there a deadline driving the sale (1031 exchange, divorce, estate, relocation)? That informs how much negotiation room exists.
- Schools are D-rated, which usually means shorter tenancies and higher turnover. Who's the typical renter profile here, and what's been the actual vacancy rate?
- Crime grade is D in this area — have there been break-ins, vandalism, or insurance claims at this property in the last 3 years? What carrier currently insures it and at what premium?
- What's the average days-on-market for RENTAL listings here right now (not sales)? A rising rental-DOM trend means longer vacancies and softer asking-rent achievability than the comps imply.
- What's the recent tenant-quality profile in this submarket — average credit score on applications, eviction rate, late-payment / NSF rate, and stable-employment percentage? A property-management company in the area should have these aggregated.
- How much new for-sale + rental construction is in the pipeline within 1–3 miles? Heavy new supply typically softens prices + rents 12–24 months out; constrained supply supports both.
Investment metrics
- 1% rule
- 0.93% ✗
- Cap rate
- 6.62%
- Cash-on-cash
- 1.16%
- DSCR
- 1.05
- GRM
- 9.0
CMA / ARV
- ARV (on-the-fly)
- $559,320
- Comps found
- 7
Show comp detail 7 sales within ~0.75 mi
| Address | Dist | Beds/Ba | Sqft | Sold | Price | $/sf | Match |
|---|---|---|---|---|---|---|---|
| 345 Clinton Ave | 0.36mi | 3/2.0 (-1) | 1,974 (+4%) | 2mo | $611,000 | $310 | 70 |
| 400 Grant Ave #04 | 0.28mi | 4/3.5 | 2,069 (+9%) | 10mo | $675,000 | $326 | 57 |
| 242 Chestnut Ave | 0.68mi | 4/2.0 | 1,884 (-1%) | 14mo | $587,139 | $312 | 56 |
| 525 Pleasant Ave | 0.69mi | 3/2.0 (-1) | 1,932 (+2%) | 5mo | $570,000 | $295 | 55 |
| 951-55 Myrtle Ave | 0.36mi | 3/1.5 (-1) | 1,720 (-9%) | 12mo | $461,000 | $268 | 51 |
| 1154 Foster Ave | 0.71mi | 3/1.0 (-1) | 2,024 (+7%) | 8mo | $510,000 | $252 | 40 |
| 552 Parkview Ave | 0.72mi | 4/2.0 | 2,140 (+13%) | 12mo | $520,000 | $243 | 35 |
Match score weights: distance 35% · size 25% · config 20% · recency 20%. Top-matched comps best support the ARV.
Projected returns pro-forma
3.0% appreciation · 3.0% rent growth · sell at horizon
- IRR
- 8.6%
- Equity multiple
- 1.49×
- Total profit
- $60,577
- Equity at exit
- $197,393
- IRR
- 11.2%
- Equity multiple
- 2.67×
- Total profit
- $205,211
- Equity at exit
- $304,207
Cash invested: $122,920 (down + closing). Projections, not guarantees.
Landlord ↔ Tenant lean methodology
- Overall (STATE)
- 21 Tenant-Leaning
- State New Jersey
- 21 Tenant-Leaning · D+6
- County
- — inherits STATE
- City
- — inherits STATE
ZIP-level market 07063-1346
- Active inventory
- 1
- Price-to-rent
- 9.0×
Monthly cashflow live
- Estimated rent
- $4,070 high interval (Pro) →
- Mortgage (P&I)
- −$2,302
- Tax from tax record
- −$611 /mo · $7,328/yr
- Insurance
- −$183
- HOA
- −$0
- Vacancy / Maint / Mgmt
- −$855
- Net cashflow
- $119
Break-even live
Sensitivity live
| Price | -10% $368 | -5% $243 | +0% $119 | +5% $-5 | +10% $-129 |
|---|---|---|---|---|---|
| Rent | -10% $-202 | -5% $-42 | +0% $119 | +5% $280 | +10% $441 |
| Rate | -1.0pp $340 | -0.5pp $231 | base $119 | +0.5pp $5 | +1.0pp $-110 |
UW: 25.0% down · 7.5% · 30yr · 1.5% tax · 5.0% vac · 8.0% maint · 8.0% mgmt
Financing live
Cash to close
- Down payment
- $109,750
- Closing costs
- $13,170
- Reserves months
- —
- Total cash needed
- —
Loan-product check · same deal, 3 products live
Conventional
25% down · 7.5% · 30yr
- Down + closing
- —
- Monthly P&I
- —
- Monthly cashflow
- —
- DSCR
- —
- Eligible?
- —
Personal DTI + credit; lowest rate.
DSCR
20% down · 8.5% · 30yr
- Down + closing
- —
- Monthly P&I
- —
- Monthly cashflow
- —
- DSCR
- —
- Eligible?
- —
No personal income docs; deal must DSCR.
Hard money
10% down · 12.0% · 12mo
- Down + closing
- —
- Monthly P&I
- —
- Monthly cashflow
- —
- DSCR
- —
- Eligible?
- —
Short-term bridge; refi at stabilization.
Rent comps 6 comps
| Address | Beds | Baths | Sqft | Rent | $/sqft | DOM | Units | Dist |
|---|---|---|---|---|---|---|---|---|
| 124 Lafayette Pl Plainfield, NJ | 5.0 | 3.0 | 2352 | $4,100 | $1.74 | 4d | 1 | 0.51mi |
| 925 Plainfield Ave Plainfield, NJ | 3.0 | 1.5 | 2500 | $3,800 | $1.52 | 17d | 1 | 0.87mi |
| 1824 Eganey St South Plainfield, NJ | 4.0 | 1.5 | 1350 | $3,400 | $2.52 | 4d | 1 | 1.06mi |
| 208 W 7th St Unit 3 Plainfield, NJ | 3.0 | 2.0 | 1400 | $3,699 | $2.64 | 0d | 1 | 1.14mi |
| 707 Station Rd Dunellen, NJ | 3.0 | 2.5 | 2090 | $4,750 | $2.27 | 4d | 1 | 1.41mi |
| 707 Station Rd Dunellen, NJ | 3.0 | 2.5 | 2090 | $4,750 | $2.27 | 0d | 1 | 1.41mi |
Listing history 11 events
-
2026-06-21days on market $439,000 Active 15 DOM
-
2026-06-18days on market $439,000 Active 12 DOM
-
2026-06-17days on market $439,000 Active 11 DOM
-
2026-06-16days on market $439,000 Active 10 DOM
-
2026-06-15days on market $439,000 Active 9 DOM
-
2026-06-13days on market $439,000 Active 7 DOM
-
2026-06-09days on market $439,000 Active 3 DOM
-
2026-06-08days on market $439,000 Active 2 DOM
-
2026-06-07status $439,000 Active 1 DOM
-
2026-06-04remarks 699-char remark
-
2026-06-04$439,000 Coming Soon 1 DOM
ⓘ Source: listings_history table (triggers on properties + properties_extension) + one-shot
backfill from property_details.listing_events for pre-trigger history.
Tax reassessment forecast NJ · Partial reset (capped growth)
- Current annual tax
- $7,328 · $611/mo
- Projected year-2 tax
- $9,130 · $761/mo
- Expected delta
- +$1,801/yr (+$150/mo · 24.6%)
ⓘ Screening estimate from a state-policy table — verify with the county assessor before closing.
Climate risk First Street
- Flood 1/10 Low FEMA zone X (unshaded) · 0% chance over 30 yrs
- Wildfire 1/10 Low
- Heat 7/10 Severe 7 d/yr ≥101°F today · 15 d/yr by 30 yrs out
- Wind 6/10 Major 27% chance of damaging wind over 30 yrs
- Air quality 4/10 Moderate 4 unhealthy d/yr today · 5 by 30 yrs out
Nearby sold comps map
Loading sold comps map…
Walkable amenities ~0.75 mi
Loading nearby amenities…
Taxation est. · year 1
- Rental income
- $48,835
- − Mortgage interest
- −$24,591
- − Property taxes
- −$7,328
- − Insurance
- −$2,195
- − Repairs & maintenance
- −$3,907
- − Management
- −$3,907
- − Depreciation
- −$12,771
- Taxable loss
- −$5,863
- Est. tax savings @ 24.0%
- +$1,407
- After-tax cash flow
- $2,838/yr
For passive investors: Depreciation is non-cash, so a rental often shows a tax loss while cash-flowing — sheltering income. Rental losses are passive: they offset passive income freely, and up to $25,000/yr can offset ordinary (W-2) income if you actively participate and your MAGI is under $100k (phasing out to $0 by $150k); unused losses carry forward. On sale, claimed depreciation is recaptured at up to 25%, and gains may owe capital-gains tax (a 1031 exchange can defer both). Figures are a year-1 estimate at your 24.0% rate — not tax advice; consult a CPA.
Schools (NCES district)
- District
- Plainfield Public School District
- NCES district ID
- 3413140
- Math proficiency
- 17% ▲ 1.00%
- Reading proficiency
- 25% ▲ 1.00%
- Median HH income
- $52,983
- Composite
- 22.21/100
- National rank
- #13512
- State rank
- #588 of 612 in NJ
Livability — Plainfield
- Score
- 65/100
- State rank
- #384
- US rank
- #13086
Category grades
Schools grade is shown separately in the Schools card above.
Census & demographics
- Census place
- Plainfield, NJ
Population outlook (Union County) Hauer SSP2
- Today (2025)
- 596,450 people
- By 2030
- 616,880 · +3.4%
- By 2040
- 658,185 · +10.4%
- By 2050
- 696,707 · +16.8%
- By 2075
- 785,448 · +31.7%
- By 2100
- 836,583 · +40.3%
Not yet ingested
- Political lean
- —
- Race & ethnicity
- —
- Common origin
- —
- Civics
- —
Market trends
- HPI YoY
- —
- Current HPI
- —
- Rent YoY
- —
- Metro
- —
- State GDP YoY
- ▲ 2.05%
- F500 in state
- 34
Industry mix (Fortune 500 HQ in NJ)
| Industry | F500 HQs | Revenue |
|---|---|---|
| Consumer Goods | 3 | $31B |
|
||
| Pharmaceuticals | 2 | $153B |
|
||
| Technology | 2 | $21B |
|
||
| Insurance | 2 | $20B |
|
||
| Healthcare | 2 | $19B |
|
||
| Financial Services | 1 | $70B |
|
||
Price history
+1691.8% since first listed4 events — show timeline
- 2026-06-03 Coming Soon $439,000 GSMLS
- 2018-08-02 Sold (Public Records) $118,000 Public Records
- 2018-07-31 Sold (MLS) $118,000 GSMLS
- 1974-07-01 Sold (Public Records) $24,500 Public Records
Property tax history
+2.3%/yrLatest (2025): $7,328 · +2.2% YoY. Source: county tax records.
Cash-flow waterfall
monthlySold comps — $/sqft
last 12 mo · ≤1 miLoading sold comps…