 17-Plex
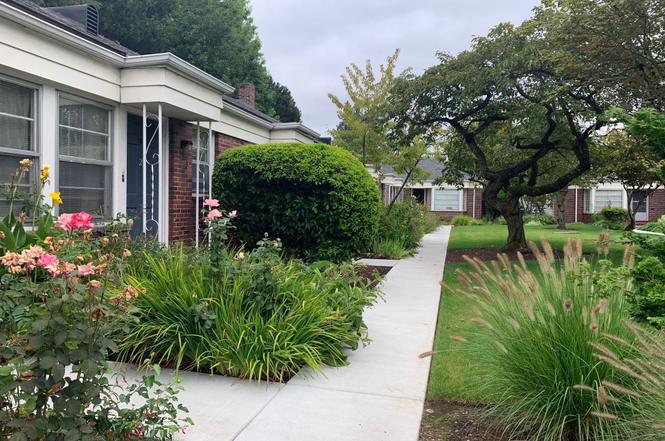
610 SE Cesar E Chavez Blvd · Portland, OR
Flood risk 1/10 · Minimal
- FEMA flood zone
- X (unshaded)
- Chance of flooding over 30 yrs
- 0.0%
- Est. flood insurance / yr
- $473 – $860
Fire risk 1/10 · Minimal
- Est. fire insurance / yr
- $498 – $926
Heat risk 3/10 · Minor
- Hot days now (above 92°F)
- 7 days/yr
- Hot days in 30 yrs
- 14 days/yr
Wind risk 1/10 · Minimal
- Chance of severe wind over 30 yrs
- —
Air-quality risk 10/10 · Severe
- Unhealthy air days now
- 19 days/yr
- Unhealthy air days in 30 yrs
- 21 days/yr
Risk factors via First Street. Map © Google.
Why this score? — see what drove the B grade
The composite is a weighted blend of 9 inputs, each scored 0–100. Each bar is that input's sub-score; the figure is the points it added to the 100-point composite (weight × sub-score).
- Cash flow +30.0/30.0
- 1% rule +10.0/10.0
- DSCR +10.0/10.0
- ARV discount +7.5/15.0
- Schools +4.7/10.0
- Livability +3.9/5.0
- Rent growth +2.8/5.0
- Condition / age +2.5/5.0
- Appreciation +0.0/10.0
$2,995,000
🖨 Deal sheet 📄 Offer letter ✓ Due diligence
Multi-family units
County records classify this as Multi-Family (5+ Unit). Listing-text estimate: 17 units. confirmed
5+ unit building — per-unit beds/baths from public records are typically unavailable; the breakdown below (if shown) is an estimate from the listing text.
Listing remarks
Well located 17 unit apartment community in close-in SE Portland. Long term owner who will 1031 exchange. Real hardwood floors in charming units will history of high occupancy. 88 walk score and off street parking. New asphalt and interior upgrades. Please do not disturb residents.
Key facts
- Interior upgrades
- Off street parking
- Real hardwood floors
Tags
Property features AI
Finance
- Financial info: 17 total units; Unit mix and current rents: 1 studio/efficiency (515 sq ft) renting at $1,425; 14 one-bedroom units (610 sq ft) renting at $1,475; 2 two-bedroom units (1,000 sq ft) renting at $1,650; Rent includes water, sewer, and trash collection; Reported CAP rate 6.0 and gross rent multiplier 9.78
- HOA & community: Community laundry
Exterior
- Parking: Paved parking
- Utilities: Public water; Public sewer; Electricity and gas service
- Home design: Multi-family property; Not attached to other properties; Updated/remodeled; Built in 1943
- Construction: Composition roof; Concrete perimeter foundation
- Exterior features: Brick and wood siding exterior; Level lot; Paved road access
Interior
- Kitchen: Ranges in units; Refrigerators in units
- Bedrooms: Unit mix includes 1-bedroom and 2-bedroom units
- Flooring: Hardwood floors (in select units)
- Bathrooms: One bathroom in each unit type
- Heating & cooling: Forced air heating; No central cooling
- Interior features: Updated/remodeled condition; Hardwood floors in many units; Range and refrigerator included in units
- Laundry & utility: On-site laundry
Neighborhood map
What this means for you Summary
Snapshot
- This is a 17 × 18-bed/17.0-bath units multifamily listed at $3.00M.
Deal economics
- At list price, monthly cash flow is $17k ($201k/yr) — positive. Per door: $984/mo.
- The deal already cash-flows at list — no discount required.
- Meets the 1% rule at list price ($47k rent vs $3.00M).
- Recommended offer: $2.64M (12.0% below list) — sets the bar for market timing.
- Cap rate 13.0% vs local median 2.2% in Portland — top-decile yield for the area; either an underpriced asset or a hidden risk that comps aren't pricing in. Stress-test before assuming the spread holds.
Location & tenants
- Location reads 77/100 on livability (#72 in OR, #3,256 nationally) — a middle-class / working-renter tenant base. Strengths: amenities A+, commute A+, health & safety A+; Watch: crime F, cost of living F.
- Portland SD 1J (urban): math 46% / reading 58% proficiency, ranked #23 of 183 in OR (top 13%) — acceptable for families but not a draw, mixed tenant base, ~2y average lease.
- Zoned schools: Glencoe Elementary School (394 students, 18% FRL); Mt Tabor Middle School (606 students, 15% FRL); Franklin High School (1,966 students, 37% FRL).
- Market conditions: Rents rising (+1.3%/yr); 123 active listings in the ZIP; solid renter incomes; 2,041 units permitted in Multnomah County in 2024 (905 in 5+ unit buildings).
- At $47,373/mo this rent would consume 652% of the median local household income ($87k/yr) (locally 1946% of renters already pay >50% of income on rent) — very limited rent-growth headroom before tenants either downsize or default.
Forward outlook
- Local home prices are declining (-3.0%/yr); year-one equity from $21k of loan paydown is wiped out by about $90k of value loss. Plan a longer hold.
- Multnomah County population projected at +33% by 2050 — long-run rental-demand tailwind backs the buy-and-hold thesis.
- At projected returns (-3.0% appreciation + 1.3% rent growth), your $839k cash investment doubles in ~6 years — after that, you're playing with house money.
Negotiation context
- It's been on market 133 days — a 12% lower offer ($2.64M) is reasonable based on typical stale-listing flexibility.
- 5 sale attempts since 3y ago with the ask held roughly flat each time — persistent listings suggest the price (not the market) is what's stuck; bring a comps-based counter.
Risks & watch-outs
- Watch-outs: built in 1943 — expect roof / HVAC / electrical / plumbing capex.
Questions for the listing agent
- It's been on market 133 days. Have you received any prior offers? Is the seller open to a 12% concession, seller financing, or rate buy-down credit?
- Can we see the unit-by-unit rent roll, current vacancy, and any below-market leases? What's the average tenancy length?
- What capital expenditures (roof, boiler, parking lot, exteriors) have been made in the last 5 years, and what's planned in the next 2?
- Built in 1943 — when were the roof, HVAC, electrical panel, plumbing, and water heater last replaced?
- Why hasn't it sold? Are there any deal-killer items the seller is aware of (foundation, flood, title, zoning, code violations)?
- Is there a deadline driving the sale (1031 exchange, divorce, estate, relocation)? That informs how much negotiation room exists.
- Crime grade is F in this area — have there been break-ins, vandalism, or insurance claims at this property in the last 3 years? What carrier currently insures it and at what premium?
- What's the average days-on-market for RENTAL listings here right now (not sales)? A rising rental-DOM trend means longer vacancies and softer asking-rent achievability than the comps imply.
- What's the recent tenant-quality profile in this submarket — average credit score on applications, eviction rate, late-payment / NSF rate, and stable-employment percentage? A property-management company in the area should have these aggregated.
- How much new apartment / multifamily construction is in the pipeline within 1–3 miles? Heavy new supply (>2% of stock underway) typically softens rents 12–24 months out; light construction supports rent growth.
Investment metrics
- 1% rule
- 1.58% ✓
- Cap rate
- 12.99%
- Cash-on-cash
- 23.94%
- DSCR
- 2.06
- GRM
- 5.3
CMA / ARV
No comps found within radius.
Projected returns pro-forma
-3.0% appreciation · 1.31% rent growth · sell at horizon
- IRR
- 15.2%
- Equity multiple
- 1.60×
- Total profit
- $501,517
- Equity at exit
- $446,564
- IRR
- 22.6%
- Equity multiple
- 2.79×
- Total profit
- $1,497,189
- Equity at exit
- $258,953
Cash invested: $838,600 (down + closing). Projections, not guarantees.
Landlord ↔ Tenant lean methodology
- Overall (CITY)
- 0 Strongly Tenant-Friendly
- State Oregon
- 28 Tenant-Leaning · D+6
- County
- — inherits STATE
- City Portland
- 0 Strongly Tenant-Friendly · D+39
ZIP-level market 97214
- Rents YoY
- 1.3%
- Active inventory
- 123
- Price-to-rent
- 89.6×
Monthly cashflow live
- Estimated rent
- $47,373 medium interval (Pro) →
- Mortgage (P&I)
- −$15,706
- Tax est. 1.5%
- −$3,744 /mo · $44,925/yr
- Insurance
- −$1,248
- HOA
- −$0
- Vacancy / Maint / Mgmt
- −$9,948
- Net cashflow
- $16,727
Break-even live
17-unit breakdown (identical units grouped — click to expand)
| Units | Beds | Baths | Est. rent |
|---|---|---|---|
| 17× units | 18 | 17 | $47,379 |
| #1 | 18 | 17 | $2,787 |
| #2 | 18 | 17 | $2,787 |
| #3 | 18 | 17 | $2,787 |
| #4 | 18 | 17 | $2,787 |
| #5 | 18 | 17 | $2,787 |
| #6 | 18 | 17 | $2,787 |
| #7 | 18 | 17 | $2,787 |
| #8 | 18 | 17 | $2,787 |
| #9 | 18 | 17 | $2,787 |
| #10 | 18 | 17 | $2,787 |
| #11 | 18 | 17 | $2,787 |
| #12 | 18 | 17 | $2,787 |
| #13 | 18 | 17 | $2,787 |
| #14 | 18 | 17 | $2,787 |
| #15 | 18 | 17 | $2,787 |
| #16 | 18 | 17 | $2,787 |
| #17 | 18 | 17 | $2,787 |
| Total (17 units) | $47,373 | ||
UW: 25.0% down · 7.5% · 30yr · 1.5% tax · 5.0% vac · 8.0% maint · 8.0% mgmt
Financing live
Cash to close
- Down payment
- $748,750
- Closing costs
- $89,850
- Reserves months
- —
- Total cash needed
- —
Loan-product check · same deal, 3 products live
Conventional
25% down · 7.5% · 30yr
- Down + closing
- —
- Monthly P&I
- —
- Monthly cashflow
- —
- DSCR
- —
- Eligible?
- —
Personal DTI + credit; lowest rate.
DSCR
20% down · 8.5% · 30yr
- Down + closing
- —
- Monthly P&I
- —
- Monthly cashflow
- —
- DSCR
- —
- Eligible?
- —
No personal income docs; deal must DSCR.
Hard money
10% down · 12.0% · 12mo
- Down + closing
- —
- Monthly P&I
- —
- Monthly cashflow
- —
- DSCR
- —
- Eligible?
- —
Short-term bridge; refi at stabilization.
Listing history 12 events
-
2026-06-18days on market $2,995,000 Active 133 DOM
-
2026-06-17days on market $2,995,000 Active 132 DOM
-
2026-06-16days on market $2,995,000 Active 131 DOM
-
2026-06-15days on market $2,995,000 Active 130 DOM
-
2026-06-13days on market $2,995,000 Active 128 DOM
-
2026-06-09days on market $2,995,000 Active 124 DOM
-
2026-06-08days on market $2,995,000 Active 123 DOM
-
2026-06-07days on market $2,995,000 Active 122 DOM
-
2026-06-03days on market $2,995,000 Active 118 DOM
-
2026-06-02days on market $2,995,000 Active 117 DOM
-
2026-06-01days on market $2,995,000 Active 116 DOM
-
2026-05-31days on market $2,995,000 Active 115 DOM
ⓘ Source: listings_history table (triggers on properties + properties_extension) + one-shot
backfill from property_details.listing_events for pre-trigger history.
Climate risk First Street
- Flood 1/10 Low FEMA zone X (unshaded) · 0% chance over 30 yrs
- Wildfire 1/10 Low
- Heat 3/10 Moderate 7 d/yr ≥92°F today · 14 d/yr by 30 yrs out
- Wind 1/10 Low
- Air quality 10/10 Extreme 19 unhealthy d/yr today · 21 by 30 yrs out
Nearby sold comps map
Loading sold comps map…
Walkable amenities ~0.75 mi
Loading nearby amenities…
Taxation est. · year 1
- Rental income
- $568,476
- − Mortgage interest
- −$167,767
- − Property taxes
- −$44,925
- − Insurance
- −$14,975
- − Repairs & maintenance
- −$45,478
- − Management
- −$45,478
- − Depreciation
- −$87,127
- Taxable income
- $162,726
- Est. tax owed @ 24.0%
- −$39,054
- After-tax cash flow
- $161,669/yr
For passive investors: Depreciation is non-cash, so a rental often shows a tax loss while cash-flowing — sheltering income. Rental losses are passive: they offset passive income freely, and up to $25,000/yr can offset ordinary (W-2) income if you actively participate and your MAGI is under $100k (phasing out to $0 by $150k); unused losses carry forward. On sale, claimed depreciation is recaptured at up to 25%, and gains may owe capital-gains tax (a 1031 exchange can defer both). Figures are a year-1 estimate at your 24.0% rate — not tax advice; consult a CPA.
Schools (NCES district)
- District
- Portland SD 1J
- NCES district ID
- 4110040
- Math proficiency
- 46% ▼ -2.00%
- Reading proficiency
- 58% ▼ -3.00%
- Median HH income
- $57,851
- Composite
- 47.1/100
- National rank
- #5112
- State rank
- #23 of 183 in OR
Livability — Portland
- Score
- 77/100
- State rank
- #72
- US rank
- #3256
Category grades
Schools grade is shown separately in the Schools card above.
Census & demographics
- Census place
- Portland, OR
- County
- Multnomah County · 786,692 people
- City population
- 774,334
- Metro
- Portland-Vancouver-Hillsboro, OR-WA
- Population (ZIP)
- 27,714
- Household income
- $87,131
- Rent vs Own
- Severe rent burden
- 1946.0
Population outlook (Multnomah County) Hauer SSP2
- Today (2025)
- 930,825 people
- By 2030
- 996,904 · +7.1%
- By 2040
- 1,121,379 · +20.5%
- By 2050
- 1,242,124 · +33.4%
- By 2075
- 1,464,431 · +57.3%
- By 2100
- 1,576,181 · +69.3%
Race, ethnicity, and origin ACS 2023
- Neighborhood character
- Predominantly White (78%)
- Race & ethnicity
- White 78% Two or more races 11% Hispanic / Latino 9% Asian 4% Black 2%
- Hispanic origin (detail)
- Mexican 4% Puerto Rican 1%
- Common ancestry
- Italian 5% Slovak 4% Lithuanian 3%
- Foreign-born
- 6% · Canada, China, South Korea
- Languages at home
- 93% English-only · Spanish 2% Other Indo-European 1% Chinese 1%
Political lean MEDSL · Multnomah
- 2024 margin
- Solid D (+62.1) · D 79.3% · R 17.2% · Other 3.5%
- 2008→2024 swing
- +6.0pp toward D · 2008: 56.1pp · 2024: 62.1pp
- All cycles
- 2024: D+62.1 2020: D+61.3 2016: D+58.3 2012: D+54.9 2008: D+56.1
Not yet ingested
- Civics
- —
Market trends
- HPI YoY
- ▼ -604.86%
- Current HPI
- 326.4709
- Rent YoY
- ▲ 1.31%
- Metro
- Portland-Vancouver-Hillsboro, OR-WA
- State GDP YoY
- ▲ 2.05%
- F500 in state
- 2
Industry mix (Fortune 500 HQ in OR)
| Industry | F500 HQs | Revenue |
|---|---|---|
| Consumer Goods | 1 | $51B |
|
||
Price history
+202950.8% since first listed10 events — show timeline
- 2026-05-28 Relisted — RMLS
- 2026-01-08 Listed $2,995,000 RMLS
- 2024-05-23 Rental Removed $1,425 APPFOLIO
- 2024-05-16 Listed for Rent $1,425 APPFOLIO
- 2024-04-10 Rental Removed $1,525 APPFOLIO
- 2024-04-09 Listed for Rent $1,525 APPFOLIO
- 2024-04-04 Rental Removed $1,245 APPFOLIO
- 2024-03-28 Price Changed $1,245 APPFOLIO
- 2024-03-13 Price Changed $1,300 APPFOLIO
- 2023-12-18 Listed for Rent $1,475 APPFOLIO
Cash-flow waterfall
monthlySold comps — $/sqft
last 12 mo · ≤1 miLoading sold comps…