9 Shirley Dr · Georgetown-Quitman County, GA
Flood risk 3/10 · Minor
- FEMA flood zone
- X (unshaded)
- Chance of flooding over 30 yrs
- 0.2%
- Est. flood insurance / yr
- $507 – $1,088
Fire risk 5/10 · Moderate
- Est. fire insurance / yr
- $963 – $1,789
Heat risk 8/10 · Major
- Hot days now (above 106°F)
- 7 days/yr
- Hot days in 30 yrs
- 20 days/yr
Wind risk 8/10 · Major
- Chance of severe wind over 30 yrs
- 80.0%
Air-quality risk 3/10 · Minor
- Unhealthy air days now
- 2 days/yr
- Unhealthy air days in 30 yrs
- 3 days/yr
Risk factors via First Street. Map © Google.
Why this score? — see what drove the D+ grade
The composite is a weighted blend of 9 inputs, each scored 0–100. Each bar is that input's sub-score; the figure is the points it added to the 100-point composite (weight × sub-score).
- Cash flow +19.0/30.0
- Appreciation +7.0/10.0
- DSCR +6.0/10.0
- 1% rule +4.9/10.0
- Rent growth +2.5/5.0
- Livability +2.5/5.0
- Condition / age +2.5/5.0
- Schools +1.4/10.0
- ARV discount +0.0/15.0
$105,000
🖨 Deal sheet 📄 Offer letter ✓ Due diligence
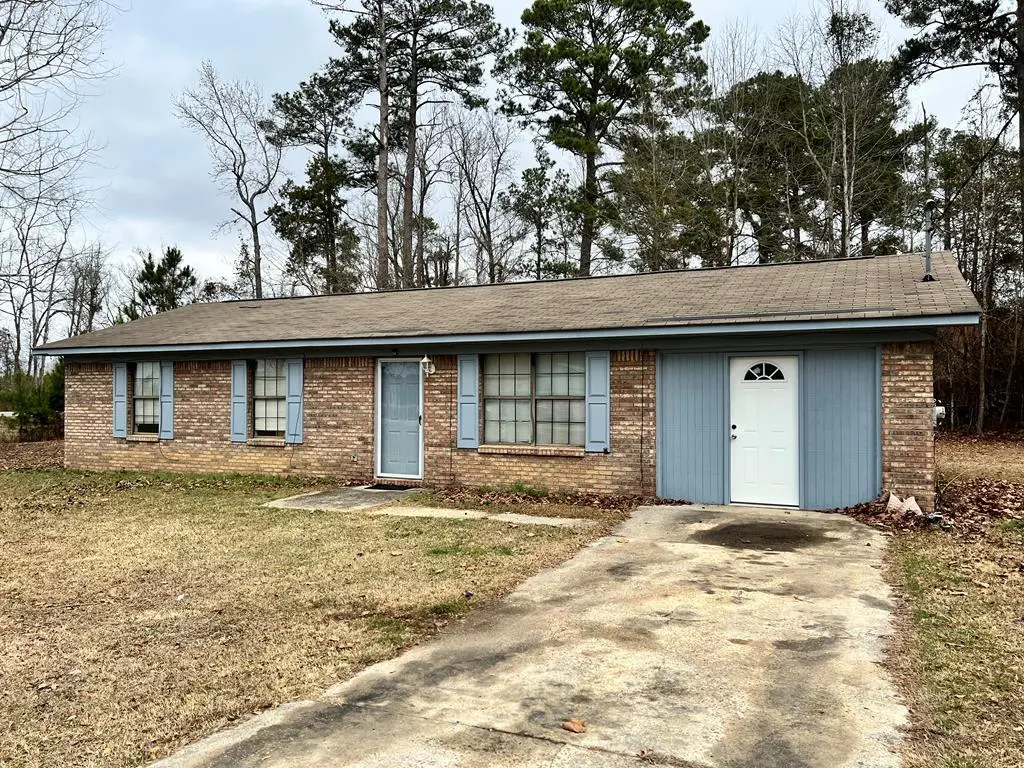
Listing remarks MLS
Great Starter home or downsizing. Brick home with living rm, Dining/kitchen, den (enclosed garage), full bath and a 3/4 bath. large backyard and located on a corner lot.
Key facts
- Large backyard
- Brick home
- Corner lot
Tags
Neighborhood map
What this means for you Summary
Snapshot
- This is a 2-bed/1.5-bath single-family listed at $105k.
Deal economics
- At list price, monthly cash flow is $109 ($1k/yr) — positive.
- The deal already cash-flows at list — no discount required.
- To meet the 1% rule (rent ≥ 1% of price), the offer needs to be $103k (1.5% below list).
- Recommended offer: $96k (9.0% below list) — sets the bar for market timing.
- Cap rate 7.5% vs local median 2.9% in Georgetown-Quitman County — top-decile yield for the area; either an underpriced asset or a hidden risk that comps aren't pricing in. Stress-test before assuming the spread holds.
Location & tenants
- Location reads: area grade D — affects rentability + tenant quality, not the cash-flow math above.
- Quitman County (town): math 10% / reading 15% proficiency, ranked #184 of 187 in GA (top 98%) — low school quality limits family demand, transient renter base, plan for 1-2y turnover; 94% free/reduced lunch — lower-income household profile, screen leases tightly.
- Market conditions: 78 active listings in the ZIP; 12 units permitted in Quitman County in 2024 (0 in 5+ unit buildings).
Forward outlook
- In year one you build about $5k of equity ($726 loan paydown + $4k appreciation (4.1% local appreciation)).
- Quitman County population projected at -42% by 2050 — secular population decline; favor cash flow + early exit over multi-decade hold.
- At projected returns (4.1% appreciation + 3.0% rent growth), your $29k cash investment doubles in ~5 years — after that, you're playing with house money.
- By year 7, paydown + projected appreciation supports a ~$32k cash-out refi (75% LTV) — recoverable capital for the next deal without selling this one.
Negotiation context
- It's been on market 118 days — a 9% lower offer ($96k) is reasonable based on typical stale-listing flexibility.
Risks & watch-outs
- Climate carrying-cost: severe wind risk, 80% chance of damaging wind over 30y; moderate wildfire risk; extreme-heat days projected 7→20/yr by 2055 (HVAC capex compounding) — expect insurance premiums to compound above CPI over the hold.
Questions for the listing agent
- It's been on market 118 days. Have you received any prior offers? Is the seller open to a 9% concession, seller financing, or rate buy-down credit?
- Why hasn't it sold? Are there any deal-killer items the seller is aware of (foundation, flood, title, zoning, code violations)?
- Is there a deadline driving the sale (1031 exchange, divorce, estate, relocation)? That informs how much negotiation room exists.
- The area grade is low — what's the realistic commute time and amenity access for the typical tenant pool here? Any planned neighborhood developments (good or bad) we should know about?
- What's the average days-on-market for RENTAL listings here right now (not sales)? A rising rental-DOM trend means longer vacancies and softer asking-rent achievability than the comps imply.
- What's the recent tenant-quality profile in this submarket — average credit score on applications, eviction rate, late-payment / NSF rate, and stable-employment percentage? A property-management company in the area should have these aggregated.
- How much new for-sale + rental construction is in the pipeline within 1–3 miles? Heavy new supply typically softens prices + rents 12–24 months out; constrained supply supports both.
Investment metrics
- 1% rule
- 0.99% ✗
- Cap rate
- 7.54%
- Cash-on-cash
- 4.45%
- DSCR
- 1.20
- GRM
- 8.5
CMA / ARV
- ARV (median comp)
- $77,410
- List price
- $105,000
- Delta
- 35.64%
- Verdict
- OVERPRICED
- Comps
- 4 within 1.0 mi
Projected returns pro-forma
4.07% appreciation · 3.0% rent growth · sell at horizon
- IRR
- 14.4%
- Equity multiple
- 1.87×
- Total profit
- $25,671
- Equity at exit
- $53,681
- IRR
- 15.5%
- Equity multiple
- 3.53×
- Total profit
- $74,514
- Equity at exit
- $88,157
Cash invested: $29,400 (down + closing). Projections, not guarantees.
Landlord ↔ Tenant lean methodology
- Overall (STATE)
- 90 Strongly Landlord-Friendly
- State Georgia
- 90 Strongly Landlord-Friendly · R+3
- County
- — inherits STATE
- City
- — inherits STATE
ZIP-level market 39854
- Home prices YoY
- 2.4%
- Active inventory
- 78
- Price-to-rent
- 8.5×
Monthly cashflow live
- Estimated rent
- $1,035 medium interval (Pro) →
- Mortgage (P&I)
- −$551
- Tax from tax record
- −$114 /mo · $1,368/yr
- Insurance
- −$44
- HOA
- −$0
- Vacancy / Maint / Mgmt
- −$217
- Net cashflow
- $109
Break-even live
UW: 25.0% down · 7.5% · 30yr · 1.5% tax · 5.0% vac · 8.0% maint · 8.0% mgmt
Financing live
Cash to close
- Down payment
- $26,250
- Closing costs
- $3,150
- Reserves months
- —
- Total cash needed
- —
Loan-product check · same deal, 3 products live
Conventional
25% down · 7.5% · 30yr
- Down + closing
- —
- Monthly P&I
- —
- Monthly cashflow
- —
- DSCR
- —
- Eligible?
- —
Personal DTI + credit; lowest rate.
DSCR
20% down · 8.5% · 30yr
- Down + closing
- —
- Monthly P&I
- —
- Monthly cashflow
- —
- DSCR
- —
- Eligible?
- —
No personal income docs; deal must DSCR.
Hard money
10% down · 12.0% · 12mo
- Down + closing
- —
- Monthly P&I
- —
- Monthly cashflow
- —
- DSCR
- —
- Eligible?
- —
Short-term bridge; refi at stabilization.
Listing history 16 events
-
2026-06-18days on market $105,000 Active 118 DOM
-
2026-06-17days on market $105,000 Active 117 DOM
-
2026-06-16days on market $105,000 Active 116 DOM
-
2026-06-15days on market $105,000 Active 115 DOM
-
2026-06-13days on market $105,000 Active 113 DOM
-
2026-06-12days on market $105,000 Active 112 DOM
-
2026-06-09days on market $105,000 Active 109 DOM
-
2026-06-08days on market $105,000 Active 108 DOM
-
2026-06-07days on market $105,000 Active 107 DOM
-
2026-06-05days on market $105,000 Active 105 DOM
-
2026-06-04days on market $105,000 Active 103 DOM
-
2026-06-02days on market $105,000 Active 102 DOM
-
2026-06-01days on market $105,000 Active 101 DOM
-
2026-05-31days on market $105,000 Active 100 DOM
-
2026-05-31days on market $105,000 Active 99 DOM
-
2026-02-20$115,000 Active 169-char remark
Show marketing remark (169 chars)
Great Starter home or downsizing. Brick home with living rm, Dining/kitchen, den (enclosed garage), full bath and a 3/4 bath. large backyard and located on a corner lot.
ⓘ Source: listings_history table (triggers on properties + properties_extension) + one-shot
backfill from property_details.listing_events for pre-trigger history.
Tax reassessment forecast GA · Resets to sale price
- Current annual tax
- $1,368 · $114/mo
- Projected year-2 tax
- $1,368 · $114/mo
- Expected delta
- $0/yr ($0/mo · 0.0%)
ⓘ Screening estimate from a state-policy table — verify with the county assessor before closing.
Climate risk First Street
- Flood 3/10 Moderate FEMA zone X (unshaded) · 20% chance over 30 yrs
- Wildfire 5/10 Major
- Heat 8/10 Severe 7 d/yr ≥106°F today · 20 d/yr by 30 yrs out
- Wind 8/10 Severe 80% chance of damaging wind over 30 yrs
- Air quality 3/10 Moderate 2 unhealthy d/yr today · 3 by 30 yrs out
Nearby sold comps map
Loading sold comps map…
Walkable amenities ~0.75 mi
Loading nearby amenities…
Taxation est. · year 1
- Rental income
- $12,414
- − Mortgage interest
- −$5,882
- − Property taxes
- −$1,368
- − Insurance
- −$525
- − Repairs & maintenance
- −$993
- − Management
- −$993
- − Depreciation
- −$3,055
- Taxable loss
- −$401
- Est. tax savings @ 24.0%
- +$96
- After-tax cash flow
- $1,403/yr
For passive investors: Depreciation is non-cash, so a rental often shows a tax loss while cash-flowing — sheltering income. Rental losses are passive: they offset passive income freely, and up to $25,000/yr can offset ordinary (W-2) income if you actively participate and your MAGI is under $100k (phasing out to $0 by $150k); unused losses carry forward. On sale, claimed depreciation is recaptured at up to 25%, and gains may owe capital-gains tax (a 1031 exchange can defer both). Figures are a year-1 estimate at your 24.0% rate — not tax advice; consult a CPA.
Schools (NCES district)
- District
- Quitman County
- NCES district ID
- 1304290
- Math proficiency
- 10% ▬ 0.00%
- Reading proficiency
- 15% ▲ 5.00%
- Median HH income
- $32,082
- Composite
- 13.53/100
- National rank
- #14489
- State rank
- #184 of 187 in GA
Livability — Georgetown-Quitman County
No livability data for this city. (Only ~50 U.S. cities are tracked.)
Census & demographics
- Census place
- Georgetown-Quitman County, GA
- City population
- 2,407
- Population (ZIP)
- 2,295
Population outlook (Quitman County) Hauer SSP2
- Today (2025)
- 1,977 people
- By 2030
- 1,789 · -9.5%
- By 2040
- 1,445 · -26.9%
- By 2050
- 1,148 · -41.9%
- By 2075
- 590 · -70.2%
- By 2100
- 328 · -83.4%
Race, ethnicity, and origin ACS 2023
- Race & ethnicity
- White 49% Black 48% Two or more races 2% Hispanic / Latino 1%
- Common ancestry
- Romanian 1% Serbian 1% Iranian 1%
- Foreign-born
- 0% · Canada, Jamaica
Political lean MEDSL · Quitman
- 2024 margin
- R (+15.4) · D 42.1% · R 57.5%
- 2008→2024 swing
- -23.3pp toward R · 2008: 7.9pp · 2024: -15.4pp
- All cycles
- 2024: R+15.4 2020: R+9.7 2016: R+10.9 2012: D+9.1 2008: D+7.9
Not yet ingested
- Civics
- —
Market trends
- HPI YoY
- ▲ 4.07%
- Current HPI
- 172.7909
- Rent YoY
- —
- Metro
- —
- State GDP YoY
- ▲ 2.66%
- F500 in state
- 28
Industry mix (Fortune 500 HQ in GA)
| Industry | F500 HQs | Revenue |
|---|---|---|
| Paper / Packaging | 2 | $29B |
|
||
| Retail | 1 | $160B |
|
||
| Transportation / Logistics | 1 | $91B |
|
||
| Airlines | 1 | $62B |
|
||
| Consumer Goods | 1 | $47B |
|
||
| Utilities | 1 | $25B |
|
||
Price history
1 event — show timeline
- 2026-02-20 Listed $115,000 EBOR
Property tax history
+6.4%/yrLatest (2025): $1,368 · +4.4% YoY. Source: county tax records.
Cash-flow waterfall
monthlySold comps — $/sqft
last 12 mo · ≤1 miLoading sold comps…