2515 Avenue C · Ingleside, TX
Flood risk 4/10 · Minor
- FEMA flood zone
- X (unshaded)
- Chance of flooding over 30 yrs
- 0.22%
- Est. flood insurance / yr
- $507 – $1,088
Fire risk 3/10 · Minor
- Est. fire insurance / yr
- $1,222 – $2,270
Heat risk 10/10 · Severe
- Hot days now (above 106°F)
- 7 days/yr
- Hot days in 30 yrs
- 29 days/yr
Wind risk 9/10 · Severe
- Chance of severe wind over 30 yrs
- 99.0%
Air-quality risk 1/10 · Minimal
- Unhealthy air days now
- 0 days/yr
- Unhealthy air days in 30 yrs
- 0 days/yr
Risk factors via First Street. Map © Google.
Why this score? — see what drove the C+ grade
The composite is a weighted blend of 9 inputs, each scored 0–100. Each bar is that input's sub-score; the figure is the points it added to the 100-point composite (weight × sub-score).
- Cash flow +25.7/30.0
- 1% rule +9.2/10.0
- DSCR +8.6/10.0
- ARV discount +7.5/15.0
- Schools +3.6/10.0
- Livability +3.6/5.0
- Condition / age +2.5/5.0
- Appreciation +0.0/10.0
- Rent growth +0.0/5.0
$113,750
🖨 Deal sheet 📄 Offer letter ✓ Due diligence
Listing remarks MLS
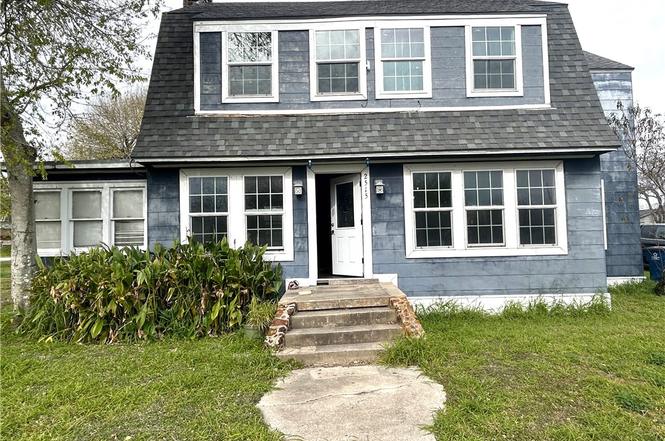
CLASSIC 2 STORY HOME BUILT IN 1939. HUGE CORNER LOT WITH TREES. HARDWOOD FLOORS. HIGH CEILINGS. WITH A LITTLE TLC THIS OLD HOUSE WILL SHINE.
Key facts
- Future development
- Value-add potential
- Functional layout
Tags
Neighborhood map
What this means for you Summary
Snapshot
- This is a 3-bed/2.5-bath single-family listed at $114k.
Deal economics
- At list price, monthly cash flow is $274 ($3k/yr) — positive.
- The deal already cash-flows at list — no discount required.
- Meets the 1% rule at list price ($2k rent vs $114k).
- Recommended offer: $107k (6.0% below list) — sets the bar for market timing.
- Cap rate 9.2% vs local median 3.4% in Ingleside — top-decile yield for the area; either an underpriced asset or a hidden risk that comps aren't pricing in. Stress-test before assuming the spread holds.
Location & tenants
- Location reads 71/100 on livability (#323 in TX) — a middle-class / working-renter tenant base. Strengths: cost of living A+, housing A+, employment B; Watch: schools D+, crime F, amenities F.
- Ingleside ISD (town): math 39% / reading 44% proficiency, ranked #319 of 826 in TX (top 39%) — families likely to look elsewhere, expect single-tenant / working-renter base with shorter leases.
- Market conditions: Rents falling (-11.8%/yr); 146 active listings in the ZIP; 344 units permitted in San Patricio County in 2024 (0 in 5+ unit buildings).
Forward outlook
- Local home prices are declining (-3.0%/yr); year-one equity from $786 of loan paydown is wiped out by about $3k of value loss. Plan a longer hold.
- San Patricio County population projected at +27% by 2050 — long-run rental-demand tailwind backs the buy-and-hold thesis.
Negotiation context
- It's been on market 72 days — a 6% lower offer ($107k) is reasonable based on typical stale-listing flexibility.
- 2 sale attempts since 25y ago; this cycle's ask has dropped $26k (19%) from the opening price — seller is motivated, your offer sets the floor, not the list.
- Current owner paid $56k; list at $114k implies a 103% gain — meaningful room to come down on a strong offer.
Risks & watch-outs
- Watch-outs: property tax is 3.8% of price; built in 1939 — expect roof / HVAC / electrical / plumbing capex.
- Climate carrying-cost: severe wind risk, 99% chance of damaging wind over 30y; extreme-heat days projected 7→29/yr by 2055 (HVAC capex compounding) — expect insurance premiums to compound above CPI over the hold.
Questions for the listing agent
- It's been on market 72 days. Have you received any prior offers? Is the seller open to a 6% concession, seller financing, or rate buy-down credit?
- Built in 1939 — when were the roof, HVAC, electrical panel, plumbing, and water heater last replaced?
- Property tax is high relative to price — has the assessment been appealed recently, and will the sale trigger a re-assessment?
- Why hasn't it sold? Are there any deal-killer items the seller is aware of (foundation, flood, title, zoning, code violations)?
- Is there a deadline driving the sale (1031 exchange, divorce, estate, relocation)? That informs how much negotiation room exists.
- Schools are D-rated, which usually means shorter tenancies and higher turnover. Who's the typical renter profile here, and what's been the actual vacancy rate?
- Crime grade is F in this area — have there been break-ins, vandalism, or insurance claims at this property in the last 3 years? What carrier currently insures it and at what premium?
- What's the average days-on-market for RENTAL listings here right now (not sales)? A rising rental-DOM trend means longer vacancies and softer asking-rent achievability than the comps imply.
- What's the recent tenant-quality profile in this submarket — average credit score on applications, eviction rate, late-payment / NSF rate, and stable-employment percentage? A property-management company in the area should have these aggregated.
- How much new for-sale + rental construction is in the pipeline within 1–3 miles? Heavy new supply typically softens prices + rents 12–24 months out; constrained supply supports both.
Investment metrics
- 1% rule
- 1.42% ✓
- Cap rate
- 9.18%
- Cash-on-cash
- 10.31%
- DSCR
- 1.46
- GRM
- 5.9
CMA / ARV
- ARV (on-the-fly)
- $310,758
- Comps found
- 6
Show comp detail 6 sales within ~0.75 mi
| Address | Dist | Beds/Ba | Sqft | Sold | Price | $/sf | Match |
|---|---|---|---|---|---|---|---|
| 2589 Arkansas St | 0.17mi | 3/2.5 | 2,044 (-1%) | 12mo | $234,900 | $115 | 81 |
| 2528 Live Oak St | 0.38mi | 3/2.0 | 1,889 (-8%) | 2mo | $285,000 | $151 | 65 |
| 2741 Avenue F | 0.42mi | 3/2.0 | 2,024 (-2%) | 19mo | $239,900 | $119 | 60 |
| 2321 Mesquite Cir | 0.41mi | 3/2.0 | 1,750 (-15%) | 2mo | $289,000 | $165 | 53 |
| 2614 Poinsetta Pl | 0.52mi | 4/2.0 (+1) | 1,818 (-12%) | 11mo | $268,500 | $148 | 40 |
| 2417 Country Oaks Cir | 0.74mi | 4/3.0 (+1) | 2,207 (+7%) | 21mo | $390,000 | $177 | 29 |
Match score weights: distance 35% · size 25% · config 20% · recency 20%. Top-matched comps best support the ARV.
Projected returns pro-forma
-3.0% appreciation · 0.0% rent growth · sell at horizon
- IRR
- -4.9%
- Equity multiple
- 0.82×
- Total profit
- $-5,594
- Equity at exit
- $16,960
- IRR
- -0.1%
- Equity multiple
- 1.00×
- Total profit
- $-119
- Equity at exit
- $9,835
Cash invested: $31,850 (down + closing). Projections, not guarantees.
Landlord ↔ Tenant lean methodology
- Overall (STATE)
- 87 Strongly Landlord-Friendly
- State Texas
- 87 Strongly Landlord-Friendly · R+5
- County
- — inherits STATE
- City
- — inherits STATE
ZIP-level market 78362
- Home prices YoY
- -21.7%
- Rents YoY
- -11.8%
- Active inventory
- 146
- Price-to-rent
- 5.9×
Monthly cashflow live
- Estimated rent
- $1,618 medium interval (Pro) →
- Mortgage (P&I)
- −$597
- Tax from tax record
- −$361 /mo · $4,331/yr
- Insurance
- −$47
- HOA
- −$0
- Vacancy / Maint / Mgmt
- −$340
- Net cashflow
- $274
Break-even live
UW: 25.0% down · 7.5% · 30yr · 1.5% tax · 5.0% vac · 8.0% maint · 8.0% mgmt
Financing live
Cash to close
- Down payment
- $28,438
- Closing costs
- $3,412
- Reserves months
- —
- Total cash needed
- —
Loan-product check · same deal, 3 products live
Conventional
25% down · 7.5% · 30yr
- Down + closing
- —
- Monthly P&I
- —
- Monthly cashflow
- —
- DSCR
- —
- Eligible?
- —
Personal DTI + credit; lowest rate.
DSCR
20% down · 8.5% · 30yr
- Down + closing
- —
- Monthly P&I
- —
- Monthly cashflow
- —
- DSCR
- —
- Eligible?
- —
No personal income docs; deal must DSCR.
Hard money
10% down · 12.0% · 12mo
- Down + closing
- —
- Monthly P&I
- —
- Monthly cashflow
- —
- DSCR
- —
- Eligible?
- —
Short-term bridge; refi at stabilization.
Listing history 20 events
-
2026-06-07statusdays on market $113,750 Pending 72 DOM
-
2026-06-03days on market $113,750 Active 71 DOM
-
2026-06-02days on market $113,750 Active 70 DOM
-
2026-06-01days on market $113,750 Active 69 DOM
-
2026-05-31days on market $113,750 Active 68 DOM
-
2026-05-30days on market $113,750 Active 67 DOM
-
2026-04-01status Pending
-
2026-03-19price $113,750
-
2026-03-13price $113,900
-
2026-03-05price $114,900
-
2026-02-26price $119,900
-
2026-02-20price $126,900
-
2026-02-13price $129,900
-
2026-02-05price $134,900
-
2026-01-29$139,900 Active
-
2012-07-19soldstatus
-
2002-06-20soldstatus $56,000
-
2002-06-18soldstatus 141-char remark
Show marketing remark (141 chars)
CLASSIC 2 STORY HOME BUILT IN 1939. HUGE CORNER LOT WITH TREES. HARDWOOD FLOORS. HIGH CEILINGS. WITH A LITTLE TLC THIS OLD HOUSE WILL SHINE.
-
2002-06-18soldstatus $56,000
Show marketing remark (141 chars)
CLASSIC 2 STORY HOME BUILT IN 1939. HUGE CORNER LOT WITH TREES. HARDWOOD FLOORS. HIGH CEILINGS. WITH A LITTLE TLC THIS OLD HOUSE WILL SHINE.
-
2001-09-07$56,000 141-char remark
Show marketing remark (141 chars)
CLASSIC 2 STORY HOME BUILT IN 1939. HUGE CORNER LOT WITH TREES. HARDWOOD FLOORS. HIGH CEILINGS. WITH A LITTLE TLC THIS OLD HOUSE WILL SHINE.
ⓘ Source: listings_history table (triggers on properties + properties_extension) + one-shot
backfill from property_details.listing_events for pre-trigger history.
Tax reassessment forecast TX · Resets to sale price
- Current annual tax
- $4,331 · $361/mo
- Projected year-2 tax
- $4,331 · $361/mo
- Expected delta
- $0/yr ($0/mo · 0.0%)
ⓘ Screening estimate from a state-policy table — verify with the county assessor before closing.
Climate risk First Street
- Flood 4/10 Moderate FEMA zone X (unshaded) · 22% chance over 30 yrs
- Wildfire 3/10 Moderate
- Heat 10/10 Extreme 7 d/yr ≥106°F today · 29 d/yr by 30 yrs out
- Wind 9/10 Extreme 99% chance of damaging wind over 30 yrs
- Air quality 1/10 Low 0 unhealthy d/yr today · 0 by 30 yrs out
Nearby sold comps map
Loading sold comps map…
Walkable amenities ~0.75 mi
Loading nearby amenities…
Taxation est. · year 1
- Rental income
- $19,418
- − Mortgage interest
- −$6,372
- − Property taxes
- −$4,331
- − Insurance
- −$569
- − Repairs & maintenance
- −$1,553
- − Management
- −$1,553
- − Depreciation
- −$3,309
- Taxable income
- $1,731
- Est. tax owed @ 24.0%
- −$415
- After-tax cash flow
- $2,867/yr
For passive investors: Depreciation is non-cash, so a rental often shows a tax loss while cash-flowing — sheltering income. Rental losses are passive: they offset passive income freely, and up to $25,000/yr can offset ordinary (W-2) income if you actively participate and your MAGI is under $100k (phasing out to $0 by $150k); unused losses carry forward. On sale, claimed depreciation is recaptured at up to 25%, and gains may owe capital-gains tax (a 1031 exchange can defer both). Figures are a year-1 estimate at your 24.0% rate — not tax advice; consult a CPA.
Schools (NCES district)
- District
- Ingleside ISD
- NCES district ID
- 4824180
- Math proficiency
- 39% ▼ -9.00%
- Reading proficiency
- 44% ▲ 1.00%
- Median HH income
- $57,908
- Composite
- 36.48/100
- National rank
- #4659
- State rank
- #319 of 826 in TX
Livability — Ingleside
- Score
- 71/100
- State rank
- #323
- US rank
- #7128
Category grades
Schools grade is shown separately in the Schools card above.
Census & demographics
- Census place
- Ingleside, TX
- County
- San Patricio County · 31,224 people
- City population
- 10,816
- Metro
- Corpus Christi, TX
- Population (ZIP)
- 10,816
- Household income
- $71,058
- Rent vs Own
- Severe rent burden
- 226.0
Population outlook (San Patricio County) Hauer SSP2
- Today (2025)
- 75,538 people
- By 2030
- 79,575 · +5.3%
- By 2040
- 87,670 · +16.1%
- By 2050
- 96,107 · +27.2%
- By 2075
- 117,984 · +56.2%
- By 2100
- 130,010 · +72.1%
Race, ethnicity, and origin ACS 2023
- Neighborhood character
- Diverse neighborhood (Simpson 0.56)
- Race & ethnicity
- White 52% Hispanic / Latino 42% Two or more races 19% Black 2%
- Hispanic origin (detail)
- Mexican 39% Cuban 2%
- Common ancestry
- Slovak 1% Portuguese 1% Romanian 1%
- Foreign-born
- 8% · Canada
- Languages at home
- 78% English-only · Spanish 20%
Political lean MEDSL · San Patricio
- 2024 margin
- Solid R (+36.4) · D 31.4% · R 67.8%
- 2008→2024 swing
- -19.8pp toward R · 2008: -16.6pp · 2024: -36.4pp
- All cycles
- 2024: R+36.4 2020: R+29.1 2016: R+24.1 2012: R+20.6 2008: R+16.6
Not yet ingested
- Civics
- —
Market trends
- HPI YoY
- ▼ -54.88%
- Current HPI
- 197.9261
- Rent YoY
- ▼ -11.80%
- Metro
- Corpus Christi, TX
- State GDP YoY
- ▲ 3.95%
- F500 in state
- 110
Industry mix (Fortune 500 HQ in TX)
| Industry | F500 HQs | Revenue |
|---|---|---|
| Energy | 16 | $1,198B |
|
||
| Technology | 5 | $198B |
|
||
| Engineering / Construction | 4 | $72B |
|
||
| Energy Services | 3 | $60B |
|
||
| Utilities | 3 | $41B |
|
||
| Healthcare | 2 | $330B |
|
||
Price history
+103.1% since first listed14 events — show timeline
- 2026-04-01 Pending — CBMLS
- 2026-03-19 Price Changed $113,750 CBMLS
- 2026-03-13 Price Changed $113,900 CBMLS
- 2026-03-05 Price Changed $114,900 CBMLS
- 2026-02-26 Price Changed $119,900 CBMLS
- 2026-02-20 Price Changed $126,900 CBMLS
- 2026-02-13 Price Changed $129,900 CBMLS
- 2026-02-05 Price Changed $134,900 CBMLS
- 2026-01-29 Listed $139,900 CBMLS
- 2012-07-19 Sold (Public Records) — Public Records
- 2002-06-20 Sold (Public Records) $56,000 Public Records
- 2002-06-18 Sold (Public Records) $56,000 Public Records
- 2002-06-18 Sold (MLS) — CBMLS
- 2001-09-07 Listed $56,000 CBMLS
Property tax history
+8.6%/yrLatest (2025): $4,331 · +18.5% YoY. Source: county tax records.
Cash-flow waterfall
monthlySold comps — $/sqft
last 12 mo · ≤1 miLoading sold comps…