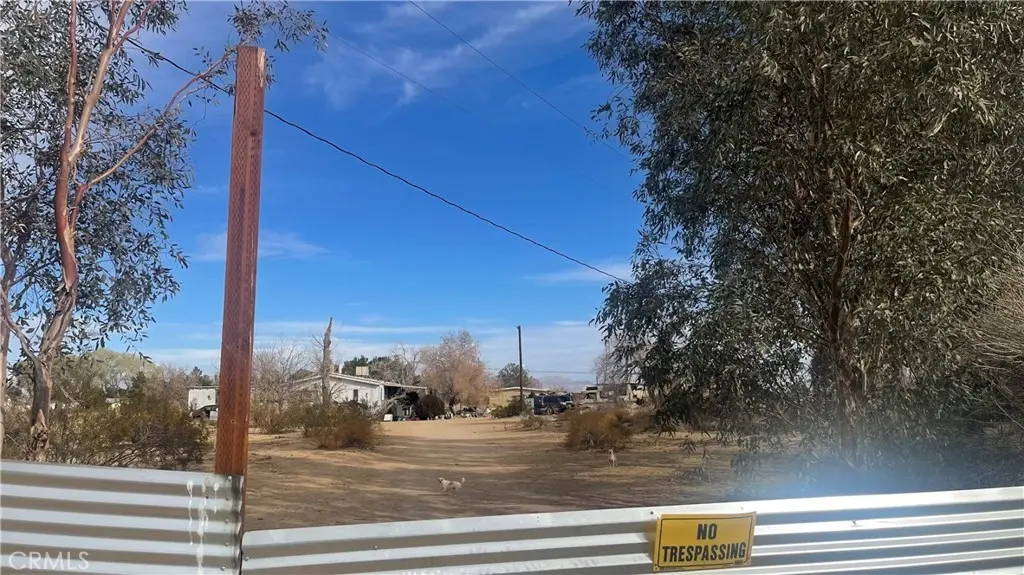
1952 Blackbird St · Inyokern, CA
Flood risk 1/10 · Minimal
- FEMA flood zone
- X (unshaded)
- Chance of flooding over 30 yrs
- 0.0%
- Est. flood insurance / yr
- $507 – $1,088
Fire risk 3/10 · Minor
- Est. fire insurance / yr
- $659 – $1,223
Heat risk 8/10 · Major
- Hot days now (above 104°F)
- 6 days/yr
- Hot days in 30 yrs
- 16 days/yr
Wind risk 1/10 · Minimal
- Chance of severe wind over 30 yrs
- —
Air-quality risk 5/10 · Moderate
- Unhealthy air days now
- 6 days/yr
- Unhealthy air days in 30 yrs
- 8 days/yr
Risk factors via First Street. Map © Google.
Why this score? — see what drove the C- grade
The composite is a weighted blend of 9 inputs, each scored 0–100. Each bar is that input's sub-score; the figure is the points it added to the 100-point composite (weight × sub-score).
- ARV discount +15.0/15.0
- Cash flow +14.9/30.0
- Appreciation +6.8/10.0
- DSCR +4.5/10.0
- 1% rule +3.1/10.0
- Schools +2.9/10.0
- Rent growth +2.5/5.0
- Condition / age +2.5/5.0
- Livability +2.0/5.0
$154,900
🖨 Deal sheet (PDF) 📄 Offer letter ✓ Due diligence
Listing remarks MLS
This property is located on over 5 acres close to the highway. The MFG on the property is showing to be built in 1987 with 4 bedrooms, 2 bathrooms, and 1848 sq ft. Title shows it to be on a permanent foundation. Financing is doubtful.
Key facts
- Over 5 acres
- Permanent foundation
- 5.04 acre lot
Tags
Neighborhood map
What this means for you Summary
Snapshot
- This is a 4-bed/2.0-bath manufactured listed at $155k.
Deal economics
- At list price, monthly cash flow is $44 ($532/yr) — positive.
- The deal already cash-flows at list — no discount required.
- To meet the 1% rule (rent ≥ 1% of price), the offer needs to be $125k (19.3% below list).
- Recommended offer: $125k (19.3% below list) — sets the bar for 1% rule.
Location & tenants
- Location reads 39/100 on livability (#1,398 in CA) — a limited-amenity area; tenant pool skews transient or value-seeking. Strengths: crime A, commute A-; Watch: schools C-, amenities F, employment F.
- Sierra Sands Unified (town): math 25% / reading 39% proficiency, ranked #294 of 517 in CA (top 57%) — families likely to look elsewhere, expect single-tenant / working-renter base with shorter leases.
- Market conditions: 93 active listings in the ZIP; 1 comparable units currently listed for rent nearby; 3,244 units permitted in Kern County in 2024 (73 in 5+ unit buildings).
Forward outlook
- In year one you build about $7k of equity ($1k loan paydown + $6k appreciation (3.6% local appreciation)).
- Kern County population projected at +17% by 2050 — long-run rental-demand tailwind backs the buy-and-hold thesis.
- At projected returns (3.6% appreciation + 3.0% rent growth), your $43k cash investment doubles in ~6 years — after that, you're playing with house money.
- By year 6, paydown + projected appreciation supports a ~$36k cash-out refi (75% LTV) — recoverable capital for the next deal without selling this one.
Negotiation context
- It's been on market 327 days — a 12% lower offer ($136k) is reasonable based on typical stale-listing flexibility.
- 2 sale attempts; this cycle's ask has dropped $45k (23%) from the opening price — seller is motivated, your offer sets the floor, not the list.
Risks & watch-outs
- Climate carrying-cost: extreme-heat days projected 6→16/yr by 2055 (HVAC capex compounding) — expect insurance premiums to compound above CPI over the hold.
Questions for the listing agent
- It's been on market 327 days. Have you received any prior offers? Is the seller open to a 19% concession, seller financing, or rate buy-down credit?
- Why hasn't it sold? Are there any deal-killer items the seller is aware of (foundation, flood, title, zoning, code violations)?
- Is there a deadline driving the sale (1031 exchange, divorce, estate, relocation)? That informs how much negotiation room exists.
- What's the average days-on-market for RENTAL listings here right now (not sales)? A rising rental-DOM trend means longer vacancies and softer asking-rent achievability than the comps imply.
- What's the recent tenant-quality profile in this submarket — average credit score on applications, eviction rate, late-payment / NSF rate, and stable-employment percentage? A property-management company in the area should have these aggregated.
- How much new for-sale + rental construction is in the pipeline within 1–3 miles? Heavy new supply typically softens prices + rents 12–24 months out; constrained supply supports both.
Investment metrics
- 1% rule
- 0.81% ✗
- Cap rate
- 6.64%
- Cash-on-cash
- 1.23%
- DSCR
- 1.05
- GRM
- 10.3
CMA / ARV
- ARV (median comp)
- $284,050
- List price
- $154,900
- Delta
- -45.47%
- Verdict
- UNDERPRICED
- Comps
- 2 within 1.0 mi
Show comp detail 2 sales within ~0.75 mi
| Address | Dist | Beds/Ba | Sqft | Sold | Price | $/sf | Match |
|---|---|---|---|---|---|---|---|
| 1932 Blackbird St | 0.05mi | 4/3.0 | 1,836 (-1%) | 5mo | $275,000 | $150 | 88 |
| 1639 N Planet St | 0.68mi | 3/2.0 (-1) | 1,678 (-9%) | 8mo | $297,500 | $177 | 41 |
Match score weights: distance 35% · size 25% · config 20% · recency 20%. Top-matched comps best support the ARV.
Projected returns pro-forma
3.63% appreciation · 3.0% rent growth · sell at horizon
- IRR
- 10.4%
- Equity multiple
- 1.61×
- Total profit
- $26,667
- Equity at exit
- $75,226
- IRR
- 12.3%
- Equity multiple
- 2.95×
- Total profit
- $84,598
- Equity at exit
- $120,468
Cash invested: $43,372 (down + closing). Projections, not guarantees.
Landlord ↔ Tenant lean methodology
- Overall (STATE)
- 18 Strongly Tenant-Friendly
- State California
- 18 Strongly Tenant-Friendly · D+13
- County
- — inherits STATE
- City
- — inherits STATE
ZIP-level market 93527
- Home prices YoY
- 0.7%
- Active inventory
- 93
- Price-to-rent
- 10.3×
Monthly cashflow live
- Estimated rent
- $1,250 medium interval (Pro) →
- Mortgage (P&I)
- −$812
- Tax from tax record
- −$66 /mo · $796/yr
- Insurance
- −$65
- HOA
- −$0
- Vacancy / Maint / Mgmt
- −$262
- Net cashflow
- $44
Break-even live
Sensitivity live
| Price | -10% $132 | -5% $88 | +0% $44 | +5% $1 | +10% $-43 |
|---|---|---|---|---|---|
| Rent | -10% $-54 | -5% $-5 | +0% $44 | +5% $94 | +10% $143 |
| Rate | -1.0pp $122 | -0.5pp $84 | base $44 | +0.5pp $4 | +1.0pp $-37 |
UW: 25.0% down · 7.5% · 30yr · 1.5% tax · 5.0% vac · 8.0% maint · 8.0% mgmt
Financing live
Cash to close
- Down payment
- $38,725
- Closing costs
- $4,647
- Reserves months
- —
- Total cash needed
- —
Loan-product check · same deal, 3 products live
Conventional
25% down · 7.5% · 30yr
- Down + closing
- —
- Monthly P&I
- —
- Monthly cashflow
- —
- DSCR
- —
- Eligible?
- —
Personal DTI + credit; lowest rate.
DSCR
20% down · 8.5% · 30yr
- Down + closing
- —
- Monthly P&I
- —
- Monthly cashflow
- —
- DSCR
- —
- Eligible?
- —
No personal income docs; deal must DSCR.
Hard money
10% down · 12.0% · 12mo
- Down + closing
- —
- Monthly P&I
- —
- Monthly cashflow
- —
- DSCR
- —
- Eligible?
- —
Short-term bridge; refi at stabilization.
Rent comps 1 comps
| Address | Beds | Baths | Sqft | Rent | $/sqft | DOM | Units | Dist |
|---|---|---|---|---|---|---|---|---|
| 6701 Mountain View Ave Unit 1 Inyokern, CA | 3.0 | 2.0 | 1330 | $1,250 | $0.94 | 3d | 1 | 1.26mi |
Listing history 20 events
-
2026-06-18days on market $154,900 Active 327 DOM
-
2026-06-17days on market $154,900 Active 326 DOM
-
2026-06-16days on market $154,900 Active 325 DOM
-
2026-06-15days on market $154,900 Active 324 DOM
-
2026-06-14days on market $154,900 Active 322 DOM
-
2026-06-13days on market $154,900 Active 321 DOM
-
2026-06-10days on market $154,900 Active 319 DOM
-
2026-06-09days on market $154,900 Active 318 DOM
-
2026-06-08days on market $154,900 Active 317 DOM
-
2026-06-07days on market $154,900 Active 316 DOM
-
2026-06-05days on market $154,900 Active 313 DOM
-
2026-06-03days on market $154,900 Active 312 DOM
-
2026-06-03days on market $154,900 Active 311 DOM
-
2026-06-01days on market $154,900 Active 310 DOM
-
2026-05-31days on market $154,900 Active 309 DOM
-
2026-04-20status Active 234-char remark
Show marketing remark (234 chars)
This property is located on over 5 acres close to the highway. The MFG on the property is showing to be built in 1987 with 4 bedrooms, 2 bathrooms, and 1848 sq ft. Title shows it to be on a permanent foundation. Financing is doubtful.
-
2025-12-23price $154,900 234-char remark
Show marketing remark (234 chars)
This property is located on over 5 acres close to the highway. The MFG on the property is showing to be built in 1987 with 4 bedrooms, 2 bathrooms, and 1848 sq ft. Title shows it to be on a permanent foundation. Financing is doubtful.
-
2025-09-12price $175,000
Show marketing remark (234 chars)
This property is located on over 5 acres close to the highway. The MFG on the property is showing to be built in 1987 with 4 bedrooms, 2 bathrooms, and 1848 sq ft. Title shows it to be on a permanent foundation. Financing is doubtful.
-
2025-09-12price $175,000 234-char remark
Show marketing remark (234 chars)
This property is located on over 5 acres close to the highway. The MFG on the property is showing to be built in 1987 with 4 bedrooms, 2 bathrooms, and 1848 sq ft. Title shows it to be on a permanent foundation. Financing is doubtful.
-
2025-06-25$199,900 Active 234-char remark
Show marketing remark (234 chars)
This property is located on over 5 acres close to the highway. The MFG on the property is showing to be built in 1987 with 4 bedrooms, 2 bathrooms, and 1848 sq ft. Title shows it to be on a permanent foundation. Financing is doubtful.
ⓘ Source: listings_history table (triggers on properties + properties_extension) + one-shot
backfill from property_details.listing_events for pre-trigger history.
Tax reassessment forecast CA · Resets to sale price
- Current annual tax
- $796 · $66/mo
- Projected year-2 tax
- $1,177 · $98/mo
- Expected delta
- +$382/yr (+$32/mo · 48.0%)
ⓘ Screening estimate from a state-policy table — verify with the county assessor before closing.
Climate risk First Street
- Flood 1/10 Low FEMA zone X (unshaded) · 0% chance over 30 yrs
- Wildfire 3/10 Moderate
- Heat 8/10 Severe 6 d/yr ≥104°F today · 16 d/yr by 30 yrs out
- Wind 1/10 Low
- Air quality 5/10 Major 6 unhealthy d/yr today · 8 by 30 yrs out
Nearby sold comps map
Loading sold comps map…
Walkable amenities ~0.75 mi
Loading nearby amenities…
Taxation est. · year 1
- Rental income
- $15,000
- − Mortgage interest
- −$8,677
- − Property taxes
- −$796
- − Insurance
- −$774
- − Repairs & maintenance
- −$1,200
- − Management
- −$1,200
- − Depreciation
- −$4,506
- Taxable loss
- −$2,153
- Est. tax savings @ 24.0%
- +$517
- After-tax cash flow
- $1,049/yr
For passive investors: Depreciation is non-cash, so a rental often shows a tax loss while cash-flowing — sheltering income. Rental losses are passive: they offset passive income freely, and up to $25,000/yr can offset ordinary (W-2) income if you actively participate and your MAGI is under $100k (phasing out to $0 by $150k); unused losses carry forward. On sale, claimed depreciation is recaptured at up to 25%, and gains may owe capital-gains tax (a 1031 exchange can defer both). Figures are a year-1 estimate at your 24.0% rate — not tax advice; consult a CPA.
Schools (NCES district)
- District
- Sierra Sands Unified
- NCES district ID
- 0636800
- Math proficiency
- 25% ▼ -11.00%
- Reading proficiency
- 39% ▼ -11.00%
- Median HH income
- $58,937
- Composite
- 28.66/100
- National rank
- #6699
- State rank
- #294 of 517 in CA
Livability — Inyokern
- Score
- 39/100
- State rank
- #1398
- US rank
- #27420
Category grades
Schools grade is shown separately in the Schools card above.
Census & demographics
- Census place
- Inyokern, CA
- Population (ZIP)
- 1,801
Population outlook (Kern County) Hauer SSP2
- Today (2025)
- 947,286 people
- By 2030
- 978,984 · +3.3%
- By 2040
- 1,045,018 · +10.3%
- By 2050
- 1,105,232 · +16.7%
- By 2075
- 1,229,538 · +29.8%
- By 2100
- 1,238,059 · +30.7%
Race, ethnicity, and origin ACS 2023
- Neighborhood character
- Predominantly White (81%)
- Race & ethnicity
- White 81% Two or more races 11% Hispanic / Latino 9%
- Hispanic origin (detail)
- Mexican 8%
- Common ancestry
- Slovak 4% Scotch-Irish 3% Portuguese 3%
- Foreign-born
- 3% · Canada, China
- Languages at home
- 95% English-only · Spanish 2% German/W. Germanic 2% Chinese 1%
Political lean MEDSL · Kern
- 2024 margin
- Strong R (+21.1) · D 38.2% · R 59.3% · Other 2.5%
- 2008→2024 swing
- -3.3pp toward R · 2008: -17.8pp · 2024: -21.1pp
- All cycles
- 2024: R+21.1 2020: R+10.2 2016: R+15.0 2012: R+20.9 2008: R+17.8
Not yet ingested
- Civics
- —
Market trends
- HPI YoY
- ▲ 3.63%
- Current HPI
- 501.6357
- Rent YoY
- —
- Metro
- —
- State GDP YoY
- ▲ 3.21%
- F500 in state
- 116
Industry mix (Fortune 500 HQ in CA)
| Industry | F500 HQs | Revenue |
|---|---|---|
| Technology | 27 | $1,492B |
|
||
| Financial Services | 3 | $174B |
|
||
| Retail | 3 | $44B |
|
||
| Insurance | 3 | $26B |
|
||
| Media / Entertainment | 2 | $115B |
|
||
| Pharmaceuticals / Biotech | 2 | $62B |
|
||
Price history
-22.5% since first listed5 events — show timeline
- 2026-04-20 Relisted — CRMLS
- 2025-12-23 Price Changed $154,900 CRMLS
- 2025-09-12 Price Changed $175,000 AVMLS
- 2025-09-12 Price Changed $175,000 CRMLS
- 2025-06-25 Listed $199,900 CRMLS
Property tax history
+3.5%/yrLatest (2025): $796 · +6.2% YoY. Source: county tax records.
Cash-flow waterfall
monthlySold comps — $/sqft
last 12 mo · ≤1 miLoading sold comps…