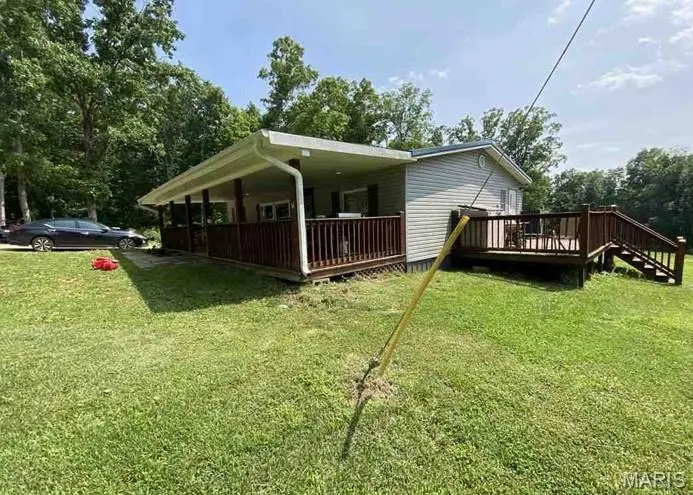
22027 New Jersey Dr · Glen Allen, MO
Flood risk 1/10 · Minimal
- FEMA flood zone
- —
- Chance of flooding over 30 yrs
- 0.0%
- Est. flood insurance / yr
- —
Fire risk 4/10 · Minor
- Est. fire insurance / yr
- $1,054 – $1,958
Heat risk 4/10 · Minor
- Hot days now (above 105°F)
- 7 days/yr
- Hot days in 30 yrs
- 21 days/yr
Wind risk 2/10 · Minimal
- Chance of severe wind over 30 yrs
- 2.0%
Air-quality risk 1/10 · Minimal
- Unhealthy air days now
- 0 days/yr
- Unhealthy air days in 30 yrs
- 0 days/yr
Risk factors via First Street. Map © Google.
Why this score? — see what drove the D grade
The composite is a weighted blend of 9 inputs, each scored 0–100. Each bar is that input's sub-score; the figure is the points it added to the 100-point composite (weight × sub-score).
- Cash flow +12.3/30.0
- ARV discount +7.5/15.0
- Appreciation +5.0/10.0
- DSCR +3.6/10.0
- Livability +2.9/5.0
- Schools +2.8/10.0
- Rent growth +2.5/5.0
- Condition / age +2.5/5.0
- 1% rule +2.2/10.0
$147,500
🖨 Deal sheet (PDF) 📄 Offer letter ✓ Due diligence
Key facts
- 7.37 acre lot
- Built 1994
Property features AI
Finance
- Other: Approximately 7.37-acre lot
- Financial info: Lease not considered
Exterior
- Utilities: Private well water; Private sewer; 220 volt electric service; Electricity connected
- Home design: Single-family residence; One level; Private ownership
- Construction: Vinyl siding; Metal roof
- Exterior features: Covered patio/porch; Deck; Porch; Sloped down lot; Gravel road frontage along a highway
Interior
- Kitchen: Dishwasher; Microwave; Electric range; Refrigerator
- Bedrooms: 3 bedrooms (all on the main level)
- Flooring: Tile; Vinyl
- Bathrooms: 2 full bathrooms (both on the main level)
- Heating & cooling: Electric forced-air heating; Central air conditioning
- Interior features: Dishwasher; Microwave; Electric range; Refrigerator; Tile flooring; Vinyl flooring; Electric forced-air heating; Central air conditioning
Neighborhood map
What this means for you Summary
Snapshot
- This is a 3-bed/2.0-bath manufactured listed at $148k.
Deal economics
- At list price, monthly cash flow is $-27 ($-326/yr) — negative.
- To cash-flow at today's rent, offer at most $143k (3.3% below list).
- To meet the 1% rule (rent ≥ 1% of price), the offer needs to be $107k (27.7% below list).
- Recommended offer: $107k (27.7% below list) — sets the bar for 1% rule.
Location & tenants
- Location reads 58/100 on livability (#613 in MO) — a working-class tenant base; expect higher turnover. Strengths: cost of living A+, housing A+, employment A-; Watch: crime F, amenities F, commute F.
- Woodland R-IV (rural): math 27% / reading 42% proficiency, ranked #239 of 324 in MO (top 74%) — families likely to look elsewhere, expect single-tenant / working-renter base with shorter leases.
- Zoned schools: Woodland Elem. (math 32% / reading 32%, grade F, #761 of 1,115 statewide, top 72%, 347 students, 63% FRL); Woodland Middle (math 30% / reading 47%, grade F, #202 of 391 statewide, top 54%, 261 students, 56% FRL); Woodland High (math 12% / reading 37%, grade F, #445 of 521 statewide, top 87%, 248 students, 51% FRL) — zoned schools at 57% FRL track the district average.
- Market conditions: 44 active listings in the ZIP.
Forward outlook
- In year one you build about $5k of equity ($1k loan paydown + $4k appreciation (3.0% local appreciation)).
- Bollinger County population projected at -14% by 2050 — secular population decline; favor cash flow + early exit over multi-decade hold.
- At projected returns (3.0% appreciation + 3.0% rent growth), your $41k cash investment doubles in ~7 years — after that, you're playing with house money.
- By year 7, paydown + projected appreciation supports a ~$34k cash-out refi (75% LTV) — recoverable capital for the next deal without selling this one.
Negotiation context
- Only 1 days on market — expect competitive offers; lowballing is unlikely to land.
Questions for the listing agent
- What do current leases actually rent for vs. the listed asking? Can we see a recent rent roll and the last 12 months of T-12 income?
- Is there a deadline driving the sale (1031 exchange, divorce, estate, relocation)? That informs how much negotiation room exists.
- Schools are F-rated, which usually means shorter tenancies and higher turnover. Who's the typical renter profile here, and what's been the actual vacancy rate?
- Crime grade is F in this area — have there been break-ins, vandalism, or insurance claims at this property in the last 3 years? What carrier currently insures it and at what premium?
- The area grade is low — what's the realistic commute time and amenity access for the typical tenant pool here? Any planned neighborhood developments (good or bad) we should know about?
- What's the average days-on-market for RENTAL listings here right now (not sales)? A rising rental-DOM trend means longer vacancies and softer asking-rent achievability than the comps imply.
- What's the recent tenant-quality profile in this submarket — average credit score on applications, eviction rate, late-payment / NSF rate, and stable-employment percentage? A property-management company in the area should have these aggregated.
- How much new for-sale + rental construction is in the pipeline within 1–3 miles? Heavy new supply typically softens prices + rents 12–24 months out; constrained supply supports both.
Investment metrics
- 1% rule
- 0.72% ✗
- Cap rate
- 6.07%
- Cash-on-cash
- -0.79%
- DSCR
- 0.96
- GRM
- 11.5
CMA / ARV
No comps found within radius.
Projected returns pro-forma
3.0% appreciation · 3.0% rent growth · sell at horizon
- IRR
- 6.7%
- Equity multiple
- 1.39×
- Total profit
- $15,960
- Equity at exit
- $66,322
- IRR
- 9.5%
- Equity multiple
- 2.43×
- Total profit
- $59,163
- Equity at exit
- $102,211
Cash invested: $41,300 (down + closing). Projections, not guarantees.
Landlord ↔ Tenant lean methodology
- Overall (STATE)
- 81 Strongly Landlord-Friendly
- State Missouri
- 81 Strongly Landlord-Friendly · R+10
- County
- — inherits STATE
- City
- — inherits STATE
ZIP-level market 63764
- Active inventory
- 44
- Price-to-rent
- 11.5×
Monthly cashflow live
- Estimated rent
- $1,066 medium interval (Pro) →
- Mortgage (P&I)
- −$774
- Tax from tax record
- −$34 /mo · $414/yr
- Insurance
- −$61
- HOA
- −$0
- Vacancy / Maint / Mgmt
- −$224
- Net cashflow
- $-27
Break-even live
Sensitivity live
| Price | -10% $56 | -5% $15 | +0% $-27 | +5% $-69 | +10% $-111 |
|---|---|---|---|---|---|
| Rent | -10% $-111 | -5% $-69 | +0% $-27 | +5% $15 | +10% $57 |
| Rate | -1.0pp $47 | -0.5pp $10 | base $-27 | +0.5pp $-65 | +1.0pp $-104 |
UW: 25.0% down · 7.5% · 30yr · 1.5% tax · 5.0% vac · 8.0% maint · 8.0% mgmt
Financing live
Cash to close
- Down payment
- $36,875
- Closing costs
- $4,425
- Reserves months
- —
- Total cash needed
- —
Loan-product check · same deal, 3 products live
Conventional
25% down · 7.5% · 30yr
- Down + closing
- —
- Monthly P&I
- —
- Monthly cashflow
- —
- DSCR
- —
- Eligible?
- —
Personal DTI + credit; lowest rate.
DSCR
20% down · 8.5% · 30yr
- Down + closing
- —
- Monthly P&I
- —
- Monthly cashflow
- —
- DSCR
- —
- Eligible?
- —
No personal income docs; deal must DSCR.
Hard money
10% down · 12.0% · 12mo
- Down + closing
- —
- Monthly P&I
- —
- Monthly cashflow
- —
- DSCR
- —
- Eligible?
- —
Short-term bridge; refi at stabilization.
Listing history 4 events
-
2026-05-19status Pending
-
2026-05-19$147,500 Active
-
2003-05-29soldstatus
-
2003-02-05soldstatus
ⓘ Source: listings_history table (triggers on properties + properties_extension) + one-shot
backfill from property_details.listing_events for pre-trigger history.
Tax reassessment forecast MO · Resets to sale price
- Current annual tax
- $414 · $34/mo
- Projected year-2 tax
- $1,431 · $119/mo
- Expected delta
- +$1,017/yr (+$85/mo · 245.7%)
ⓘ Screening estimate from a state-policy table — verify with the county assessor before closing.
Climate risk First Street
- Flood 1/10 Low 0% chance over 30 yrs
- Wildfire 4/10 Moderate
- Heat 4/10 Moderate 7 d/yr ≥105°F today · 21 d/yr by 30 yrs out
- Wind 2/10 Low 2% chance of damaging wind over 30 yrs
- Air quality 1/10 Low 0 unhealthy d/yr today · 0 by 30 yrs out
Nearby sold comps map
Loading sold comps map…
Walkable amenities ~0.75 mi
Loading nearby amenities…
Taxation est. · year 1
- Rental income
- $12,794
- − Mortgage interest
- −$8,262
- − Property taxes
- −$414
- − Insurance
- −$738
- − Repairs & maintenance
- −$1,023
- − Management
- −$1,023
- − Depreciation
- −$4,291
- Taxable loss
- −$2,958
- Est. tax savings @ 24.0%
- +$710
- After-tax cash flow
- $383/yr
For passive investors: Depreciation is non-cash, so a rental often shows a tax loss while cash-flowing — sheltering income. Rental losses are passive: they offset passive income freely, and up to $25,000/yr can offset ordinary (W-2) income if you actively participate and your MAGI is under $100k (phasing out to $0 by $150k); unused losses carry forward. On sale, claimed depreciation is recaptured at up to 25%, and gains may owe capital-gains tax (a 1031 exchange can defer both). Figures are a year-1 estimate at your 24.0% rate — not tax advice; consult a CPA.
Schools (NCES district)
- District
- Woodland R-IV
- NCES district ID
- 2919350
- Math proficiency
- 27% ▼ -10.00%
- Reading proficiency
- 42% ▼ -2.00%
- Median HH income
- $32,564
- Composite
- 28.21/100
- National rank
- #6804
- State rank
- #239 of 324 in MO
Livability — Glen Allen
- Score
- 58/100
- State rank
- #613
- US rank
- #21305
Category grades
Schools grade is shown separately in the Schools card above.
Census & demographics
- Population (ZIP)
- 4,568
Population outlook (Bollinger County) Hauer SSP2
- Today (2025)
- 11,825 people
- By 2030
- 11,546 · -2.4%
- By 2040
- 10,935 · -7.5%
- By 2050
- 10,222 · -13.6%
- By 2075
- 8,396 · -29.0%
- By 2100
- 6,530 · -44.8%
Race, ethnicity, and origin ACS 2023
- Neighborhood character
- Predominantly White (89%)
- Race & ethnicity
- White 89% Two or more races 6% Hispanic / Latino 3% Black 1%
- Common ancestry
- Iranian 5% Lithuanian 3% Serbian 2%
- Foreign-born
- 0%
Political lean MEDSL · Bollinger
- 2024 margin
- Solid R (+74.8) · D 12.3% · R 87.1%
- 2008→2024 swing
- -35.4pp toward R · 2008: -39.5pp · 2024: -74.8pp
- All cycles
- 2024: R+74.8 2020: R+73.8 2016: R+72.7 2012: R+52.8 2008: R+39.5
Not yet ingested
- Civics
- —
Market trends
- HPI YoY
- —
- Current HPI
- —
- Rent YoY
- —
- Metro
- —
- State GDP YoY
- ▲ 1.84%
- F500 in state
- 20
Industry mix (Fortune 500 HQ in MO)
| Industry | F500 HQs | Revenue |
|---|---|---|
| Healthcare | 1 | $163B |
|
||
| Insurance | 1 | $21B |
|
||
| Industrial Technology | 1 | $17B |
|
||
| Retail | 1 | $16B |
|
||
| Industrial Distribution | 1 | $10B |
|
||
| Utilities | 1 | $9B |
|
||
Price history
4 events — show timeline
- 2026-05-19 Pending — MARIS as Distributed by MLS Grid
- 2026-05-19 Listed $147,500 MARIS as Distributed by MLS Grid
- 2003-05-29 Sold (Public Records) — Public Records
- 2003-02-05 Sold (Public Records) — Public Records
Property tax history
+0.8%/yrLatest (2025): $414 · +11.1% YoY. Source: county tax records.
Cash-flow waterfall
monthlySold comps — $/sqft
last 12 mo · ≤1 miLoading sold comps…