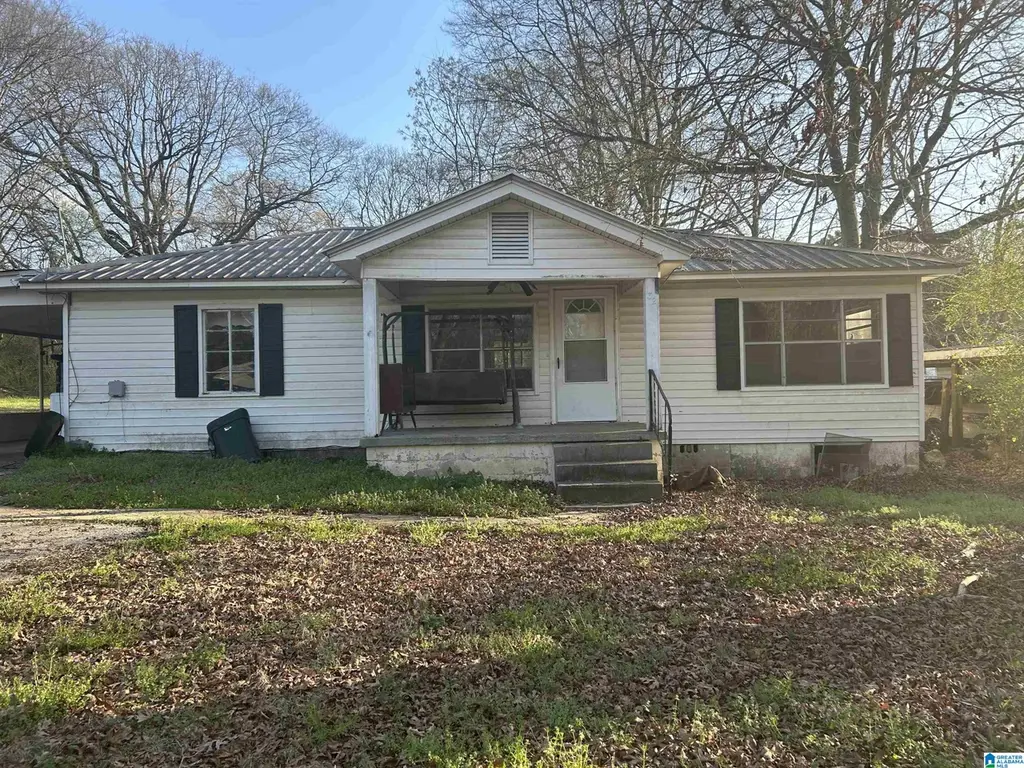
1321 Harrison Ave · Bessemer, AL
Flood risk 1/10 · Minimal
- FEMA flood zone
- X (unshaded)
- Chance of flooding over 30 yrs
- 0.0%
- Est. flood insurance / yr
- $507 – $1,088
Fire risk 4/10 · Minor
- Est. fire insurance / yr
- $916 – $1,700
Heat risk 6/10 · Moderate
- Hot days now (above 107°F)
- 7 days/yr
- Hot days in 30 yrs
- 18 days/yr
Wind risk 6/10 · Moderate
- Chance of severe wind over 30 yrs
- 43.0%
Air-quality risk 3/10 · Minor
- Unhealthy air days now
- 2 days/yr
- Unhealthy air days in 30 yrs
- 5 days/yr
Risk factors via First Street. Map © Google.
Why this score? — see what drove the B- grade
The composite is a weighted blend of 9 inputs, each scored 0–100. Each bar is that input's sub-score; the figure is the points it added to the 100-point composite (weight × sub-score).
- Cash flow +30.0/30.0
- 1% rule +10.0/10.0
- DSCR +10.0/10.0
- ARV discount +7.5/15.0
- Livability +3.0/5.0
- Condition / age +2.5/5.0
- Schools +1.8/10.0
- Rent growth +1.7/5.0
- Appreciation +0.0/10.0
$86,900
🖨 Deal sheet (PDF) 📄 Offer letter ✓ Due diligence
Listing remarks MLS
Four bedrooms one bath in McAdory school system. All offers will require Medicaid approval. Agent must be present while showing. Older home needs repairs and/or upgrading, metal roof around 15 plus years old. Septic tank was cleaned around 8 years ago, home has vinal siding. Flooring and sub flooring needs repaired or replaced in part of the home. Buyer to do all inspections to satisfy all concerns.
Key facts
- 0.46 acre lot
- Parking
- Built 1949
Neighborhood map
What this means for you Summary
Snapshot
- This is a 3-bed/1.0-bath single-family listed at $87k.
Deal economics
- At list price, monthly cash flow is $844 ($10k/yr) — positive.
- The deal already cash-flows at list — no discount required.
- Meets the 1% rule at list price ($2k rent vs $87k).
- Recommended offer: $79k (9.0% below list) — sets the bar for market timing.
- Cap rate 17.9% vs local median 5.9% in Bessemer — top-decile yield for the area; either an underpriced asset or a hidden risk that comps aren't pricing in. Stress-test before assuming the spread holds.
Location & tenants
- Location reads 59/100 on livability (#331 in AL) — a working-class tenant base; expect higher turnover. Strengths: commute A+, cost of living A+, housing A; Watch: crime F, amenities F, employment F.
- Jefferson County (suburban): math 9% / reading 32% proficiency, ranked #104 of 129 in AL (top 81%) — low school quality limits family demand, transient renter base, plan for 1-2y turnover.
- Zoned schools: Mccalla Elementary School (math 8% / reading 42%, grade F, #416 of 627 statewide, top 67%, 697 students, 69% FRL); Mcadory Middle School (math 2% / reading 33%, grade F, #199 of 257 statewide, top 77%, 854 students, 74% FRL); Mcadory High School (math 8% / reading 17%, grade F, #237 of 305 statewide, top 78%, 1,162 students, 72% FRL) — zoned schools average 72% FRL vs 49% district-wide (23 pts higher); higher-poverty schools than district average — tighter screening recommended.
- Market conditions: Rents falling (-3.1%/yr); 116 active listings in the ZIP; 4 comparable units currently listed for rent nearby; rentals leasing fast (median 5d on market — plan ~1-2 weeks tenant-placement turnaround); lower-income renter base — watch delinquency; 2,114 units permitted in Jefferson County in 2024 (556 in 5+ unit buildings).
- At $1,828/mo this rent would consume 62% of the median local household income ($35k/yr) (locally 1001% of renters already pay >50% of income on rent) — very limited rent-growth headroom before tenants either downsize or default.
Forward outlook
- Local home prices are declining (-3.0%/yr); year-one equity from $601 of loan paydown is wiped out by about $3k of value loss. Plan a longer hold.
- Jefferson County population projected to shrink 4% by 2050 — rents likely to lag national; underwrite the cash flow, not the appreciation.
- At projected returns (-3.0% appreciation + 0.0% rent growth), your $24k cash investment doubles in ~3 years — after that, you're playing with house money.
Negotiation context
- It's been on market 115 days — a 9% lower offer ($79k) is reasonable based on typical stale-listing flexibility.
Risks & watch-outs
- Watch-outs: built in 1949 — expect roof / HVAC / electrical / plumbing capex.
- Climate carrying-cost: major wind risk, 43% chance of damaging wind over 30y; extreme-heat days projected 7→18/yr by 2055 (HVAC capex compounding) — expect insurance premiums to compound above CPI over the hold.
Questions for the listing agent
- It's been on market 115 days. Have you received any prior offers? Is the seller open to a 9% concession, seller financing, or rate buy-down credit?
- Built in 1949 — when were the roof, HVAC, electrical panel, plumbing, and water heater last replaced?
- Why hasn't it sold? Are there any deal-killer items the seller is aware of (foundation, flood, title, zoning, code violations)?
- Is there a deadline driving the sale (1031 exchange, divorce, estate, relocation)? That informs how much negotiation room exists.
- Schools are D-rated, which usually means shorter tenancies and higher turnover. Who's the typical renter profile here, and what's been the actual vacancy rate?
- Crime grade is F in this area — have there been break-ins, vandalism, or insurance claims at this property in the last 3 years? What carrier currently insures it and at what premium?
- What's the average days-on-market for RENTAL listings here right now (not sales)? A rising rental-DOM trend means longer vacancies and softer asking-rent achievability than the comps imply.
- What's the recent tenant-quality profile in this submarket — average credit score on applications, eviction rate, late-payment / NSF rate, and stable-employment percentage? A property-management company in the area should have these aggregated.
- How much new for-sale + rental construction is in the pipeline within 1–3 miles? Heavy new supply typically softens prices + rents 12–24 months out; constrained supply supports both.
Investment metrics
- 1% rule
- 2.10% ✓
- Cap rate
- 17.95%
- Cash-on-cash
- 41.62%
- DSCR
- 2.85
- GRM
- 4.0
CMA / ARV
- ARV (median comp)
- $191,577
- List price
- $86,900
- Delta
- -54.64%
- Verdict
- UNDERPRICED
- Comps
- 20 within 1.0 mi
Show comp detail 12 sales within ~0.75 mi
| Address | Dist | Beds/Ba | Sqft | Sold | Price | $/sf | Match |
|---|---|---|---|---|---|---|---|
| 1307 Shades Ave | 0.14mi | 4/1.0 (+1) | 1,742 (+1%) | 10mo | $178,000 | $102 | 78 |
| 931 Ferro Ave Ferron Ave | 0.54mi | 3/2.0 | 1,750 (+2%) | 3mo | $224,900 | $129 | 66 |
| 5106 Candle Brook Ter | 0.29mi | 4/2.0 (+1) | 1,768 (+3%) | 9mo | $273,000 | $154 | 65 |
| 5397 Summerset Way | 0.28mi | 3/2.0 | 1,560 (-10%) | 4mo | $240,100 | $154 | 64 |
| 1509 Eastern Valley Rd | 0.46mi | 2/2.0 (-1) | 1,781 (+3%) | 10mo | $224,900 | $126 | 55 |
| 1422 Hudson Ave | 0.50mi | 4/3.0 (+1) | 1,792 (+4%) | 2mo | $140,000 | $78 | 55 |
| 1691 Bradford Ln | 0.56mi | 3/2.0 | 1,855 (+8%) | 3mo | $271,000 | $146 | 55 |
| 1671 Bradford Ln | 0.49mi | 3/2.0 | 1,591 (-8%) | 7mo | $256,345 | $161 | 54 |
| 4413 Wild Flower Cir | 0.63mi | 3/2.0 | 1,571 (-9%) | 7mo | $244,900 | $156 | 46 |
| 1675 Bradford Ln | 0.50mi | 3/2.0 | 1,534 (-11%) | 14mo | $248,900 | $162 | 43 |
| 1705 Bradford Ln | 0.66mi | 3/2.0 | 1,499 (-13%) | 2mo | $270,000 | $180 | 42 |
| 4341 Segars Cv | 0.55mi | 4/3.0 (+1) | 1,936 (+12%) | 12mo | $298,400 | $154 | 31 |
Match score weights: distance 35% · size 25% · config 20% · recency 20%. Top-matched comps best support the ARV.
Projected returns pro-forma
-3.0% appreciation · 0.0% rent growth · sell at horizon
- IRR
- 34.8%
- Equity multiple
- 2.41×
- Total profit
- $34,340
- Equity at exit
- $12,957
- IRR
- 40.0%
- Equity multiple
- 4.23×
- Total profit
- $78,520
- Equity at exit
- $7,514
Cash invested: $24,332 (down + closing). Projections, not guarantees.
Landlord ↔ Tenant lean methodology
- Overall (STATE)
- 90 Strongly Landlord-Friendly
- State Alabama
- 90 Strongly Landlord-Friendly · R+15
- County
- — inherits STATE
- City
- — inherits STATE
ZIP-level market 35020
- Home prices YoY
- -24.2%
- Rents YoY
- -3.1%
- Active inventory
- 116
- Price-to-rent
- 4.0×
Monthly cashflow live
- Estimated rent
- $1,828 medium interval (Pro) →
- Mortgage (P&I)
- −$456
- Tax est. 1.5%
- −$109 /mo · $1,304/yr
- Insurance
- −$36
- HOA
- −$0
- Vacancy / Maint / Mgmt
- −$384
- Net cashflow
- $844
Break-even live
Sensitivity live
| Price | -10% $904 | -5% $874 | +0% $844 | +5% $814 | +10% $784 |
|---|---|---|---|---|---|
| Rent | -10% $700 | -5% $772 | +0% $844 | +5% $916 | +10% $988 |
| Rate | -1.0pp $888 | -0.5pp $866 | base $844 | +0.5pp $821 | +1.0pp $799 |
UW: 25.0% down · 7.5% · 30yr · 1.5% tax · 5.0% vac · 8.0% maint · 8.0% mgmt
Financing live
Cash to close
- Down payment
- $21,725
- Closing costs
- $2,607
- Reserves months
- —
- Total cash needed
- —
Loan-product check · same deal, 3 products live
Conventional
25% down · 7.5% · 30yr
- Down + closing
- —
- Monthly P&I
- —
- Monthly cashflow
- —
- DSCR
- —
- Eligible?
- —
Personal DTI + credit; lowest rate.
DSCR
20% down · 8.5% · 30yr
- Down + closing
- —
- Monthly P&I
- —
- Monthly cashflow
- —
- DSCR
- —
- Eligible?
- —
No personal income docs; deal must DSCR.
Hard money
10% down · 12.0% · 12mo
- Down + closing
- —
- Monthly P&I
- —
- Monthly cashflow
- —
- DSCR
- —
- Eligible?
- —
Short-term bridge; refi at stabilization.
Rent comps 4 comps
| Address | Beds | Baths | Sqft | Rent | $/sqft | DOM | Units | Dist |
|---|---|---|---|---|---|---|---|---|
| 5124 Candle Brook Ter Bessemer, AL | 3.0 | 2.0 | 1925 | $1,990 | $1.03 | 5d | 1 | 0.33mi |
| 4737 Rosser Loop Dr Bessemer, AL | 3.0 | 2.0 | 1638 | $1,886 | $1.15 | 3d | 1 | 1.07mi |
| 3630 Wind Ridge Ln Bessemer, AL | 4.0 | 3.0 | 2167 | $2,346 | $1.08 | 4d | 1 | 1.33mi |
| 3626 Wind Ridge Ln Bessemer, AL | 3.0 | 2.0 | 1305 | $1,850 | $1.42 | 5d | 1 | 1.34mi |
Listing history 15 events
-
2026-06-22days on market $86,900 Active 115 DOM
-
2026-06-18days on market $86,900 Active 112 DOM
-
2026-06-17days on market $86,900 Active 111 DOM
-
2026-06-16days on market $86,900 Active 110 DOM
-
2026-06-15days on market $86,900 Active 109 DOM
-
2026-06-13days on market $86,900 Active 107 DOM
-
2026-06-10days on market $86,900 Active 104 DOM
-
2026-06-09days on market $86,900 Active 103 DOM
-
2026-06-08days on market $86,900 Active 102 DOM
-
2026-06-07days on market $86,900 Active 101 DOM
-
2026-06-03days on market $86,900 Active 97 DOM
-
2026-06-02days on market $86,900 Active 96 DOM
-
2026-06-01days on market $86,900 Active 95 DOM
-
2026-05-31days on market $86,900 Active 94 DOM
-
2026-02-25$86,900 Active 402-char remark
Show marketing remark (402 chars)
Four bedrooms one bath in McAdory school system. All offers will require Medicaid approval. Agent must be present while showing. Older home needs repairs and/or upgrading, metal roof around 15 plus years old. Septic tank was cleaned around 8 years ago, home has vinal siding. Flooring and sub flooring needs repaired or replaced in part of the home. Buyer to do all inspections to satisfy all concerns.
ⓘ Source: listings_history table (triggers on properties + properties_extension) + one-shot
backfill from property_details.listing_events for pre-trigger history.
Climate risk First Street
- Flood 1/10 Low FEMA zone X (unshaded) · 0% chance over 30 yrs
- Wildfire 4/10 Moderate
- Heat 6/10 Major 7 d/yr ≥107°F today · 18 d/yr by 30 yrs out
- Wind 6/10 Major 43% chance of damaging wind over 30 yrs
- Air quality 3/10 Moderate 2 unhealthy d/yr today · 5 by 30 yrs out
Nearby sold comps map
Loading sold comps map…
Walkable amenities ~0.75 mi
Loading nearby amenities…
Taxation est. · year 1
- Rental income
- $21,942
- − Mortgage interest
- −$4,868
- − Property taxes
- −$1,304
- − Insurance
- −$434
- − Repairs & maintenance
- −$1,755
- − Management
- −$1,755
- − Depreciation
- −$2,528
- Taxable income
- $9,297
- Est. tax owed @ 24.0%
- −$2,231
- After-tax cash flow
- $7,896/yr
For passive investors: Depreciation is non-cash, so a rental often shows a tax loss while cash-flowing — sheltering income. Rental losses are passive: they offset passive income freely, and up to $25,000/yr can offset ordinary (W-2) income if you actively participate and your MAGI is under $100k (phasing out to $0 by $150k); unused losses carry forward. On sale, claimed depreciation is recaptured at up to 25%, and gains may owe capital-gains tax (a 1031 exchange can defer both). Figures are a year-1 estimate at your 24.0% rate — not tax advice; consult a CPA.
Schools (NCES district)
- District
- Jefferson County
- NCES district ID
- 0101920
- Math proficiency
- 9% ▼ -24.00%
- Reading proficiency
- 32% ▼ -5.00%
- Median HH income
- $51,712
- Composite
- 18.4/100
- National rank
- #8937
- State rank
- #104 of 129 in AL
Livability — Bessemer
- Score
- 59/100
- State rank
- #331
- US rank
- #20078
Category grades
Schools grade is shown separately in the Schools card above.
Census & demographics
- County
- Jefferson County · 527,445 people
- City population
- 48,018
- Metro
- Birmingham-Hoover, AL
- Population (ZIP)
- 24,892
- Household income
- $35,362
- Rent vs Own
- Severe rent burden
- 1001.0
Population outlook (Jefferson County) Hauer SSP2
- Today (2025)
- 669,185 people
- By 2030
- 669,694 · +0.1%
- By 2040
- 661,388 · -1.2%
- By 2050
- 643,086 · -3.9%
- By 2075
- 577,267 · -13.7%
- By 2100
- 474,758 · -29.1%
Race, ethnicity, and origin ACS 2023
- Neighborhood character
- Predominantly Black (74%)
- Race & ethnicity
- Black 74% Hispanic / Latino 13% White 11% Two or more races 6%
- Hispanic origin (detail)
- Mexican 10%
- Foreign-born
- 5% · Canada
- Languages at home
- 89% English-only · Spanish 11%
Political lean MEDSL · Jefferson
- 2024 margin
- D (+10.4) · D 54.6% · R 44.2% · Other 1.2%
- 2008→2024 swing
- +5.4pp toward D · 2008: 5.1pp · 2024: 10.4pp
- All cycles
- 2024: D+10.4 2020: D+13.2 2016: D+7.2 2012: D+6.0 2008: D+5.1
Not yet ingested
- Civics
- —
Market trends
- HPI YoY
- ▼ -57.54%
- Current HPI
- 179.7702
- Rent YoY
- ▼ -3.12%
- Metro
- Birmingham-Hoover, AL
- State GDP YoY
- ▲ 2.94%
- F500 in state
- 4
Industry mix (Fortune 500 HQ in AL)
| Industry | F500 HQs | Revenue |
|---|---|---|
| Financial Services | 1 | $8B |
|
||
| Healthcare | 1 | $5B |
|
||
Price history
1 event — show timeline
- 2026-02-25 Listed $86,900 Greater Alabama MLS
Cash-flow waterfall
monthlySold comps — $/sqft
last 12 mo · ≤1 miLoading sold comps…