11410 N Lake Dr · Lake Fenton, MI
Flood risk No data
- FEMA flood zone
- —
- Chance of flooding over 30 yrs
- —
- Est. flood insurance / yr
- —
Fire risk No data
- Est. fire insurance / yr
- —
Heat risk No data
- Hot days now (above threshold)
- —
- Hot days in 30 yrs
- —
Wind risk No data
- Chance of severe wind over 30 yrs
- —
Air-quality risk No data
- Unhealthy air days now
- —
- Unhealthy air days in 30 yrs
- —
Risk factors via First Street. Map © Google.
Why this score? — see what drove the D+ grade
The composite is a weighted blend of 9 inputs, each scored 0–100. Each bar is that input's sub-score; the figure is the points it added to the 100-point composite (weight × sub-score).
- Cash flow +15.0/30.0
- ARV discount +7.5/15.0
- 1% rule +5.0/10.0
- DSCR +5.0/10.0
- Schools +4.1/10.0
- Livability +3.7/5.0
- Rent growth +3.1/5.0
- Condition / age +2.5/5.0
- Appreciation +0.0/10.0
$24,900
🖨 Deal sheet (PDF) 📄 Offer letter ✓ Due diligence
Listing remarks MLS
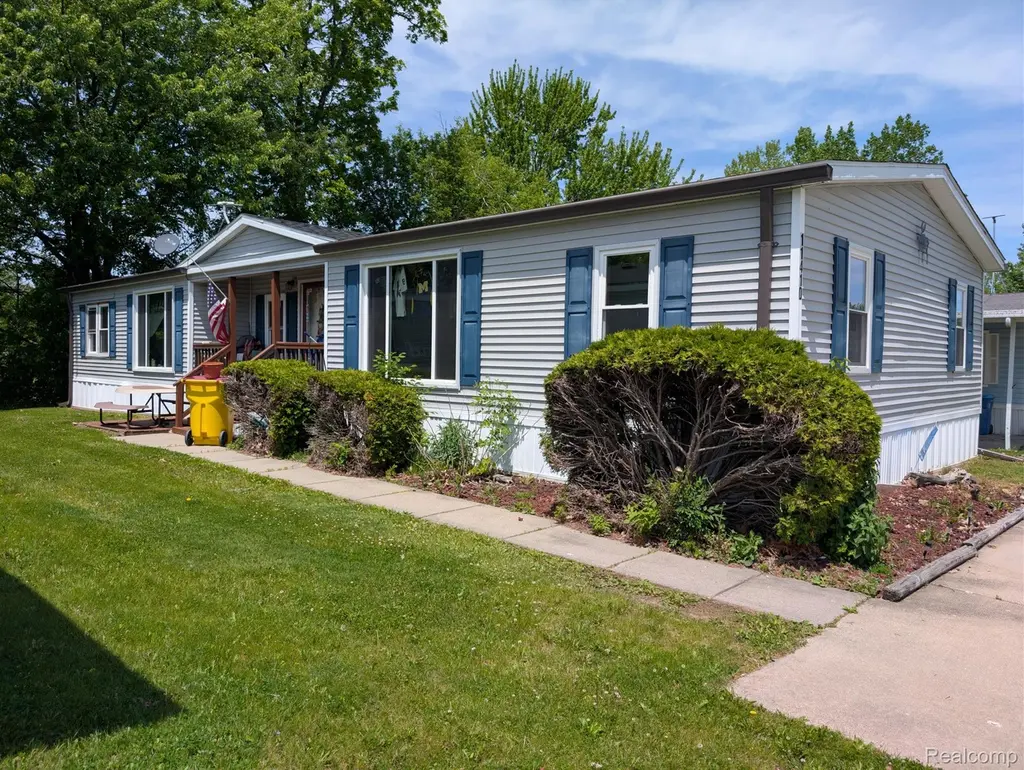
Investor Opportunity in Lake Fenton Estates! Don't miss this exceptional investment property in desirable Lake Fenton Estates! This spacious 3-bedroom, 2-bathroom manufactured home offers 1,848 sq. ft. of well-planned living space, perfect for resale or rental income. The open layout creates a bright and welcoming feel, with generous living areas and room for everyone to spread out. Featuring a functional floor plan with a comfortable master suite, ample closet space, and plenty of storage throughout, this home delivers both comfort and value. Located in a serene neighborhood just minutes from local amenities, schools, and recreational opportunities. Take advantage of this opportunity to secure a strong value at an attractive price. Property is being sold as-is, where-is.
Key facts
- Open layout
- Built 1900
- Listed 6 days
Tags
Property features AI
Finance
- Other: Located south of Thompson Road (cross street/directions)
- HOA & community: Homeowners association with a monthly fee of $850
Exterior
- Parking: No garage
- Utilities: Public water; Public sewer
- Home design: Single-family residence; One level; Ground-level entry with steps
- Construction: Vinyl siding; Asphalt roof; Slab foundation; Built as residential single-family home
- Exterior features: Front porch; Paved road access; 10 x 10 acre lot
Interior
- Kitchen: Dishwasher; Free-standing electric range; Free-standing refrigerator; Free-standing freezer; Gas water heater
- Bathrooms: 2 full bathrooms
- Heating & cooling: Forced air heating (natural gas); Ceiling fans; No central air
- Interior features: Gas fireplace in the living room; 8 total rooms
- Laundry & utility: Dedicated laundry room; Washer; Dryer
Neighborhood map
What this means for you Summary
Snapshot
- This is a 3-bed/2.0-bath single-family listed at $25k.
Deal economics
- At list price, monthly cash flow is $421 ($5k/yr) — positive.
- The deal already cash-flows at list — no discount required.
- Meets the 1% rule at list price ($2k rent vs $25k).
- Cap rate 26.6% vs local median 2.3% in Lake Fenton — top-decile yield for the area; either an underpriced asset or a hidden risk that comps aren't pricing in. Stress-test before assuming the spread holds.
Location & tenants
- Location reads 74/100 on livability (#183 in MI, #4,770 nationally) — a middle-class / working-renter tenant base. Strengths: crime A+, employment A+, housing A+; Watch: amenities F, commute F, health & safety F.
- Lake Fenton Community Schools (rural): math 40% / reading 52% proficiency, ranked #124 of 540 in MI (top 23%) — families likely to look elsewhere, expect single-tenant / working-renter base with shorter leases.
- Zoned schools: Lake Fenton Middle School (math 38% / reading 54%, grade D+, #155 of 493 statewide, top 32%, 452 students, 35% FRL); Lake Fenton High School (math 37% / reading 57%, grade D-, #187 of 713 statewide, top 29%, 695 students, 30% FRL).
- Market conditions: Rents rising (+2.6%/yr); 315 active listings in the ZIP; 1 comparable units currently listed for rent nearby; solid renter incomes; 419 units permitted in Genesee County in 2024 (68 in 5+ unit buildings).
Forward outlook
- Local home prices are declining (-3.0%/yr); year-one equity from $172 of loan paydown is wiped out by about $747 of value loss. Plan a longer hold.
- Genesee County population projected at -27% by 2050 — secular population decline; favor cash flow + early exit over multi-decade hold.
- At projected returns (-3.0% appreciation + 2.6% rent growth), your $7k cash investment doubles in ~2 years — after that, you're playing with house money.
Negotiation context
- Only 6 days on market — expect competitive offers; lowballing is unlikely to land.
- 2 sale attempts with the ask held roughly flat each time — persistent listings suggest the price (not the market) is what's stuck; bring a comps-based counter.
Risks & watch-outs
- Watch-outs: HOA is 47% of rent; built in 1900 — expect roof / HVAC / electrical / plumbing capex.
Questions for the listing agent
- Built in 1900 — when were the roof, HVAC, electrical panel, plumbing, and water heater last replaced?
- What does the HOA fee cover, when was the last increase, and are there any pending special assessments or reserve-fund shortfalls?
- Is there a deadline driving the sale (1031 exchange, divorce, estate, relocation)? That informs how much negotiation room exists.
- The area grade is low — what's the realistic commute time and amenity access for the typical tenant pool here? Any planned neighborhood developments (good or bad) we should know about?
- What's the average days-on-market for RENTAL listings here right now (not sales)? A rising rental-DOM trend means longer vacancies and softer asking-rent achievability than the comps imply.
- What's the recent tenant-quality profile in this submarket — average credit score on applications, eviction rate, late-payment / NSF rate, and stable-employment percentage? A property-management company in the area should have these aggregated.
- How much new for-sale + rental construction is in the pipeline within 1–3 miles? Heavy new supply typically softens prices + rents 12–24 months out; constrained supply supports both.
Investment metrics
- 1% rule
- 7.33% ✓
- Cap rate
- 26.57%
- Cash-on-cash
- 72.41%
- DSCR
- 4.22
- GRM
- 1.1
CMA / ARV
- ARV (on-the-fly)
- $295,680
- Comps found
- 9
Show comp detail 9 sales within ~0.75 mi
| Address | Dist | Beds/Ba | Sqft | Sold | Price | $/sf | Match |
|---|---|---|---|---|---|---|---|
| 11410 N Lake Dr | 0.00mi | 3/2.0 | 1,848 (0%) | 0mo | $7,500 | $4 | 100 |
| 2461 N Long Lake Rd | 0.27mi | 3/2.0 | 1,634 (-12%) | 1mo | $320,000 | $196 | 68 |
| 11106 Main Rd | 0.54mi | 4/1.0 (+1) | 1,808 (-2%) | 2mo | $250,000 | $138 | 60 |
| 11423 Main Rd | 0.27mi | 3/2.0 | 1,955 (+6%) | 21mo | $248,000 | $127 | 60 |
| 2479 N Long Lake Rd | 0.29mi | 4/2.0 (+1) | 1,632 (-12%) | 6mo | $260,000 | $159 | 56 |
| 2029 N Long Lake Rd | 0.67mi | 4/2.0 (+1) | 1,905 (+3%) | 9mo | $335,000 | $176 | 51 |
| 11272 Main Rd | 0.38mi | 4/2.5 (+1) | 1,648 (-11%) | 13mo | $315,000 | $191 | 47 |
| 12177 Dalhart Dr | 0.68mi | 2/1.5 (-1) | 1,816 (-2%) | 14mo | $290,000 | $160 | 46 |
| 2310 Sonora Dr | 0.48mi | 3/2.5 | 2,044 (+11%) | 18mo | $850,000 | $416 | 43 |
Match score weights: distance 35% · size 25% · config 20% · recency 20%. Top-matched comps best support the ARV.
Projected returns pro-forma
-3.0% appreciation · 2.59% rent growth · sell at horizon
- IRR
- 71.8%
- Equity multiple
- 4.24×
- Total profit
- $22,558
- Equity at exit
- $3,713
- IRR
- 75.6%
- Equity multiple
- 8.65×
- Total profit
- $53,325
- Equity at exit
- $2,153
Cash invested: $6,972 (down + closing). Projections, not guarantees.
Landlord ↔ Tenant lean methodology
- Overall (STATE)
- 62 Landlord-Friendly
- State Michigan
- 62 Landlord-Friendly · EVEN
- County
- — inherits STATE
- City
- — inherits STATE
ZIP-level market 48430
- Rents YoY
- 2.6%
- Active inventory
- 315
- Price-to-rent
- 1.1×
Monthly cashflow live
- Estimated rent
- $1,826 medium interval (Pro) →
- Mortgage (P&I)
- −$131
- Tax est. 1.5%
- −$31 /mo · $374/yr
- Insurance
- −$10
- HOA
- −$850
- Vacancy / Maint / Mgmt
- −$384
- Net cashflow
- $421
Break-even live
Sensitivity live
| Price | -10% $438 | -5% $429 | +0% $421 | +5% $412 | +10% $403 |
|---|---|---|---|---|---|
| Rent | -10% $276 | -5% $349 | +0% $421 | +5% $493 | +10% $565 |
| Rate | -1.0pp $433 | -0.5pp $427 | base $421 | +0.5pp $414 | +1.0pp $408 |
UW: 25.0% down · 7.5% · 30yr · 1.5% tax · 5.0% vac · 8.0% maint · 8.0% mgmt
Financing live
Cash to close
- Down payment
- $6,225
- Closing costs
- $747
- Reserves months
- —
- Total cash needed
- —
Loan-product check · same deal, 3 products live
Conventional
25% down · 7.5% · 30yr
- Down + closing
- —
- Monthly P&I
- —
- Monthly cashflow
- —
- DSCR
- —
- Eligible?
- —
Personal DTI + credit; lowest rate.
DSCR
20% down · 8.5% · 30yr
- Down + closing
- —
- Monthly P&I
- —
- Monthly cashflow
- —
- DSCR
- —
- Eligible?
- —
No personal income docs; deal must DSCR.
Hard money
10% down · 12.0% · 12mo
- Down + closing
- —
- Monthly P&I
- —
- Monthly cashflow
- —
- DSCR
- —
- Eligible?
- —
Short-term bridge; refi at stabilization.
Rent comps 1 comps
| Address | Beds | Baths | Sqft | Rent | $/sqft | DOM | Units | Dist |
|---|---|---|---|---|---|---|---|---|
| 11431 N Lake Dr Unit 94 Fenton, MI | 4.0 | 2.0 | 1456 | $1,699 | $1.17 | 45d | 1 | 0.01mi |
HOA detail
- Monthly dues
- $850 · $10,200/yr
Listing history 6 events
-
2026-06-02status $24,900 Pending 6 DOM
-
2026-06-01days on market $24,900 Active 6 DOM
-
2026-05-31days on market $24,900 Active 5 DOM
-
2026-05-30days on market $24,900 Active 4 DOM
-
2026-05-26$24,900 Active
Show marketing remark (782 chars)
Investor Opportunity in Lake Fenton Estates! Don't miss this exceptional investment property in desirable Lake Fenton Estates! This spacious 3-bedroom, 2-bathroom manufactured home offers 1,848 sq. ft. of well-planned living space, perfect for resale or rental income. The open layout creates a bright and welcoming feel, with generous living areas and room for everyone to spread out. Featuring a functional floor plan with a comfortable master suite, ample closet space, and plenty of storage throughout, this home delivers both comfort and value. Located in a serene neighborhood just minutes from local amenities, schools, and recreational opportunities. Take advantage of this opportunity to secure a strong value at an attractive price. Property is being sold as-is, where-is.
-
2026-05-26$24,900 Active 782-char remark
Show marketing remark (782 chars)
Investor Opportunity in Lake Fenton Estates! Don't miss this exceptional investment property in desirable Lake Fenton Estates! This spacious 3-bedroom, 2-bathroom manufactured home offers 1,848 sq. ft. of well-planned living space, perfect for resale or rental income. The open layout creates a bright and welcoming feel, with generous living areas and room for everyone to spread out. Featuring a functional floor plan with a comfortable master suite, ample closet space, and plenty of storage throughout, this home delivers both comfort and value. Located in a serene neighborhood just minutes from local amenities, schools, and recreational opportunities. Take advantage of this opportunity to secure a strong value at an attractive price. Property is being sold as-is, where-is.
ⓘ Source: listings_history table (triggers on properties + properties_extension) + one-shot
backfill from property_details.listing_events for pre-trigger history.
Nearby sold comps map
Loading sold comps map…
Walkable amenities ~0.75 mi
Loading nearby amenities…
Taxation est. · year 1
- Rental income
- $21,915
- − Mortgage interest
- −$1,395
- − Property taxes
- −$374
- − Insurance
- −$124
- − Repairs & maintenance
- −$1,753
- − Management
- −$1,753
- − HOA
- −$10,200
- − Depreciation
- −$724
- Taxable income
- $5,592
- Est. tax owed @ 24.0%
- −$1,342
- After-tax cash flow
- $3,706/yr
For passive investors: Depreciation is non-cash, so a rental often shows a tax loss while cash-flowing — sheltering income. Rental losses are passive: they offset passive income freely, and up to $25,000/yr can offset ordinary (W-2) income if you actively participate and your MAGI is under $100k (phasing out to $0 by $150k); unused losses carry forward. On sale, claimed depreciation is recaptured at up to 25%, and gains may owe capital-gains tax (a 1031 exchange can defer both). Figures are a year-1 estimate at your 24.0% rate — not tax advice; consult a CPA.
Schools (NCES district)
- District
- Lake Fenton Community Schools
- NCES district ID
- 2620670
- Math proficiency
- 40% ▼ -8.00%
- Reading proficiency
- 52% ▼ -8.00%
- Median HH income
- $65,788
- Composite
- 40.93/100
- National rank
- #3609
- State rank
- #124 of 540 in MI
Livability — Lake Fenton
- Score
- 74/100
- State rank
- #183
- US rank
- #4770
Category grades
Schools grade is shown separately in the Schools card above.
Census & demographics
- Census place
- Lake Fenton, MI
- County
- Livingston County · 121,626 people
- Metro
- Detroit-Warren-Dearborn, MI
- Population (ZIP)
- 39,309
- Household income
- $100,193
- Rent vs Own
- Severe rent burden
- 642.0
Population outlook (Genesee County) Hauer SSP2
- Today (2025)
- 381,312 people
- By 2030
- 362,731 · -4.9%
- By 2040
- 321,550 · -15.7%
- By 2050
- 279,212 · -26.8%
- By 2075
- 193,336 · -49.3%
- By 2100
- 128,118 · -66.4%
Race, ethnicity, and origin ACS 2023
- Neighborhood character
- Predominantly White (91%)
- Race & ethnicity
- White 91% Two or more races 4% Hispanic / Latino 3% Asian 1% Black 1%
- Common ancestry
- Romanian 10% Lithuanian 5% Slovak 3%
- Foreign-born
- 2% · Canada
- Languages at home
- 97% English-only · Spanish 1% Other Asian/Pacific 1% Other Indo-European 1%
Political lean MEDSL · Genesee
- 2024 margin
- Toss-up / Even · D 51.4% · R 47.2% · Other 1.4%
- 2008→2024 swing
- -28.3pp toward R · 2008: 32.5pp · 2024: 4.2pp
- All cycles
- 2024: D+4.2 2020: D+9.3 2016: D+9.5 2012: D+28.2 2008: D+32.5
Not yet ingested
- Civics
- —
Market trends
- HPI YoY
- ▼ -298.66%
- Current HPI
- 238.8371
- Rent YoY
- ▲ 2.59%
- Metro
- Detroit-Warren-Dearborn, MI
- State GDP YoY
- ▲ 1.37%
- F500 in state
- 28
Industry mix (Fortune 500 HQ in MI)
| Industry | F500 HQs | Revenue |
|---|---|---|
| Automotive Parts | 3 | $48B |
|
||
| Automotive | 2 | $372B |
|
||
| Chemicals | 1 | $45B |
|
||
| Automotive Retail | 1 | $29B |
|
||
| Healthcare / Medical Devices | 1 | $23B |
|
||
| Automotive Technology | 1 | $20B |
|
||
Price history
+0.0% since first listed2 events — show timeline
- 2026-05-26 Listed $24,900 REALCOMP
- 2026-05-26 Listed $24,900 MiRealSource-MiMLS
Cash-flow waterfall
monthlySold comps — $/sqft
last 12 mo · ≤1 miLoading sold comps…