1204 Logan Ave · Rossville, GA
Flood risk 1/10 · Minimal
- FEMA flood zone
- X (unshaded)
- Chance of flooding over 30 yrs
- 0.0%
- Est. flood insurance / yr
- $507 – $1,088
Fire risk 4/10 · Minor
- Est. fire insurance / yr
- $963 – $1,789
Heat risk 6/10 · Moderate
- Hot days now (above 104°F)
- 8 days/yr
- Hot days in 30 yrs
- 21 days/yr
Wind risk 4/10 · Minor
- Chance of severe wind over 30 yrs
- 13.0%
Air-quality risk 3/10 · Minor
- Unhealthy air days now
- 2 days/yr
- Unhealthy air days in 30 yrs
- 2 days/yr
Risk factors via First Street. Map © Google.
Why this score? — see what drove the F grade
The composite is a weighted blend of 9 inputs, each scored 0–100. Each bar is that input's sub-score; the figure is the points it added to the 100-point composite (weight × sub-score).
- Cash flow +11.0/30.0
- Rent growth +4.4/5.0
- ARV discount +4.1/15.0
- DSCR +3.2/10.0
- Livability +2.8/5.0
- Condition / age +2.5/5.0
- 1% rule +2.3/10.0
- Schools +2.3/10.0
- Appreciation +0.0/10.0
$148,000
🖨 Deal sheet (PDF) 📄 Offer letter ✓ Due diligence
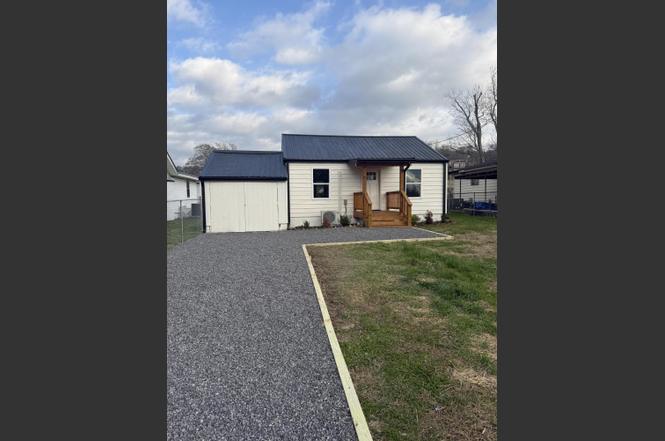
Listing remarks
The Perfect Starter Home or Smart Investment! Welcome to this adorable 2-bedroom, 1-bathroom bungalow that's been refreshed and ready for you! All you have to do is bring your furniture and start living. Step inside to brand-new luxury vinyl plank flooring throughout, fresh neutral paint, and abundant natural light. The open living area flows seamlessly into a stunning brand-new kitchen featuring crisp white shaker cabinets, gleaming countertops, and a full stainless steel appliance package (refrigerator included!). Bathroom boasts a new vanity, modern tile shower/tub combo, and on-trend fixtures. You'll love the convenience of a dedicated laundry room with washer & dryer hookups. St
Key facts
- New vanity
- Brand new kitchen
- Garage
Tags
Neighborhood map
What this means for you Summary
Snapshot
- This is a 1-bed/1.0-bath single-family listed at $148k.
Deal economics
- At list price, monthly cash flow is $-63 ($-760/yr) — negative.
- To cash-flow at today's rent, offer at most $137k (7.6% below list).
- To meet the 1% rule (rent ≥ 1% of price), the offer needs to be $108k (26.8% below list).
- Recommended offer: $108k (26.8% below list) — sets the bar for 1% rule.
Location & tenants
- Location reads 56/100 on livability (#484 in GA) — a working-class tenant base; expect higher turnover. Strengths: cost of living A+, housing A-, crime B+; Watch: amenities F, commute F, employment D-.
- Walker County (rural): math 25% / reading 29% proficiency, ranked #114 of 174 in GA (top 66%) — low school quality limits family demand, transient renter base, plan for 1-2y turnover; 61% free/reduced lunch — lower-income household profile, screen leases tightly.
- Zoned schools: Rossville Elementary School (math 22% / reading 17%, grade F, #878 of 1,228 statewide, top 75%, 416 students, 91% FRL); Rossville Middle School (math 13% / reading 25%, grade F, #368 of 470 statewide, top 79%, 444 students, 81% FRL); Ridgeland High School (math 23% / reading 19%, grade F, #225 of 424 statewide, top 54%, 1,244 students, 70% FRL) — zoned schools average 81% FRL vs 61% district-wide (19 pts higher); higher-poverty schools than district average — tighter screening recommended.
- Market conditions: Rents rising fast (+7.4%/yr); 430 active listings in the ZIP; 347 units permitted in Walker County in 2024 (24 in 5+ unit buildings).
Forward outlook
- Local home prices are declining (-3.0%/yr); year-one equity from $1k of loan paydown is wiped out by about $4k of value loss. Plan a longer hold.
- Walker County population projected at -16% by 2050 — secular population decline; favor cash flow + early exit over multi-decade hold.
Negotiation context
- It's been on market 146 days — a 12% lower offer ($130k) is reasonable based on typical stale-listing flexibility.
- Current owner paid $45k; list at $148k implies a 229% gain — meaningful room to come down on a strong offer.
Risks & watch-outs
- Watch-outs: built in 1950 — expect roof / HVAC / electrical / plumbing capex.
- Climate carrying-cost: extreme-heat days projected 8→21/yr by 2055 (HVAC capex compounding) — expect insurance premiums to compound above CPI over the hold.
Questions for the listing agent
- What do current leases actually rent for vs. the listed asking? Can we see a recent rent roll and the last 12 months of T-12 income?
- It's been on market 146 days. Have you received any prior offers? Is the seller open to a 27% concession, seller financing, or rate buy-down credit?
- Built in 1950 — when were the roof, HVAC, electrical panel, plumbing, and water heater last replaced?
- Why hasn't it sold? Are there any deal-killer items the seller is aware of (foundation, flood, title, zoning, code violations)?
- Is there a deadline driving the sale (1031 exchange, divorce, estate, relocation)? That informs how much negotiation room exists.
- Schools are F-rated, which usually means shorter tenancies and higher turnover. Who's the typical renter profile here, and what's been the actual vacancy rate?
- The area grade is low — what's the realistic commute time and amenity access for the typical tenant pool here? Any planned neighborhood developments (good or bad) we should know about?
- What's the average days-on-market for RENTAL listings here right now (not sales)? A rising rental-DOM trend means longer vacancies and softer asking-rent achievability than the comps imply.
- What's the recent tenant-quality profile in this submarket — average credit score on applications, eviction rate, late-payment / NSF rate, and stable-employment percentage? A property-management company in the area should have these aggregated.
- How much new for-sale + rental construction is in the pipeline within 1–3 miles? Heavy new supply typically softens prices + rents 12–24 months out; constrained supply supports both.
Investment metrics
- 1% rule
- 0.73% ✗
- Cap rate
- 5.78%
- Cash-on-cash
- -1.84%
- DSCR
- 0.92
- GRM
- 11.4
CMA / ARV
- ARV (on-the-fly)
- $137,700
- Comps found
- 5
Show comp detail 5 sales within ~0.75 mi
| Address | Dist | Beds/Ba | Sqft | Sold | Price | $/sf | Match |
|---|---|---|---|---|---|---|---|
| 1204 Logan Ave | 0.00mi | 2/1.0 (+1) | 675 (0%) | 1mo | $148,400 | $220 | 94 |
| 111 Elm St | 0.12mi | 2/1.0 (+1) | 694 (+3%) | 16mo | $125,000 | $180 | 72 |
| 807 Richmond Ave | 0.40mi | 2/1.0 (+1) | 720 (+7%) | 9mo | $147,000 | $204 | 58 |
| 824 Henderson Ave | 0.22mi | 2/1.0 (+1) | 750 (+11%) | 20mo | $155,000 | $207 | 49 |
| 215 Spruce St | 0.22mi | 2/1.0 (+1) | 776 (+15%) | 17mo | $77,000 | $99 | 45 |
Match score weights: distance 35% · size 25% · config 20% · recency 20%. Top-matched comps best support the ARV.
Projected returns pro-forma
-3.0% appreciation · 7.44% rent growth · sell at horizon
- IRR
- -15.0%
- Equity multiple
- 0.44×
- Total profit
- $-23,013
- Equity at exit
- $22,067
- IRR
- -0.8%
- Equity multiple
- 0.93×
- Total profit
- $-2,703
- Equity at exit
- $12,796
Cash invested: $41,440 (down + closing). Projections, not guarantees.
Landlord ↔ Tenant lean methodology
- Overall (STATE)
- 90 Strongly Landlord-Friendly
- State Georgia
- 90 Strongly Landlord-Friendly · R+3
- County
- — inherits STATE
- City
- — inherits STATE
ZIP-level market 30741
- Home prices YoY
- -30.7%
- Rents YoY
- 7.4%
- Active inventory
- 430
- Price-to-rent
- 11.4×
Monthly cashflow live
- Estimated rent
- $1,083 medium interval (Pro) →
- Mortgage (P&I)
- −$776
- Tax from tax record
- −$81 /mo · $970/yr
- Insurance
- −$62
- HOA
- −$0
- Vacancy / Maint / Mgmt
- −$227
- Net cashflow
- $-63
Break-even live
Sensitivity live
| Price | -10% $20 | -5% $-21 | +0% $-63 | +5% $-105 | +10% $-147 |
|---|---|---|---|---|---|
| Rent | -10% $-149 | -5% $-106 | +0% $-63 | +5% $-21 | +10% $22 |
| Rate | -1.0pp $11 | -0.5pp $-26 | base $-63 | +0.5pp $-102 | +1.0pp $-141 |
UW: 25.0% down · 7.5% · 30yr · 1.5% tax · 5.0% vac · 8.0% maint · 8.0% mgmt
Financing live
Cash to close
- Down payment
- $37,000
- Closing costs
- $4,440
- Reserves months
- —
- Total cash needed
- —
Loan-product check · same deal, 3 products live
Conventional
25% down · 7.5% · 30yr
- Down + closing
- —
- Monthly P&I
- —
- Monthly cashflow
- —
- DSCR
- —
- Eligible?
- —
Personal DTI + credit; lowest rate.
DSCR
20% down · 8.5% · 30yr
- Down + closing
- —
- Monthly P&I
- —
- Monthly cashflow
- —
- DSCR
- —
- Eligible?
- —
No personal income docs; deal must DSCR.
Hard money
10% down · 12.0% · 12mo
- Down + closing
- —
- Monthly P&I
- —
- Monthly cashflow
- —
- DSCR
- —
- Eligible?
- —
Short-term bridge; refi at stabilization.
Listing history 9 events
-
2026-04-24status Pending
-
2026-04-04price $148,000
-
2026-01-09price $155,000
-
2025-12-29price $159,000
-
2025-12-15price $164,000
-
2025-12-10price $168,000
-
2025-12-06price $180,000
-
2025-11-30$189,000 Active
-
2025-07-18soldstatus $45,000
ⓘ Source: listings_history table (triggers on properties + properties_extension) + one-shot
backfill from property_details.listing_events for pre-trigger history.
Tax reassessment forecast GA · Resets to sale price
- Current annual tax
- $970 · $81/mo
- Projected year-2 tax
- $1,362 · $113/mo
- Expected delta
- +$391/yr (+$33/mo · 40.3%)
ⓘ Screening estimate from a state-policy table — verify with the county assessor before closing.
Climate risk First Street
- Flood 1/10 Low FEMA zone X (unshaded) · 0% chance over 30 yrs
- Wildfire 4/10 Moderate
- Heat 6/10 Major 8 d/yr ≥104°F today · 21 d/yr by 30 yrs out
- Wind 4/10 Moderate 13% chance of damaging wind over 30 yrs
- Air quality 3/10 Moderate 2 unhealthy d/yr today · 2 by 30 yrs out
Nearby sold comps map
Loading sold comps map…
Walkable amenities ~0.75 mi
Loading nearby amenities…
Taxation est. · year 1
- Rental income
- $12,992
- − Mortgage interest
- −$8,290
- − Property taxes
- −$970
- − Insurance
- −$740
- − Repairs & maintenance
- −$1,039
- − Management
- −$1,039
- − Depreciation
- −$4,305
- Taxable loss
- −$3,393
- Est. tax savings @ 24.0%
- +$814
- After-tax cash flow
- $54/yr
For passive investors: Depreciation is non-cash, so a rental often shows a tax loss while cash-flowing — sheltering income. Rental losses are passive: they offset passive income freely, and up to $25,000/yr can offset ordinary (W-2) income if you actively participate and your MAGI is under $100k (phasing out to $0 by $150k); unused losses carry forward. On sale, claimed depreciation is recaptured at up to 25%, and gains may owe capital-gains tax (a 1031 exchange can defer both). Figures are a year-1 estimate at your 24.0% rate — not tax advice; consult a CPA.
Schools (NCES district)
- District
- Walker County
- NCES district ID
- 1305370
- Math proficiency
- 25% ▼ -10.00%
- Reading proficiency
- 29% ▼ -10.00%
- Median HH income
- $39,889
- Composite
- 22.74/100
- National rank
- #8035
- State rank
- #114 of 174 in GA
Livability — Rossville
- Score
- 56/100
- State rank
- #484
- US rank
- #22540
Category grades
Schools grade is shown separately in the Schools card above.
Census & demographics
- Census place
- Rossville, GA
- County
- Walker County · 48,831 people
- City population
- 30,041
- Metro
- Chattanooga, TN-GA
- Population (ZIP)
- 30,041
- Household income
- $58,834
- Rent vs Own
- Severe rent burden
- 834.0
Population outlook (Walker County) Hauer SSP2
- Today (2025)
- 66,050 people
- By 2030
- 64,305 · -2.6%
- By 2040
- 60,127 · -9.0%
- By 2050
- 55,551 · -15.9%
- By 2075
- 44,886 · -32.0%
- By 2100
- 34,015 · -48.5%
Race, ethnicity, and origin ACS 2023
- Neighborhood character
- Predominantly White (86%)
- Race & ethnicity
- White 86% Black 5% Two or more races 5% Hispanic / Latino 5%
- Common ancestry
- Slovak 3% Iranian 2% Italian 1%
- Foreign-born
- 2% · Canada
- Languages at home
- 96% English-only · Spanish 3%
Political lean MEDSL · Walker
- 2024 margin
- Solid R (+59.3) · D 20.1% · R 79.4%
- 2008→2024 swing
- -12.5pp toward R · 2008: -46.8pp · 2024: -59.3pp
- All cycles
- 2024: R+59.3 2020: R+59.3 2016: R+61.5 2012: R+50.2 2008: R+46.8
Not yet ingested
- Civics
- —
Market trends
- HPI YoY
- ▼ -118.05%
- Current HPI
- 267.0047
- Rent YoY
- ▲ 7.44%
- Metro
- Chattanooga, TN-GA
- State GDP YoY
- ▲ 2.66%
- F500 in state
- 28
Industry mix (Fortune 500 HQ in GA)
| Industry | F500 HQs | Revenue |
|---|---|---|
| Paper / Packaging | 2 | $29B |
|
||
| Retail | 1 | $160B |
|
||
| Transportation / Logistics | 1 | $91B |
|
||
| Airlines | 1 | $62B |
|
||
| Consumer Goods | 1 | $47B |
|
||
| Utilities | 1 | $25B |
|
||
Price history
+228.9% since first listed9 events — show timeline
- 2026-04-24 Pending — GCAR
- 2026-04-04 Price Changed $148,000 GCAR
- 2026-01-09 Price Changed $155,000 GCAR
- 2025-12-29 Price Changed $159,000 GCAR
- 2025-12-15 Price Changed $164,000 GCAR
- 2025-12-10 Price Changed $168,000 GCAR
- 2025-12-06 Price Changed $180,000 GCAR
- 2025-11-30 Listed $189,000 GCAR
- 2025-07-18 Sold (Public Records) $45,000 Public Records
Property tax history
+6.9%/yrLatest (2025): $970 · +3.8% YoY. Source: county tax records.
Cash-flow waterfall
monthlySold comps — $/sqft
last 12 mo · ≤1 miLoading sold comps…