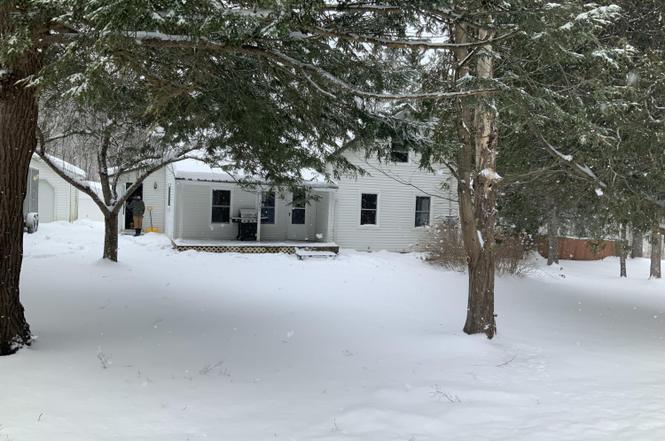
1407 Clark Hollow Rd · Tully, NY
Flood risk 1/10 · Minimal
- FEMA flood zone
- X (unshaded)
- Chance of flooding over 30 yrs
- 0.0%
- Est. flood insurance / yr
- $473 – $860
Fire risk 3/10 · Minor
- Est. fire insurance / yr
- $691 – $1,283
Heat risk 2/10 · Minimal
- Hot days now (above 90°F)
- 7 days/yr
- Hot days in 30 yrs
- 16 days/yr
Wind risk 1/10 · Minimal
- Chance of severe wind over 30 yrs
- 1.0%
Air-quality risk 2/10 · Minimal
- Unhealthy air days now
- 0 days/yr
- Unhealthy air days in 30 yrs
- 1 days/yr
Risk factors via First Street. Map © Google.
Why this score? — see what drove the D+ grade
The composite is a weighted blend of 9 inputs, each scored 0–100. Each bar is that input's sub-score; the figure is the points it added to the 100-point composite (weight × sub-score).
- Cash flow +13.1/30.0
- Appreciation +8.3/10.0
- ARV discount +7.5/15.0
- Schools +4.6/10.0
- DSCR +3.9/10.0
- Livability +3.2/5.0
- 1% rule +2.7/10.0
- Rent growth +2.5/5.0
- Condition / age +2.5/5.0
$195,000
🖨 Deal sheet (PDF) 📄 Offer letter ✓ Due diligence
Listing remarks MLS
Country classic! This 3 bedroom, 1 full bath home is situated on 1.94 private acres in the hills between Lafayette and Fabius. The main home offers over 1300 sf of living space with a bedroom and the full bath on the 1st floor! Also on the property is a 1 bedroom cottage with kitchen, full bath and living room situated on the rear of the property near a creek. Tranquility and peacefulness abound! Don't wait.
Key facts
- New propane furnace
- Private 2.2 acres
- Small pole barn
Tags
Neighborhood map
What this means for you Summary
Snapshot
- This is a 3-bed/1.0-bath other listed at $195k.
Deal economics
- At list price, monthly cash flow is $-6 ($-76/yr) — negative.
- To cash-flow at today's rent, offer at most $194k (0.6% below list).
- To meet the 1% rule (rent ≥ 1% of price), the offer needs to be $150k (22.9% below list).
- Recommended offer: $150k (22.9% below list) — sets the bar for 1% rule.
- Cap rate 6.3% vs local median 1.7% in Tully — top-decile yield for the area; either an underpriced asset or a hidden risk that comps aren't pricing in. Stress-test before assuming the spread holds.
Location & tenants
- Location reads 63/100 on livability (#800 in NY) — a middle-class / working-renter tenant base. Strengths: housing A+, cost of living A-; Watch: employment D, crime F, amenities F.
- Fabius-Pompey Central School District (rural): math 48% / reading 55% proficiency, ranked #322 of 590 in NY (top 55%) — acceptable for families but not a draw, mixed tenant base, ~2y average lease.
- Zoned schools: Fabius-Pompey Elementary School (math 42% / reading 47%, grade F, #1,277 of 2,108 statewide, top 64%, 286 students, 30% FRL); Fabius-Pompey Middle School High School (math 52% / reading 62%, grade C, #887 of 1,100 statewide, top 82%, 344 students, 36% FRL).
- Market conditions: 19 active listings in the ZIP; 616 units permitted in Onondaga County in 2024 (256 in 5+ unit buildings).
Forward outlook
- In year one you build about $14k of equity ($1k loan paydown + $13k appreciation (6.7% local appreciation)).
- Onondaga County population projected to shrink 9% by 2050 — rents likely to lag national; underwrite the cash flow, not the appreciation.
- At projected returns (6.7% appreciation + 3.0% rent growth), your $55k cash investment doubles in ~4 years — after that, you're playing with house money.
- By year 3, paydown + projected appreciation supports a ~$36k cash-out refi (75% LTV) — recoverable capital for the next deal without selling this one.
Negotiation context
- Only 14 days on market — expect competitive offers; lowballing is unlikely to land.
- 3 sale attempts since 9y ago with the ask held roughly flat each time — persistent listings suggest the price (not the market) is what's stuck; bring a comps-based counter.
- Current owner paid $135k; 45% above their basis — modest negotiation headroom, anchor on the comps not their cost.
Risks & watch-outs
- Watch-outs: built in 1890 — expect roof / HVAC / electrical / plumbing capex.
Questions for the listing agent
- What do current leases actually rent for vs. the listed asking? Can we see a recent rent roll and the last 12 months of T-12 income?
- Built in 1890 — when were the roof, HVAC, electrical panel, plumbing, and water heater last replaced?
- Is there a deadline driving the sale (1031 exchange, divorce, estate, relocation)? That informs how much negotiation room exists.
- Schools are B-rated — typically a magnet for longer-tenancy family renters. What's the average tenant stay here, and is there a school-zone premium baked into asking?
- Crime grade is F in this area — have there been break-ins, vandalism, or insurance claims at this property in the last 3 years? What carrier currently insures it and at what premium?
- The area grade is low — what's the realistic commute time and amenity access for the typical tenant pool here? Any planned neighborhood developments (good or bad) we should know about?
- What's the average days-on-market for RENTAL listings here right now (not sales)? A rising rental-DOM trend means longer vacancies and softer asking-rent achievability than the comps imply.
- What's the recent tenant-quality profile in this submarket — average credit score on applications, eviction rate, late-payment / NSF rate, and stable-employment percentage? A property-management company in the area should have these aggregated.
- How much new for-sale + rental construction is in the pipeline within 1–3 miles? Heavy new supply typically softens prices + rents 12–24 months out; constrained supply supports both.
Investment metrics
- 1% rule
- 0.77% ✗
- Cap rate
- 6.25%
- Cash-on-cash
- -0.14%
- DSCR
- 0.99
- GRM
- 10.8
CMA / ARV
No comps found within radius.
Projected returns pro-forma
6.66% appreciation · 3.0% rent growth · sell at horizon
- IRR
- 16.8%
- Equity multiple
- 2.16×
- Total profit
- $63,556
- Equity at exit
- $130,809
- IRR
- 16.4%
- Equity multiple
- 4.40×
- Total profit
- $185,390
- Equity at exit
- $244,662
Cash invested: $54,600 (down + closing). Projections, not guarantees.
Landlord ↔ Tenant lean methodology
- Overall (STATE)
- 15 Strongly Tenant-Friendly
- State New York
- 15 Strongly Tenant-Friendly · D+10
- County
- — inherits STATE
- City
- — inherits STATE
ZIP-level market 13084
- Home prices YoY
- 2.2%
- Active inventory
- 19
- Price-to-rent
- 10.8×
Monthly cashflow live
- Estimated rent
- $1,503 medium interval (Pro) →
- Mortgage (P&I)
- −$1,023
- Tax from tax record
- −$90 /mo · $1,074/yr
- Insurance
- −$81
- HOA
- −$0
- Vacancy / Maint / Mgmt
- −$316
- Net cashflow
- $-6
Break-even live
Sensitivity live
| Price | -10% $104 | -5% $49 | +0% $-6 | +5% $-62 | +10% $-117 |
|---|---|---|---|---|---|
| Rent | -10% $-125 | -5% $-66 | +0% $-6 | +5% $53 | +10% $112 |
| Rate | -1.0pp $92 | -0.5pp $43 | base $-6 | +0.5pp $-57 | +1.0pp $-108 |
UW: 25.0% down · 7.5% · 30yr · 1.5% tax · 5.0% vac · 8.0% maint · 8.0% mgmt
Financing live
Cash to close
- Down payment
- $48,750
- Closing costs
- $5,850
- Reserves months
- —
- Total cash needed
- —
Loan-product check · same deal, 3 products live
Conventional
25% down · 7.5% · 30yr
- Down + closing
- —
- Monthly P&I
- —
- Monthly cashflow
- —
- DSCR
- —
- Eligible?
- —
Personal DTI + credit; lowest rate.
DSCR
20% down · 8.5% · 30yr
- Down + closing
- —
- Monthly P&I
- —
- Monthly cashflow
- —
- DSCR
- —
- Eligible?
- —
No personal income docs; deal must DSCR.
Hard money
10% down · 12.0% · 12mo
- Down + closing
- —
- Monthly P&I
- —
- Monthly cashflow
- —
- DSCR
- —
- Eligible?
- —
Short-term bridge; refi at stabilization.
Listing history 8 events
-
2025-12-28status Pending
-
2025-12-13$195,000 Active
-
2018-10-19soldstatus $134,900 Closed Sale or Rented 414-char remark
Show marketing remark (414 chars)
Country classic! This 3 bedroom, 1 full bath home is situated on 1.94 private acres in the hills between Lafayette and Fabius. The main home offers over 1300 sf of living space with a bedroom and the full bath on the 1st floor! Also on the property is a 1 bedroom cottage with kitchen, full bath and living room situated on the rear of the property near a creek. Tranquility and peacefulness abound! Don't wait.
-
2018-07-26status Under Contract- Do Not Show 414-char remark
Show marketing remark (414 chars)
Country classic! This 3 bedroom, 1 full bath home is situated on 1.94 private acres in the hills between Lafayette and Fabius. The main home offers over 1300 sf of living space with a bedroom and the full bath on the 1st floor! Also on the property is a 1 bedroom cottage with kitchen, full bath and living room situated on the rear of the property near a creek. Tranquility and peacefulness abound! Don't wait.
-
2018-07-23$134,900 Active 414-char remark
Show marketing remark (414 chars)
Country classic! This 3 bedroom, 1 full bath home is situated on 1.94 private acres in the hills between Lafayette and Fabius. The main home offers over 1300 sf of living space with a bedroom and the full bath on the 1st floor! Also on the property is a 1 bedroom cottage with kitchen, full bath and living room situated on the rear of the property near a creek. Tranquility and peacefulness abound! Don't wait.
-
2017-12-06historical
-
2017-10-04price $134,900
-
2017-06-06$139,900 Active
ⓘ Source: listings_history table (triggers on properties + properties_extension) + one-shot
backfill from property_details.listing_events for pre-trigger history.
Tax reassessment forecast NY · Partial reset (capped growth)
- Current annual tax
- $1,074 · $90/mo
- Projected year-2 tax
- $2,185 · $182/mo
- Expected delta
- +$1,111/yr (+$93/mo · 103.4%)
ⓘ Screening estimate from a state-policy table — verify with the county assessor before closing.
Climate risk First Street
- Flood 1/10 Low FEMA zone X (unshaded) · 0% chance over 30 yrs
- Wildfire 3/10 Moderate
- Heat 2/10 Low 7 d/yr ≥90°F today · 16 d/yr by 30 yrs out
- Wind 1/10 Low 100% chance of damaging wind over 30 yrs
- Air quality 2/10 Low 0 unhealthy d/yr today · 1 by 30 yrs out
Nearby sold comps map
Loading sold comps map…
Walkable amenities ~0.75 mi
Loading nearby amenities…
Taxation est. · year 1
- Rental income
- $18,031
- − Mortgage interest
- −$10,923
- − Property taxes
- −$1,074
- − Insurance
- −$975
- − Repairs & maintenance
- −$1,442
- − Management
- −$1,442
- − Depreciation
- −$5,673
- Taxable loss
- −$3,499
- Est. tax savings @ 24.0%
- +$840
- After-tax cash flow
- $764/yr
For passive investors: Depreciation is non-cash, so a rental often shows a tax loss while cash-flowing — sheltering income. Rental losses are passive: they offset passive income freely, and up to $25,000/yr can offset ordinary (W-2) income if you actively participate and your MAGI is under $100k (phasing out to $0 by $150k); unused losses carry forward. On sale, claimed depreciation is recaptured at up to 25%, and gains may owe capital-gains tax (a 1031 exchange can defer both). Figures are a year-1 estimate at your 24.0% rate — not tax advice; consult a CPA.
Schools (NCES district)
- District
- Fabius-Pompey Central School District
- NCES district ID
- 3610860
- Math proficiency
- 48% ▼ -9.00%
- Reading proficiency
- 55% ▲ 5.00%
- Median HH income
- $72,564
- Composite
- 46.16/100
- National rank
- #2499
- State rank
- #322 of 590 in NY
Livability — Tully
- Score
- 63/100
- State rank
- #800
- US rank
- #15471
Category grades
Schools grade is shown separately in the Schools card above.
Census & demographics
- City population
- 5,297
- Population (ZIP)
- 3,764
Population outlook (Onondaga County) Hauer SSP2
- Today (2025)
- 467,894 people
- By 2030
- 463,381 · -1.0%
- By 2040
- 447,697 · -4.3%
- By 2050
- 426,399 · -8.9%
- By 2075
- 373,661 · -20.1%
- By 2100
- 307,967 · -34.2%
Race, ethnicity, and origin ACS 2023
- Neighborhood character
- Predominantly White (85%)
- Race & ethnicity
- White 85% Two or more races 10% Black 3% Hispanic / Latino 2% Native American 1%
- Common ancestry
- Romanian 6% Lithuanian 6% Iranian 2%
- Foreign-born
- 2%
Political lean MEDSL · Onondaga
- 2024 margin
- D (+17.3) · D 58.6% · R 41.4%
- 2008→2024 swing
- -3.0pp toward R · 2008: 20.3pp · 2024: 17.3pp
- All cycles
- 2024: D+17.3 2020: D+20.6 2016: D+12.8 2012: D+21.1 2008: D+20.3
Not yet ingested
- Civics
- —
Market trends
- HPI YoY
- ▲ 6.66%
- Current HPI
- 312.478
- Rent YoY
- —
- Metro
- —
- State GDP YoY
- ▲ 2.60%
- F500 in state
- 92
Industry mix (Fortune 500 HQ in NY)
| Industry | F500 HQs | Revenue |
|---|---|---|
| Financial Services | 10 | $950B |
|
||
| Consumer Goods | 9 | $162B |
|
||
| Insurance | 4 | $225B |
|
||
| Telecommunications | 2 | $144B |
|
||
| Pharmaceuticals | 2 | $112B |
|
||
| Media / Entertainment | 2 | $69B |
|
||
Price history
+39.4% since first listed8 events — show timeline
- 2025-12-28 Pending — ACVMLS
- 2025-12-13 Listed $195,000 ACVMLS
- 2018-10-19 Sold (MLS) $134,900 CNYIS
- 2018-07-26 Pending — CNYIS
- 2018-07-23 Listed $134,900 CNYIS
- 2017-12-06 Listing Removed — CNYIS
- 2017-10-04 Price Changed $134,900 CNYIS
- 2017-06-06 Listed $139,900 CNYIS
Property tax history
+1.5%/yrLatest (2025): $1,074 · +1.9% YoY. Source: county tax records.
Cash-flow waterfall
monthlySold comps — $/sqft
last 12 mo · ≤1 miLoading sold comps…