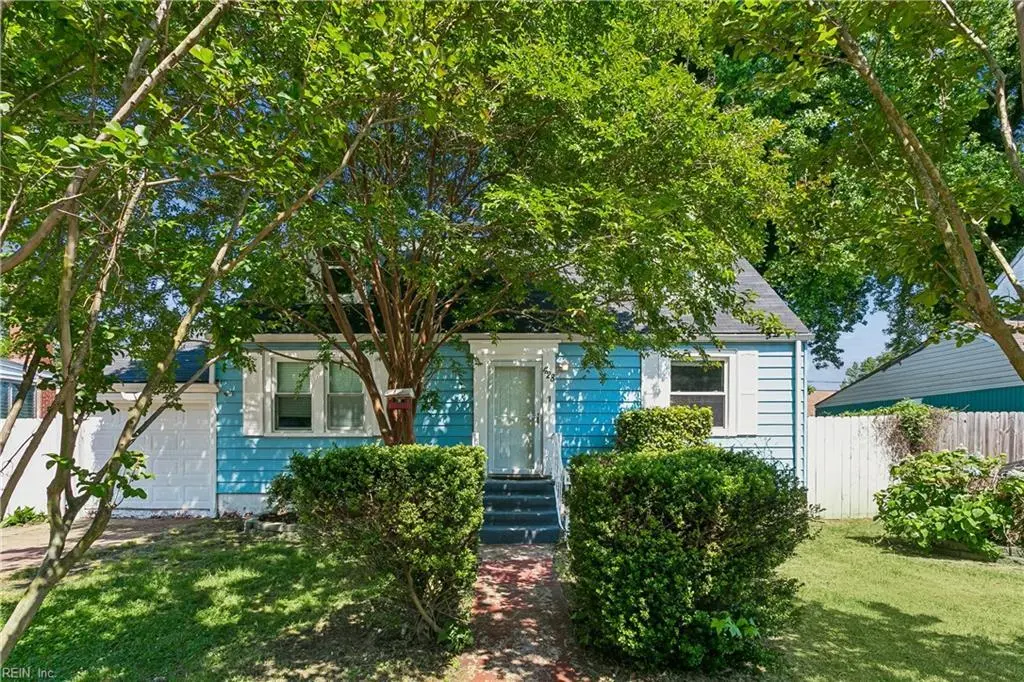
428 Shenandoah Rd · Hampton, VA
Flood risk 3/10 · Minor
- FEMA flood zone
- X (unshaded)
- Chance of flooding over 30 yrs
- 0.09%
- Est. flood insurance / yr
- $473 – $860
Fire risk 1/10 · Minimal
- Est. fire insurance / yr
- $666 – $1,236
Heat risk 9/10 · Severe
- Hot days now (above 105°F)
- 7 days/yr
- Hot days in 30 yrs
- 16 days/yr
Wind risk 8/10 · Major
- Chance of severe wind over 30 yrs
- 80.0%
Air-quality risk 2/10 · Minimal
- Unhealthy air days now
- 1 days/yr
- Unhealthy air days in 30 yrs
- 1 days/yr
Risk factors via First Street. Map © Google.
Why this score? — see what drove the D+ grade
The composite is a weighted blend of 9 inputs, each scored 0–100. Each bar is that input's sub-score; the figure is the points it added to the 100-point composite (weight × sub-score).
- ARV discount +13.7/15.0
- Cash flow +12.5/30.0
- Schools +5.5/10.0
- Rent growth +5.0/5.0
- Livability +3.8/5.0
- DSCR +3.7/10.0
- 1% rule +3.2/10.0
- Condition / age +2.5/5.0
- Appreciation +0.0/10.0
$253,000
🖨 Deal sheet (PDF) 📄 Offer letter ✓ Due diligence
Listing remarks
Charming updated home at 428 Shenandoah Rd in Hampton, full of character and ready for its next chapter! This 3-bedroom, 1-bath gem (approx. 1,542 sqft) boasts an inviting open floor plan, modern stainless steel appliances, and fresh updates throughout—perfect for first-time homebuyers or savvy investors looking to add to their portfolio. Move right in and start making memories! Enjoy the convenience of a prime central location, just minutes from shopping, dining, Langley AFB, and I-64 for an easy commute.
Key facts
- Open floor plan
- Garage
- Built 1942
Tags
Property features AI
Finance
- HOA & community: No HOA fees
Exterior
- Parking: Attached 1-car garage
- Utilities: City/County water; City/County sewer; Electric water heater; Natural gas for heating
- Home design: Detached Cape Cod; Two stories with two living levels; Crawl space foundation; Simple ownership
- Construction: Vinyl exterior; Crawl space foundation; Asphalt shingle roof
- Exterior features: Vinyl siding; Back yard with chain link fence; Asphalt shingle roof
Interior
- Kitchen: Dishwasher; Microwave; Electric range; Refrigerator
- Bedrooms: Master bedroom (first floor); Additional bedroom
- Flooring: Carpet; Laminate
- Bathrooms: One full bathroom
- Heating & cooling: Forced hot air heating (natural gas); Central air conditioning; Electric water heater
- Interior features: Carpet and laminate flooring; First-floor master bedroom; Bedroom and full bathroom on first floor; Seven rooms total (living room, great room, family room, dining room, kitchen, utility room, bedrooms)
- Laundry & utility: Utility room
Neighborhood map
What this means for you Summary
Snapshot
- This is a 3-bed/1.0-bath single-family listed at $253k.
Deal economics
- At list price, monthly cash flow is $-36 ($-428/yr) — negative.
- To cash-flow at today's rent, offer at most $247k (2.5% below list).
- To meet the 1% rule (rent ≥ 1% of price), the offer needs to be $208k (17.8% below list).
- Recommended offer: $208k (17.8% below list) — sets the bar for 1% rule.
- Cap rate 6.1% vs local median 4.5% in Hampton — top-decile yield for the area; either an underpriced asset or a hidden risk that comps aren't pricing in. Stress-test before assuming the spread holds.
Location & tenants
- Location reads 75/100 on livability (#133 in VA, #4,302 nationally) — a middle-class / working-renter tenant base. Strengths: housing A+, health & safety A+, cost of living A; Watch: crime C-, amenities D+, commute F.
- Hampton City Public School District (urban): math 60% / reading 70% proficiency, ranked #40 of 131 in VA (top 30%) — acceptable for families but not a draw, mixed tenant base, ~2y average lease.
- Zoned schools: Hunter B. Andrews (math 65% / reading 72%, grade B+, #357 of 1,108 statewide, top 33%, 1,131 students, 81% FRL); Thomas Eaton Middle (math 51% / reading 60%, grade B-, #186 of 342 statewide, top 55%, 577 students, 88% FRL); Hampton High (math 60% / reading 75%, grade B, #183 of 319 statewide, top 58%, 1,359 students, 86% FRL) — zoned schools average 85% FRL vs 49% district-wide (36 pts higher); higher-poverty schools than district average — tighter screening recommended.
- Market conditions: Rents rising fast (+21.4%/yr); 124 active listings in the ZIP; 26 comparable units currently listed for rent nearby; rentals at typical pace (median 19d on market — plan ~3-4 weeks tenant-placement turnaround); 68 units permitted in Hampton city in 2024 (0 in 5+ unit buildings).
- This rent runs 38% of the median local income ($65k/yr) — at the standard rent-burdened threshold; future hikes will face affordability resistance.
Forward outlook
- Local home prices are declining (-3.0%/yr); year-one equity from $2k of loan paydown is wiped out by about $8k of value loss. Plan a longer hold.
- Hampton County population projected at -13% by 2050 — secular population decline; favor cash flow + early exit over multi-decade hold.
Negotiation context
- It's been on market 23 days — a 2% lower offer ($249k) is reasonable based on typical stale-listing flexibility.
- 3 sale attempts since 9y ago with the ask held roughly flat each time — persistent listings suggest the price (not the market) is what's stuck; bring a comps-based counter.
- Current owner paid $164k; list at $253k implies a 55% gain — meaningful room to come down on a strong offer.
Risks & watch-outs
- Watch-outs: built in 1942 — expect roof / HVAC / electrical / plumbing capex.
- Climate carrying-cost: severe wind risk, 80% chance of damaging wind over 30y; extreme-heat days projected 7→16/yr by 2055 (HVAC capex compounding) — expect insurance premiums to compound above CPI over the hold.
Questions for the listing agent
- What do current leases actually rent for vs. the listed asking? Can we see a recent rent roll and the last 12 months of T-12 income?
- Built in 1942 — when were the roof, HVAC, electrical panel, plumbing, and water heater last replaced?
- Is there a deadline driving the sale (1031 exchange, divorce, estate, relocation)? That informs how much negotiation room exists.
- Schools are B-rated — typically a magnet for longer-tenancy family renters. What's the average tenant stay here, and is there a school-zone premium baked into asking?
- The area grade is low — what's the realistic commute time and amenity access for the typical tenant pool here? Any planned neighborhood developments (good or bad) we should know about?
- What's the average days-on-market for RENTAL listings here right now (not sales)? A rising rental-DOM trend means longer vacancies and softer asking-rent achievability than the comps imply.
- What's the recent tenant-quality profile in this submarket — average credit score on applications, eviction rate, late-payment / NSF rate, and stable-employment percentage? A property-management company in the area should have these aggregated.
- How much new for-sale + rental construction is in the pipeline within 1–3 miles? Heavy new supply typically softens prices + rents 12–24 months out; constrained supply supports both.
Investment metrics
- 1% rule
- 0.82% ✗
- Cap rate
- 6.12%
- Cash-on-cash
- -0.60%
- DSCR
- 0.97
- GRM
- 10.1
CMA / ARV
- ARV (on-the-fly)
- $293,296
- Comps found
- 12
Show comp detail 12 sales within ~0.75 mi
| Address | Dist | Beds/Ba | Sqft | Sold | Price | $/sf | Match |
|---|---|---|---|---|---|---|---|
| 806 Fairland Ave | 0.36mi | 3/2.5 | 1,620 (+2%) | 2mo | $330,000 | $204 | 73 |
| 423 Shenandoah Rd | 0.05mi | 3/2.0 | 1,829 (+15%) | 1mo | $325,000 | $178 | 68 |
| 621 Fairland Ave | 0.22mi | 4/2.5 (+1) | 1,678 (+5%) | 3mo | $309,000 | $184 | 68 |
| 405 Seminole Rd | 0.12mi | 3/2.5 | 1,400 (-12%) | 4mo | $253,000 | $181 | 65 |
| 3614 Matoaka Rd | 0.57mi | 4/2.0 (+1) | 1,566 (-2%) | 2mo | $320,500 | $205 | 60 |
| 8 Roundtree Cir | 0.40mi | 4/2.0 (+1) | 1,502 (-6%) | 4mo | $306,000 | $204 | 60 |
| 126 Cherokee Rd | 0.74mi | 3/2.0 | 1,669 (+5%) | 1mo | $323,000 | $194 | 53 |
| 410 Worster Ave | 0.53mi | 3/3.0 | 1,712 (+7%) | 3mo | $288,000 | $168 | 52 |
| 144 Algonquin Rd | 0.65mi | 3/1.5 | 1,742 (+9%) | 1mo | $315,000 | $181 | 51 |
| 2709 Verell St | 0.73mi | 2/1.0 (-1) | 1,461 (-8%) | 2mo | $165,000 | $113 | 46 |
| 355 Ivy Home Rd | 0.50mi | 4/2.5 (+1) | 1,400 (-12%) | 0mo | $299,800 | $214 | 45 |
| 15 Victor St | 0.57mi | 4/2.5 (+1) | 1,755 (+10%) | 3mo | $239,900 | $137 | 43 |
Match score weights: distance 35% · size 25% · config 20% · recency 20%. Top-matched comps best support the ARV.
Projected returns pro-forma
-3.0% appreciation · 8.0% rent growth · sell at horizon
- IRR
- -12.1%
- Equity multiple
- 0.54×
- Total profit
- $-32,287
- Equity at exit
- $37,723
- IRR
- 3.1%
- Equity multiple
- 1.27×
- Total profit
- $18,943
- Equity at exit
- $21,875
Cash invested: $70,840 (down + closing). Projections, not guarantees.
Landlord ↔ Tenant lean methodology
- Overall (STATE)
- 55 Moderately Landlord-Leaning
- State Virginia
- 55 Moderately Landlord-Leaning · D+2
- County
- — inherits STATE
- City
- — inherits STATE
ZIP-level market 23661
- Home prices YoY
- -16.7%
- Rents YoY
- 21.4%
- Active inventory
- 124
- Price-to-rent
- 10.1×
Monthly cashflow live
- Estimated rent
- $2,080 high interval (Pro) →
- Mortgage (P&I)
- −$1,327
- Tax from tax record
- −$247 /mo · $2,958/yr
- Insurance
- −$105
- HOA
- −$0
- Vacancy / Maint / Mgmt
- −$437
- Net cashflow
- $-36
Break-even live
Sensitivity live
| Price | -10% $108 | -5% $36 | +0% $-36 | +5% $-107 | +10% $-179 |
|---|---|---|---|---|---|
| Rent | -10% $-200 | -5% $-118 | +0% $-36 | +5% $47 | +10% $129 |
| Rate | -1.0pp $92 | -0.5pp $29 | base $-36 | +0.5pp $-101 | +1.0pp $-168 |
UW: 25.0% down · 7.5% · 30yr · 1.5% tax · 5.0% vac · 8.0% maint · 8.0% mgmt
Financing live
Cash to close
- Down payment
- $63,250
- Closing costs
- $7,590
- Reserves months
- —
- Total cash needed
- —
Loan-product check · same deal, 3 products live
Conventional
25% down · 7.5% · 30yr
- Down + closing
- —
- Monthly P&I
- —
- Monthly cashflow
- —
- DSCR
- —
- Eligible?
- —
Personal DTI + credit; lowest rate.
DSCR
20% down · 8.5% · 30yr
- Down + closing
- —
- Monthly P&I
- —
- Monthly cashflow
- —
- DSCR
- —
- Eligible?
- —
No personal income docs; deal must DSCR.
Hard money
10% down · 12.0% · 12mo
- Down + closing
- —
- Monthly P&I
- —
- Monthly cashflow
- —
- DSCR
- —
- Eligible?
- —
Short-term bridge; refi at stabilization.
Rent comps 26 comps
| Address | Beds | Baths | Sqft | Rent | $/sqft | DOM | Units | Dist |
|---|---|---|---|---|---|---|---|---|
| 426 Seminole Rd Hampton, VA | 4.0 | 2.5 | 2200 | $2,450 | $1.11 | 16d | 1 | 0.07mi |
| 708 Westwood Ave Hampton, VA | 3.0 | 2.5 | 1300 | $2,300 | $1.77 | 16d | 1 | 0.25mi |
| 516 Homestead Ave Hampton, VA | 4.0 | 2.0 | 1129 | $1,995 | $1.77 | 0d | 1 | 0.27mi |
| 702 Rutherford St Hampton, VA | 3.0 | 2.0 | 1445 | $1,795 | $1.24 | 25d | 1 | 0.29mi |
| 534 Brightwood Ave Hampton, VA | 3.0 | 3.0 | 1528 | $2,095 | $1.37 | 45d | 1 | 0.36mi |
| 310 Lasalle Ave Hampton, VA | 3.0 | 2.0 | 1858 | $2,200 | $1.18 | 45d | 1 | 0.49mi |
| 180 Cherokee Rd Hampton, VA | 3.0 | 1.0 | 1600 | $2,000 | $1.25 | 0d | 1 | 0.59mi |
| 607 Lee St Hampton, VA | 3.0 | 1.5 | 1404 | $2,150 | $1.53 | 45d | 1 | 0.71mi |
| 3750 Kecoughtan Rd Hampton, VA | 2.0 | 1.5 | 1300 | $1,600 | $1.23 | 45d | 1 | 0.74mi |
| 626 Chapel St Hampton, VA | 4.0 | 2.0 | 1470 | $1,900 | $1.29 | 14d | 1 | 0.74mi |
| 63 Algonquin Rd Hampton, VA | 2.0 | 1.0 | 1100 | $1,495 | $1.36 | 45d | 1 | 0.82mi |
| 901 W Queen St Hampton, VA | 2.0–3.0 | 1.5–2.5 | 1096 | $1,600 | $1.46 | 45d | 1 | 0.84mi |
| 53 Shenandoah Rd Hampton, VA | 3.0 | 2.5 | 1767 | $2,395 | $1.36 | 0d | 1 | 0.84mi |
| 448 Chapel St Hampton, VA | 3.0 | 2.0 | 1425 | $1,850 | $1.30 | 5d | 1 | 0.91mi |
| 640 Rolfe St Hampton, VA | 3.0 | 2.0 | 1100 | $2,000 | $1.82 | 45d | 1 | 0.92mi |
| 236 Pocahontas Pl Hampton, VA | 2.0 | 1.0 | 1262 | $1,795 | $1.42 | 4d | 1 | 0.92mi |
| 130 Pocahontas Pl Hampton, VA | 3.0 | 1.0 | 1415 | $1,695 | $1.20 | 45d | 1 | 1.00mi |
| 101 Prince James Dr Hampton, VA | 3.0 | 1.0 | 1766 | $1,645 | $0.93 | 16d | 1 | 1.11mi |
| 100 Chesterfield Rd Hampton, VA | 3.0 | 1.5 | 1742 | $2,200 | $1.26 | 6d | 1 | 1.15mi |
| 130 Chancellor Rd Hampton, VA | 4.0 | 1.0 | 2000 | $1,995 | $1.00 | 6d | 1 | 1.19mi |
| 613 Delaware Ave Hampton, VA | 3.0 | 2.0 | 1082 | $1,900 | $1.76 | 5d | 1 | 1.24mi |
| 707 Pennsylvania Ave Hampton, VA | 4.0 | 2.5 | 2134 | $2,800 | $1.31 | 25d | 1 | 1.26mi |
| 703 N Back River Rd Hampton, VA | 3.0 | 2.5 | 2062 | $2,475 | $1.20 | 45d | 1 | 1.30mi |
| 27 Capps Qtrs #1 Hampton, VA | 3.0 | 2.5 | 1734 | $2,200 | $1.27 | 45d | 1 | 1.40mi |
| 316 Fountain Way Hampton, VA | 3.0 | 2.5 | 1850 | $2,600 | $1.41 | 19d | 1 | 1.40mi |
| 600 Freeman Dr Hampton, VA | 1.0–2.0 | 1.0–2.0 | 892 | $1,961 | $2.20 | 0d | 5 | 1.49mi |
Listing history 16 events
-
2026-06-13statusdays on market $253,000 Under Contract 23 DOM
-
2026-06-09days on market $253,000 Active Under Contract 21 DOM
-
2026-06-08days on market $253,000 Active Under Contract 20 DOM
-
2026-06-07days on market $253,000 Active Under Contract 19 DOM
-
2026-06-03days on market $253,000 Active Under Contract 15 DOM
-
2026-06-02days on market $253,000 Active Under Contract 14 DOM
-
2026-06-02status $253,000 Active Under Contract 13 DOM
-
2026-06-01days on market $253,000 Active 13 DOM
-
2026-05-31days on market $253,000 Active 12 DOM
-
2026-05-19$253,000 Active
-
2019-07-02soldstatus $163,500
-
2019-06-05status Under Contract
-
2019-04-21$161,900 Active
-
2018-02-08historical
-
2017-12-19$141,900 Active
-
2006-06-02soldstatus $149,900
ⓘ Source: listings_history table (triggers on properties + properties_extension) + one-shot
backfill from property_details.listing_events for pre-trigger history.
Tax reassessment forecast VA · Resets to sale price
- Current annual tax
- $2,958 · $247/mo
- Projected year-2 tax
- $2,958 · $247/mo
- Expected delta
- $0/yr ($0/mo · 0.0%)
ⓘ Screening estimate from a state-policy table — verify with the county assessor before closing.
Climate risk First Street
- Flood 3/10 Moderate FEMA zone X (unshaded) · 9% chance over 30 yrs
- Wildfire 1/10 Low
- Heat 9/10 Extreme 7 d/yr ≥105°F today · 16 d/yr by 30 yrs out
- Wind 8/10 Severe 80% chance of damaging wind over 30 yrs
- Air quality 2/10 Low 1 unhealthy d/yr today · 1 by 30 yrs out
Nearby sold comps map
Loading sold comps map…
Walkable amenities ~0.75 mi
Loading nearby amenities…
Taxation est. · year 1
- Rental income
- $24,958
- − Mortgage interest
- −$14,172
- − Property taxes
- −$2,958
- − Insurance
- −$1,265
- − Repairs & maintenance
- −$1,997
- − Management
- −$1,997
- − Depreciation
- −$7,360
- Taxable loss
- −$4,791
- Est. tax savings @ 24.0%
- +$1,150
- After-tax cash flow
- $722/yr
For passive investors: Depreciation is non-cash, so a rental often shows a tax loss while cash-flowing — sheltering income. Rental losses are passive: they offset passive income freely, and up to $25,000/yr can offset ordinary (W-2) income if you actively participate and your MAGI is under $100k (phasing out to $0 by $150k); unused losses carry forward. On sale, claimed depreciation is recaptured at up to 25%, and gains may owe capital-gains tax (a 1031 exchange can defer both). Figures are a year-1 estimate at your 24.0% rate — not tax advice; consult a CPA.
Schools (NCES district)
- District
- Hampton City Public School District
- NCES district ID
- 5101800
- Math proficiency
- 60% ▼ -21.00%
- Reading proficiency
- 70% ▼ -4.00%
- Median HH income
- $50,089
- Composite
- 55.19/100
- National rank
- #1272
- State rank
- #40 of 131 in VA
Livability — Hampton
- Score
- 75/100
- State rank
- #133
- US rank
- #4302
Category grades
Schools grade is shown separately in the Schools card above.
Census & demographics
- Census place
- Hampton, VA
- County
- Hampton City · 132,421 people
- City population
- 132,421
- Metro
- Virginia Beach-Norfolk-Newport News, VA-NC
- Population (ZIP)
- 14,005
- Household income
- $65,446
- Rent vs Own
- Severe rent burden
- 704.0
Population outlook (Hampton County) Hauer SSP2
- Today (2025)
- 134,055 people
- By 2030
- 131,753 · -1.7%
- By 2040
- 125,017 · -6.7%
- By 2050
- 116,825 · -12.9%
- By 2075
- 97,033 · -27.6%
- By 2100
- 76,188 · -43.2%
Race, ethnicity, and origin ACS 2023
- Neighborhood character
- Diverse neighborhood (Simpson 0.56)
- Race & ethnicity
- Black 59% White 31% Two or more races 6% Hispanic / Latino 4%
- Common ancestry
- Serbian 2% Italian 2% Romanian 1%
- Foreign-born
- 3% · Canada
- Languages at home
- 95% English-only · Spanish 2% French/Haitian/Cajun 1% Arabic 1%
Political lean MEDSL · Hampton
- 2024 margin
- Solid D (+39.9) · D 69.2% · R 29.4% · Other 1.4%
- 2008→2024 swing
- +1.0pp no change · 2008: 38.9pp · 2024: 39.9pp
- All cycles
- 2024: D+39.9 2020: D+42.2 2016: D+37.8 2012: D+45.4 2008: D+38.9
Not yet ingested
- Civics
- —
Market trends
- HPI YoY
- ▼ -54.95%
- Current HPI
- 274.2769
- Rent YoY
- ▲ 21.35%
- Metro
- Virginia Beach-Norfolk-Newport News, VA-NC
- State GDP YoY
- ▲ 2.40%
- F500 in state
- 50
Industry mix (Fortune 500 HQ in VA)
| Industry | F500 HQs | Revenue |
|---|---|---|
| Aerospace / Defense | 4 | $236B |
|
||
| Technology / Defense | 3 | $32B |
|
||
| Financial Services | 2 | $176B |
|
||
| Utilities | 2 | $27B |
|
||
| Insurance | 2 | $25B |
|
||
| Technology | 2 | $15B |
|
||
Price history
+68.8% since first listed7 events — show timeline
- 2026-05-19 Listed $253,000 REINMLS
- 2019-07-02 Sold (Public Records) $163,500 Public Records
- 2019-06-05 Pending — REINMLS
- 2019-04-21 Listed $161,900 REINMLS
- 2018-02-08 Listing Removed — REINMLS
- 2017-12-19 Listed $141,900 REINMLS
- 2006-06-02 Sold (Public Records) $149,900 Public Records
Property tax history
+10.6%/yrLatest (2025): $2,958 · +9.2% YoY. Source: county tax records.
Cash-flow waterfall
monthlySold comps — $/sqft
last 12 mo · ≤1 miLoading sold comps…