91 Acorn Nut Ln · Front Royal, VA
Flood risk No data
- FEMA flood zone
- —
- Chance of flooding over 30 yrs
- —
- Est. flood insurance / yr
- —
Fire risk No data
- Est. fire insurance / yr
- —
Heat risk No data
- Hot days now (above threshold)
- —
- Hot days in 30 yrs
- —
Wind risk No data
- Chance of severe wind over 30 yrs
- —
Air-quality risk No data
- Unhealthy air days now
- —
- Unhealthy air days in 30 yrs
- —
Risk factors via First Street. Map © Google.
Why this score? — see what drove the D- grade
The composite is a weighted blend of 9 inputs, each scored 0–100. Each bar is that input's sub-score; the figure is the points it added to the 100-point composite (weight × sub-score).
- ARV discount +12.8/15.0
- Cash flow +7.4/30.0
- Schools +4.9/10.0
- Rent growth +4.6/5.0
- Livability +3.7/5.0
- Condition / age +2.5/5.0
- DSCR +1.5/10.0
- 1% rule +1.0/10.0
- Appreciation +0.0/10.0
$215,000
🖨 Deal sheet 📄 Offer letter ✓ Due diligence
Listing remarks MLS
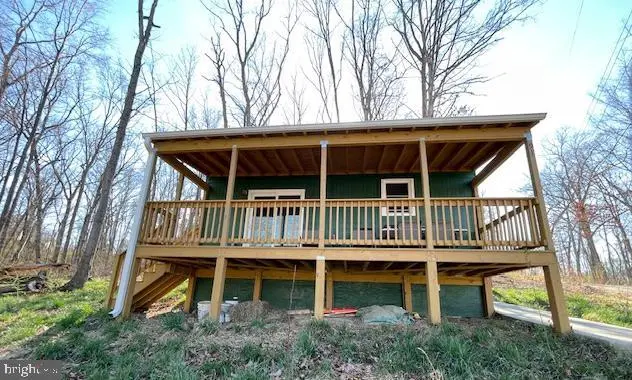
Come see this cute home on one acre close to the town of Front Royal and all of its amenities! This home was rebuilt just 3 years ago and is perfect for a weekend getaway place or for someone that wants a place to bring their pets and enjoy the outdoors with one acre! You can enjoy the skyline from the spacious covered front porch or the wraparound patio in the back. Enjoy cozy winters with the pellet stove or the outdoor activities in the warmer months! Immediate occupancy is available. Call for details.
Key facts
- 1 acre lot
- Built 2022
- Listed 66 days
Neighborhood map
What this means for you Summary
Snapshot
- This is a 1-bed/1.0-bath single-family listed at $215k.
Deal economics
- At list price, monthly cash flow is $-279 ($-3k/yr) — negative.
- To cash-flow at today's rent, offer at most $166k (22.9% below list).
- To meet the 1% rule (rent ≥ 1% of price), the offer needs to be $129k (39.9% below list).
- Recommended offer: $129k (39.9% below list) — sets the bar for 1% rule.
- Cap rate 4.7% vs local median 3.6% in Front Royal — top-decile yield for the area; either an underpriced asset or a hidden risk that comps aren't pricing in. Stress-test before assuming the spread holds.
Location & tenants
- Location reads 73/100 on livability (#162 in VA) — a middle-class / working-renter tenant base. Strengths: health & safety A+, housing A, cost of living B+; Watch: commute F, employment D-.
- Warren County Public School District (town): math 49% / reading 64% proficiency, ranked #70 of 131 in VA (top 53%) — acceptable for families but not a draw, mixed tenant base, ~2y average lease.
- Market conditions: Rents rising fast (+8.3%/yr); 280 active listings in the ZIP; solid renter incomes; 170 units permitted in Warren County in 2024 (0 in 5+ unit buildings).
Forward outlook
- Local home prices are declining (-3.0%/yr); year-one equity from $1k of loan paydown is wiped out by about $6k of value loss. Plan a longer hold.
- Warren County population projected at +8% by 2050 — modest demand growth; plan on rents tracking national, not racing it.
Negotiation context
- It's been on market 67 days — a 6% lower offer ($202k) is reasonable based on typical stale-listing flexibility.
Questions for the listing agent
- What do current leases actually rent for vs. the listed asking? Can we see a recent rent roll and the last 12 months of T-12 income?
- It's been on market 67 days. Have you received any prior offers? Is the seller open to a 40% concession, seller financing, or rate buy-down credit?
- Why hasn't it sold? Are there any deal-killer items the seller is aware of (foundation, flood, title, zoning, code violations)?
- Is there a deadline driving the sale (1031 exchange, divorce, estate, relocation)? That informs how much negotiation room exists.
- Schools are B-rated — typically a magnet for longer-tenancy family renters. What's the average tenant stay here, and is there a school-zone premium baked into asking?
- The area grade is low — what's the realistic commute time and amenity access for the typical tenant pool here? Any planned neighborhood developments (good or bad) we should know about?
- What's the average days-on-market for RENTAL listings here right now (not sales)? A rising rental-DOM trend means longer vacancies and softer asking-rent achievability than the comps imply.
- What's the recent tenant-quality profile in this submarket — average credit score on applications, eviction rate, late-payment / NSF rate, and stable-employment percentage? A property-management company in the area should have these aggregated.
- How much new for-sale + rental construction is in the pipeline within 1–3 miles? Heavy new supply typically softens prices + rents 12–24 months out; constrained supply supports both.
Investment metrics
- 1% rule
- 0.60% ✗
- Cap rate
- 4.74%
- Cash-on-cash
- -5.56%
- DSCR
- 0.75
- GRM
- 13.9
CMA / ARV
- ARV (median comp)
- $243,921
- List price
- $215,000
- Delta
- -11.86%
- Verdict
- UNDERPRICED
- Comps
- 1 within 2.0 mi
Projected returns pro-forma
-3.0% appreciation · 8.0% rent growth · sell at horizon
- IRR
- -21.2%
- Equity multiple
- 0.24×
- Total profit
- $-45,864
- Equity at exit
- $32,057
- IRR
- -7.1%
- Equity multiple
- 0.47×
- Total profit
- $-32,130
- Equity at exit
- $18,589
Cash invested: $60,200 (down + closing). Projections, not guarantees.
Landlord ↔ Tenant lean methodology
- Overall (STATE)
- 55 Moderately Landlord-Leaning
- State Virginia
- 55 Moderately Landlord-Leaning · D+2
- County
- — inherits STATE
- City
- — inherits STATE
ZIP-level market 22630
- Home prices YoY
- -27.1%
- Rents YoY
- 8.3%
- Active inventory
- 280
- Price-to-rent
- 13.9×
Monthly cashflow live
- Estimated rent
- $1,291 medium interval (Pro) →
- Mortgage (P&I)
- −$1,127
- Tax from tax record
- −$82 /mo · $979/yr
- Insurance
- −$90
- HOA
- −$0
- Vacancy / Maint / Mgmt
- −$271
- Net cashflow
- $-279
Break-even live
UW: 25.0% down · 7.5% · 30yr · 1.5% tax · 5.0% vac · 8.0% maint · 8.0% mgmt
Financing live
Cash to close
- Down payment
- $53,750
- Closing costs
- $6,450
- Reserves months
- —
- Total cash needed
- —
Loan-product check · same deal, 3 products live
Conventional
25% down · 7.5% · 30yr
- Down + closing
- —
- Monthly P&I
- —
- Monthly cashflow
- —
- DSCR
- —
- Eligible?
- —
Personal DTI + credit; lowest rate.
DSCR
20% down · 8.5% · 30yr
- Down + closing
- —
- Monthly P&I
- —
- Monthly cashflow
- —
- DSCR
- —
- Eligible?
- —
No personal income docs; deal must DSCR.
Hard money
10% down · 12.0% · 12mo
- Down + closing
- —
- Monthly P&I
- —
- Monthly cashflow
- —
- DSCR
- —
- Eligible?
- —
Short-term bridge; refi at stabilization.
Listing history 15 events
-
2026-06-16days on market $215,000 Active 67 DOM
-
2026-06-15days on market $215,000 Active 66 DOM
-
2026-06-13days on market $215,000 Active 64 DOM
-
2026-06-09days on market $215,000 Active 60 DOM
-
2026-06-08days on market $215,000 Active 59 DOM
-
2026-06-07days on market $215,000 Active 58 DOM
-
2026-06-04days on market $215,000 Active 55 DOM
-
2026-06-03days on market $215,000 Active 54 DOM
-
2026-06-02days on market $215,000 Active 53 DOM
-
2026-06-01days on market $215,000 Active 52 DOM
-
2026-05-31days on market $215,000 Active 51 DOM
-
2026-05-16price $215,000 510-char remark
Show marketing remark (510 chars)
Come see this cute home on one acre close to the town of Front Royal and all of its amenities! This home was rebuilt just 3 years ago and is perfect for a weekend getaway place or for someone that wants a place to bring their pets and enjoy the outdoors with one acre! You can enjoy the skyline from the spacious covered front porch or the wraparound patio in the back. Enjoy cozy winters with the pellet stove or the outdoor activities in the warmer months! Immediate occupancy is available. Call for details.
-
2026-04-11$225,000 Active 510-char remark
Show marketing remark (510 chars)
Come see this cute home on one acre close to the town of Front Royal and all of its amenities! This home was rebuilt just 3 years ago and is perfect for a weekend getaway place or for someone that wants a place to bring their pets and enjoy the outdoors with one acre! You can enjoy the skyline from the spacious covered front porch or the wraparound patio in the back. Enjoy cozy winters with the pellet stove or the outdoor activities in the warmer months! Immediate occupancy is available. Call for details.
-
2026-03-25historical $225,000 510-char remark
Show marketing remark (510 chars)
Come see this cute home on one acre close to the town of Front Royal and all of its amenities! This home was rebuilt just 3 years ago and is perfect for a weekend getaway place or for someone that wants a place to bring their pets and enjoy the outdoors with one acre! You can enjoy the skyline from the spacious covered front porch or the wraparound patio in the back. Enjoy cozy winters with the pellet stove or the outdoor activities in the warmer months! Immediate occupancy is available. Call for details.
-
2023-09-25soldstatus $190,000
ⓘ Source: listings_history table (triggers on properties + properties_extension) + one-shot
backfill from property_details.listing_events for pre-trigger history.
Tax reassessment forecast VA · Resets to sale price
- Current annual tax
- $979 · $82/mo
- Projected year-2 tax
- $1,763 · $147/mo
- Expected delta
- +$784/yr (+$65/mo · 80.0%)
ⓘ Screening estimate from a state-policy table — verify with the county assessor before closing.
Nearby sold comps map
Loading sold comps map…
Walkable amenities ~0.75 mi
Loading nearby amenities…
Taxation est. · year 1
- Rental income
- $15,493
- − Mortgage interest
- −$12,043
- − Property taxes
- −$979
- − Insurance
- −$1,075
- − Repairs & maintenance
- −$1,239
- − Management
- −$1,239
- − Depreciation
- −$6,255
- Taxable loss
- −$7,338
- Est. tax savings @ 24.0%
- +$1,761
- After-tax cash flow
- $-1,584/yr
For passive investors: Depreciation is non-cash, so a rental often shows a tax loss while cash-flowing — sheltering income. Rental losses are passive: they offset passive income freely, and up to $25,000/yr can offset ordinary (W-2) income if you actively participate and your MAGI is under $100k (phasing out to $0 by $150k); unused losses carry forward. On sale, claimed depreciation is recaptured at up to 25%, and gains may owe capital-gains tax (a 1031 exchange can defer both). Figures are a year-1 estimate at your 24.0% rate — not tax advice; consult a CPA.
Schools (NCES district)
- District
- Warren County Public School District
- NCES district ID
- 5103870
- Math proficiency
- 49% ▼ -29.00%
- Reading proficiency
- 64% ▼ -10.00%
- Median HH income
- $61,504
- Composite
- 49.22/100
- National rank
- #2039
- State rank
- #70 of 131 in VA
Livability — Front Royal
- Score
- 73/100
- State rank
- #162
- US rank
- #5050
Category grades
Schools grade is shown separately in the Schools card above.
Census & demographics
- County
- Warren County · 35,615 people
- City population
- 35,615
- Metro
- Washington-Arlington-Alexandria, DC-VA-MD-WV
- Population (ZIP)
- 35,615
- Household income
- $84,631
- Rent vs Own
- Severe rent burden
- 460.0
Population outlook (Warren County) Hauer SSP2
- Today (2025)
- 42,045 people
- By 2030
- 43,257 · +2.9%
- By 2040
- 45,088 · +7.2%
- By 2050
- 45,567 · +8.4%
- By 2075
- 46,081 · +9.6%
- By 2100
- 42,093 · +0.1%
Race, ethnicity, and origin ACS 2023
- Neighborhood character
- Predominantly White (81%)
- Race & ethnicity
- White 81% Hispanic / Latino 7% Black 6% Two or more races 5% Asian 2%
- Hispanic origin (detail)
- Mexican 1%
- Common ancestry
- Slovak 3% Lithuanian 2% Romanian 2%
- Foreign-born
- 6% · Canada
- Languages at home
- 92% English-only · Spanish 5% Other Indo-European 1%
Political lean MEDSL · Warren
- 2024 margin
- Solid R (+37.6) · D 30.6% · R 68.3% · Other 1.1%
- 2008→2024 swing
- -26.0pp toward R · 2008: -11.7pp · 2024: -37.6pp
- All cycles
- 2024: R+37.6 2020: R+35.3 2016: R+37.1 2012: R+20.5 2008: R+11.7
Not yet ingested
- Civics
- —
Market trends
- HPI YoY
- ▼ -118.82%
- Current HPI
- 319.8136
- Rent YoY
- ▲ 8.30%
- Metro
- Washington-Arlington-Alexandria, DC-VA-MD-WV
- State GDP YoY
- ▲ 2.40%
- F500 in state
- 50
Industry mix (Fortune 500 HQ in VA)
| Industry | F500 HQs | Revenue |
|---|---|---|
| Aerospace / Defense | 4 | $236B |
|
||
| Technology / Defense | 3 | $32B |
|
||
| Financial Services | 2 | $176B |
|
||
| Utilities | 2 | $27B |
|
||
| Insurance | 2 | $25B |
|
||
| Technology | 2 | $15B |
|
||
Price history
+13.2% since first listed4 events — show timeline
- 2026-05-16 Price Changed $215,000 BRIGHT MLS
- 2026-04-11 Listed $225,000 BRIGHT MLS
- 2026-03-25 Coming Soon $225,000 BRIGHT MLS
- 2023-09-25 Sold (Public Records) $190,000 Public Records
Property tax history
+154.8%/yrLatest (2025): $979 · +500.0% YoY. Source: county tax records.
Cash-flow waterfall
monthlySold comps — $/sqft
last 12 mo · ≤1 miLoading sold comps…