 Multi-family
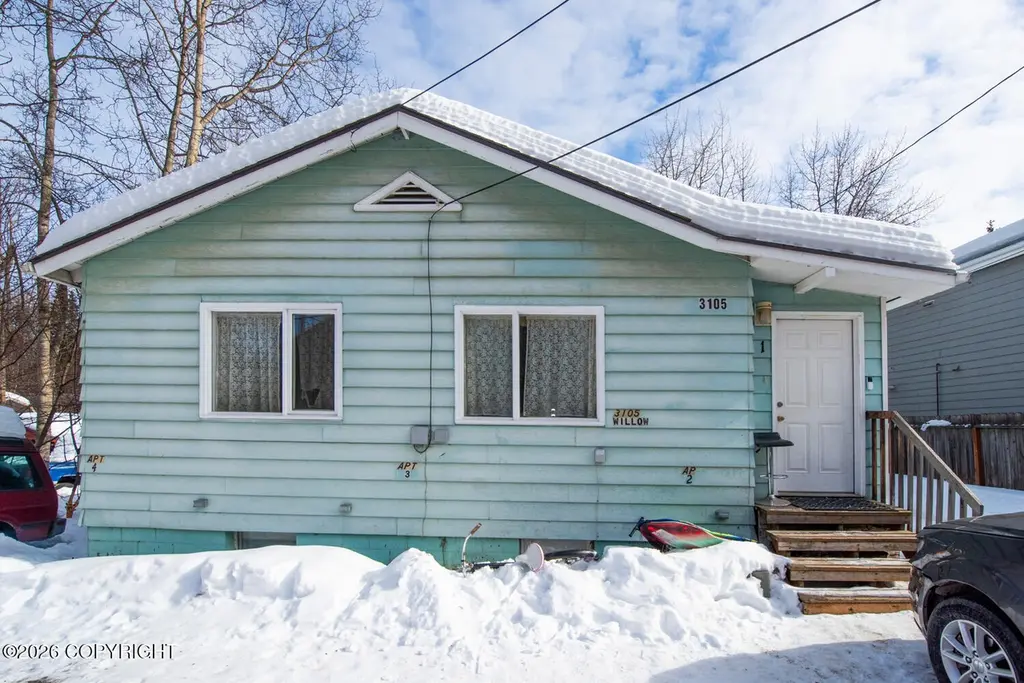
3105 Willow St · Anchorage, AK
Flood risk 1/10 · Minimal
- FEMA flood zone
- X (unshaded)
- Chance of flooding over 30 yrs
- 0.0%
- Est. flood insurance / yr
- $473 – $860
Fire risk No data
- Est. fire insurance / yr
- —
Heat risk No data
- Hot days now (above threshold)
- —
- Hot days in 30 yrs
- —
Wind risk No data
- Chance of severe wind over 30 yrs
- —
Air-quality risk 1/10 · Minimal
- Unhealthy air days now
- —
- Unhealthy air days in 30 yrs
- —
Risk factors via First Street. Map © Google.
Why this score? — see what drove the C- grade
The composite is a weighted blend of 9 inputs, each scored 0–100. Each bar is that input's sub-score; the figure is the points it added to the 100-point composite (weight × sub-score).
- Cash flow +20.8/30.0
- DSCR +6.6/10.0
- ARV discount +6.4/15.0
- 1% rule +5.1/10.0
- Livability +3.9/5.0
- Schools +3.7/10.0
- Rent growth +3.3/5.0
- Condition / age +2.5/5.0
- Appreciation +0.0/10.0
$635,000
🖨 Deal sheet (PDF) 📄 Offer letter ✓ Due diligence
Multi-family units
County records classify this as Multi-Family (5+ Unit). Listing-text estimate: 1 unit. estimate disagrees with records
5+ unit building — per-unit beds/baths from public records are typically unavailable; the breakdown below (if shown) is an estimate from the listing text.
Listing remarks
Back on Market! Buyer diagnosed with life changing illness. Inspection done. Extremely well maintained older 4plex centrally located minutes from the airport. Two vacant units to view. Exceptional pride of ownership. Three bedroom ''owners'' unit, 2x 2 br units, and 1x1 br unit. Clean, cozy, move in ready.
Key facts
- 7,000 sq ft lot
- 8 parking spots
- Built 1961
Property features AI
Exterior
- Parking: 8 open parking spaces; No attached garage; No carport
- Utilities: Public sewer
- Home design: Multi-family property; Built in 1961
- Construction: Wood frame construction; Block foundation; Shingle/asphalt roof
- Exterior features: Paved road access
Interior
- Bedrooms: 8 bedrooms
- Flooring: Carpet
- Bathrooms: 4 full bathrooms
- Interior features: Carpet flooring
Neighborhood map
What this means for you Summary
Snapshot
- This is a 8-bed/4.0-bath multifamily listed at $635k.
Deal economics
- At list price, monthly cash flow is $871 ($10k/yr) — positive.
- The deal already cash-flows at list — no discount required.
- Meets the 1% rule at list price ($6k rent vs $635k).
- Cap rate 7.9% vs local median 3.8% in Anchorage — top-decile yield for the area; either an underpriced asset or a hidden risk that comps aren't pricing in. Stress-test before assuming the spread holds.
Location & tenants
- Location reads 78/100 on livability (#6 in AK, #2,553 nationally) — a middle-class / working-renter tenant base. Strengths: amenities A+, commute A+, employment A+; Watch: crime F, cost of living F.
- Anchorage School District (urban): math 37% / reading 43% proficiency, ranked #6 of 21 in AK (top 29%) — families likely to look elsewhere, expect single-tenant / working-renter base with shorter leases.
- Zoned schools: Turnagain Elementary (math 47% / reading 52%, grade D, #55 of 156 statewide, top 37%, 308 students, 41% FRL); Romig Middle School (math 24% / reading 44%, grade F, #22 of 36 statewide, top 63%, 720 students, 37% FRL); West High School (math 32% / reading 27%, grade F, #39 of 61 statewide, top 65%, 1,763 students, 40% FRL) — zoned schools at 39% FRL track the district average.
- Market conditions: Rents rising (+3.3%/yr); 66 active listings in the ZIP; solid renter incomes; 306 units permitted in Anchorage Municipality in 2024 (90 in 5+ unit buildings).
- At $6,423/mo this rent would consume 74% of the median local household income ($104k/yr) (locally 643% of renters already pay >50% of income on rent) — very limited rent-growth headroom before tenants either downsize or default.
Forward outlook
- Local home prices are declining (-3.0%/yr); year-one equity from $4k of loan paydown is wiped out by about $19k of value loss. Plan a longer hold.
- Anchorage County population projected at +12% by 2050 — modest demand growth; plan on rents tracking national, not racing it.
Negotiation context
- Only 13 days on market — expect competitive offers; lowballing is unlikely to land.
- 3 sale attempts since 33y ago with the ask held roughly flat each time — persistent listings suggest the price (not the market) is what's stuck; bring a comps-based counter.
Questions for the listing agent
- Built in 1961 — when were the roof, HVAC, electrical panel, plumbing, and water heater last replaced?
- Is there a deadline driving the sale (1031 exchange, divorce, estate, relocation)? That informs how much negotiation room exists.
- Schools are B-rated — typically a magnet for longer-tenancy family renters. What's the average tenant stay here, and is there a school-zone premium baked into asking?
- Crime grade is F in this area — have there been break-ins, vandalism, or insurance claims at this property in the last 3 years? What carrier currently insures it and at what premium?
- What's the average days-on-market for RENTAL listings here right now (not sales)? A rising rental-DOM trend means longer vacancies and softer asking-rent achievability than the comps imply.
- What's the recent tenant-quality profile in this submarket — average credit score on applications, eviction rate, late-payment / NSF rate, and stable-employment percentage? A property-management company in the area should have these aggregated.
- How much new apartment / multifamily construction is in the pipeline within 1–3 miles? Heavy new supply (>2% of stock underway) typically softens rents 12–24 months out; light construction supports rent growth.
Investment metrics
- 1% rule
- 1.01% ✓
- Cap rate
- 7.94%
- Cash-on-cash
- 5.88%
- DSCR
- 1.26
- GRM
- 8.2
CMA / ARV
- ARV (on-the-fly)
- $620,448
- Comps found
- 8
Show comp detail 8 sales within ~0.75 mi
| Address | Dist | Beds/Ba | Sqft | Sold | Price | $/sf | Match |
|---|---|---|---|---|---|---|---|
| 3105 Willow St | 0.00mi | 8/4.0 | 3,372 (0%) | 1mo | $635,000 | $188 | 99 |
| 2510 Abbey Ln | 0.39mi | 8/4.0 | 3,520 (+4%) | 8mo | $630,000 | $179 | 68 |
| 2804 W 30th Ave | 0.45mi | 8/4.0 | 3,472 (+3%) | 24mo | $670,000 | $193 | 55 |
| 3404 Greenland Dr | 0.35mi | 8/4.0 | 3,700 (+10%) | 20mo | $650,000 | $176 | 51 |
| 2917 W 34th Ave | 0.53mi | 8/4.0 | 3,582 (+6%) | 24mo | $549,000 | $153 | 45 |
| 1306 W 39th Ave | 0.74mi | 8/4.0 | 3,248 (-4%) | 22mo | $698,000 | $215 | 41 |
| 2604 W 33rd Ave | 0.32mi | 8/8.0 | 3,840 (+14%) | 7mo | $675,000 | $176 | 40 |
| 3901 Merrill Dr | 0.61mi | 8/8.0 | 3,552 (+5%) | 10mo | $655,000 | $184 | 38 |
Match score weights: distance 35% · size 25% · config 20% · recency 20%. Top-matched comps best support the ARV.
Projected returns pro-forma
-3.0% appreciation · 3.3% rent growth · sell at horizon
- IRR
- -6.9%
- Equity multiple
- 0.74×
- Total profit
- $-45,487
- Equity at exit
- $94,681
- IRR
- 3.1%
- Equity multiple
- 1.22×
- Total profit
- $39,794
- Equity at exit
- $54,903
Cash invested: $177,800 (down + closing). Projections, not guarantees.
Landlord ↔ Tenant lean methodology
- Overall (STATE)
- 80 Strongly Landlord-Friendly
- State Alaska
- 80 Strongly Landlord-Friendly · R+8
- County
- — inherits STATE
- City
- — inherits STATE
ZIP-level market 99517
- Rents YoY
- 3.3%
- Active inventory
- 66
- Price-to-rent
- 29.0×
Monthly cashflow live
- Estimated rent
- $6,423 high interval (Pro) →
- Mortgage (P&I)
- −$3,330
- Tax from tax record
- −$608 /mo · $7,301/yr
- Insurance
- −$265
- HOA
- −$0
- Vacancy / Maint / Mgmt
- −$1,349
- Net cashflow
- $871
Break-even live
Sensitivity live
| Price | -10% $1,231 | -5% $1,051 | +0% $871 | +5% $691 | +10% $512 |
|---|---|---|---|---|---|
| Rent | -10% $364 | -5% $617 | +0% $871 | +5% $1,125 | +10% $1,379 |
| Rate | -1.0pp $1,191 | -0.5pp $1,033 | base $871 | +0.5pp $707 | +1.0pp $539 |
4-unit breakdown (identical units grouped — click to expand)
| Units | Beds | Baths | Est. rent |
|---|---|---|---|
| 1× unit | 3 | 1 | $1,824 |
| 2× units | 2 | 1 | $3,122 |
| #2 | 2 | 1 | $1,561 |
| #3 | 2 | 1 | $1,561 |
| 1× unit | 1 | 1 | $1,477 |
| Total (4 units) | $6,423 | ||
UW: 25.0% down · 7.5% · 30yr · 1.5% tax · 5.0% vac · 8.0% maint · 8.0% mgmt
Financing live
Cash to close
- Down payment
- $158,750
- Closing costs
- $19,050
- Reserves months
- —
- Total cash needed
- —
Loan-product check · same deal, 3 products live
Conventional
25% down · 7.5% · 30yr
- Down + closing
- —
- Monthly P&I
- —
- Monthly cashflow
- —
- DSCR
- —
- Eligible?
- —
Personal DTI + credit; lowest rate.
DSCR
20% down · 8.5% · 30yr
- Down + closing
- —
- Monthly P&I
- —
- Monthly cashflow
- —
- DSCR
- —
- Eligible?
- —
No personal income docs; deal must DSCR.
Hard money
10% down · 12.0% · 12mo
- Down + closing
- —
- Monthly P&I
- —
- Monthly cashflow
- —
- DSCR
- —
- Eligible?
- —
Short-term bridge; refi at stabilization.
Listing history 5 events
-
2026-04-16status Pending
-
2026-04-09status Active
-
2026-03-28status Pending
-
2026-03-22$635,000 Active
-
1993-12-07$125,000
ⓘ Source: listings_history table (triggers on properties + properties_extension) + one-shot
backfill from property_details.listing_events for pre-trigger history.
Tax reassessment forecast AK · Partial reset (capped growth)
- Current annual tax
- $7,301 · $608/mo
- Projected year-2 tax
- $7,429 · $619/mo
- Expected delta
- +$128/yr (+$11/mo · 1.7%)
ⓘ Screening estimate from a state-policy table — verify with the county assessor before closing.
Climate risk First Street
- Flood 1/10 Low FEMA zone X (unshaded) · 0% chance over 30 yrs
- Air quality 1/10 Low
Nearby sold comps map
Loading sold comps map…
Walkable amenities ~0.75 mi
Loading nearby amenities…
Taxation est. · year 1
- Rental income
- $77,076
- − Mortgage interest
- −$35,570
- − Property taxes
- −$7,301
- − Insurance
- −$3,175
- − Repairs & maintenance
- −$6,166
- − Management
- −$6,166
- − Depreciation
- −$18,473
- Taxable income
- $225
- Est. tax owed @ 24.0%
- −$54
- After-tax cash flow
- $10,400/yr
For passive investors: Depreciation is non-cash, so a rental often shows a tax loss while cash-flowing — sheltering income. Rental losses are passive: they offset passive income freely, and up to $25,000/yr can offset ordinary (W-2) income if you actively participate and your MAGI is under $100k (phasing out to $0 by $150k); unused losses carry forward. On sale, claimed depreciation is recaptured at up to 25%, and gains may owe capital-gains tax (a 1031 exchange can defer both). Figures are a year-1 estimate at your 24.0% rate — not tax advice; consult a CPA.
Schools (NCES district)
- District
- Anchorage School District
- NCES district ID
- 0200180
- Math proficiency
- 37% ▼ -2.00%
- Reading proficiency
- 43% ▲ 1.00%
- Median HH income
- $76,447
- Composite
- 37.0/100
- National rank
- #4523
- State rank
- #6 of 21 in AK
Livability — Anchorage
- Score
- 78/100
- State rank
- #6
- US rank
- #2553
Category grades
Schools grade is shown separately in the Schools card above.
Census & demographics
- Census place
- Anchorage, AK
- County
- Anchorage Borough · 246,594 people
- City population
- 218,117
- Metro
- Anchorage, AK
- Population (ZIP)
- 16,486
- Household income
- $103,880
- Rent vs Own
- Severe rent burden
- 643.0
Population outlook (Anchorage County) Hauer SSP2
- Today (2025)
- 314,993 people
- By 2030
- 321,771 · +2.2%
- By 2040
- 335,493 · +6.5%
- By 2050
- 352,799 · +12.0%
- By 2075
- 414,771 · +31.7%
- By 2100
- 474,485 · +50.6%
Race, ethnicity, and origin ACS 2023
- Neighborhood character
- Diverse neighborhood (Simpson 0.61)
- Race & ethnicity
- White 61% Two or more races 10% Asian 9% Native American 8% Hispanic / Latino 7% Black 4% Pacific Islander 3%
- Hispanic origin (detail)
- Mexican 3% Puerto Rican 2%
- Common ancestry
- Portuguese 3% Italian 2% Slovene 2%
- Foreign-born
- 11% · Canada, South Korea, China
- Languages at home
- 86% English-only · Tagalog/Filipino 4% Other Asian/Pacific 2% Spanish 2%
Political lean MEDSL · Anchorage
- 2024 margin
- D (+12.7) · D 56.3% · R 43.7%
- 2016→2024 swing
- +27.9pp toward D · 2016: -15.2pp · 2024: 12.7pp
- All cycles
- 2024: D+12.7 2016: R+15.2
Not yet ingested
- Civics
- —
Market trends
- HPI YoY
- ▼ -193.57%
- Current HPI
- 298.4457
- Rent YoY
- ▲ 3.30%
- Metro
- Anchorage, AK
- State GDP YoY
- —
- F500 in state
- 0
Price history
+408.0% since first listed5 events — show timeline
- 2026-04-16 Pending — AKMLS
- 2026-04-09 Relisted — AKMLS
- 2026-03-28 Pending — AKMLS
- 2026-03-22 Listed $635,000 AKMLS
- 1993-12-07 Listed $125,000 AKMLS
Property tax history
+2.7%/yrLatest (2025): $7,301 · +0.4% YoY. Source: county tax records.
Cash-flow waterfall
monthlySold comps — $/sqft
last 12 mo · ≤1 miLoading sold comps…