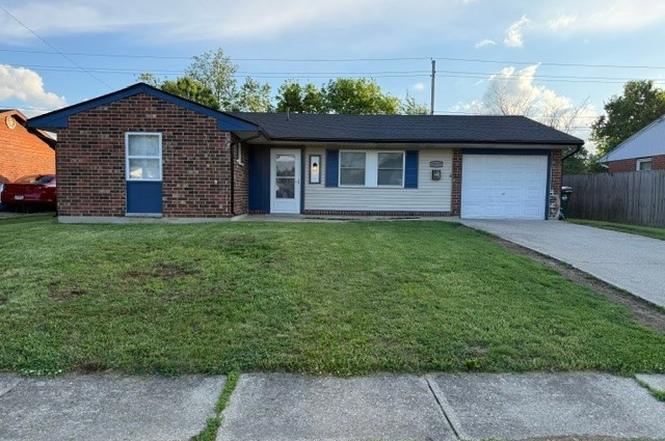
2077 Pueblo Dr · Xenia, OH
Flood risk 6/10 · Moderate
- FEMA flood zone
- X (unshaded)
- Chance of flooding over 30 yrs
- 0.69%
- Est. flood insurance / yr
- $507 – $1,088
Fire risk 1/10 · Minimal
- Est. fire insurance / yr
- $713 – $1,323
Heat risk 3/10 · Minor
- Hot days now (above 100°F)
- 7 days/yr
- Hot days in 30 yrs
- 18 days/yr
Wind risk 2/10 · Minimal
- Chance of severe wind over 30 yrs
- 1.0%
Air-quality risk 3/10 · Minor
- Unhealthy air days now
- 3 days/yr
- Unhealthy air days in 30 yrs
- 4 days/yr
Risk factors via First Street. Map © Google.
Why this score? — see what drove the D grade
The composite is a weighted blend of 9 inputs, each scored 0–100. Each bar is that input's sub-score; the figure is the points it added to the 100-point composite (weight × sub-score).
- Cash flow +13.5/30.0
- ARV discount +7.2/15.0
- DSCR +4.1/10.0
- Schools +4.0/10.0
- Rent growth +3.9/5.0
- Livability +3.8/5.0
- 1% rule +3.2/10.0
- Condition / age +2.5/5.0
- Appreciation +0.0/10.0
$189,900
🖨 Deal sheet (PDF) 📄 Offer letter ✓ Due diligence
Listing remarks
Welcome to this well maintained 3 bedroom ranch home located in a desirable neighborhood. This property has been well cared for with many updates to include new HVAC system(2020), new roof (2022), new gutters, some new windows & new sliding kitchen door, updated bathroom, updated kitchen, new lighting & ceiling fans, flooring and fresh paint. This property is move in ready! Inside, you will find a functional layout with generous living space, perfect for everyday living and entertaining. The outside offers a spacious backyard with a wooden privacy fence creating your own private entertaining area. The attached garage offers convience along with additional space for recreation. D
Key facts
- New gutters
- New roof
- Updated bathroom
Tags
Property features AI
Finance
- Financial info: Offered for sale
Exterior
- Parking: One-car garage
- Home design: Single-story home; Residential property
- Construction: Brick construction; Slab foundation
- Exterior features: Fenced yard; Storage shed(s)
Interior
- Kitchen: Range; Microwave; Refrigerator
- Bedrooms: Main level bedrooms: two (one 12 x 8, one 12 x 10); Basement bedroom: one (9 x 8)
- Bathrooms: One full bathroom (main level)
- Heating & cooling: Forced air heating; Central air conditioning
- Interior features: Ceiling fan(s); Double-hung vinyl windows
- Laundry & utility: Gas water heater
Neighborhood map
What this means for you Summary
Snapshot
- This is a 3-bed/1.0-bath single-family listed at $190k.
Deal economics
- At list price, monthly cash flow is $6 ($69/yr) — positive.
- The deal already cash-flows at list — no discount required.
- To meet the 1% rule (rent ≥ 1% of price), the offer needs to be $156k (17.8% below list).
- Recommended offer: $156k (17.8% below list) — sets the bar for 1% rule.
- Cap rate 6.3% vs local median 3.8% in Xenia — top-decile yield for the area; either an underpriced asset or a hidden risk that comps aren't pricing in. Stress-test before assuming the spread holds.
Location & tenants
- Location reads 75/100 on livability (#244 in OH, #3,892 nationally) — a middle-class / working-renter tenant base. Strengths: cost of living A+, housing A+, health & safety B+; Watch: amenities D+, commute F, employment F.
- Xenia Community City (suburban): math 42% / reading 53% proficiency, ranked #478 of 656 in OH (top 73%) — families likely to look elsewhere, expect single-tenant / working-renter base with shorter leases.
- Zoned schools: Arrowood Elementary (math 55% / reading 50%, grade C-, #846 of 1,584 statewide, top 54%, 419 students, 0% FRL); Warner Middle School (math 35% / reading 45%, grade F, #511 of 654 statewide, top 79%, 848 students, 0% FRL); Xenia High School (math 25% / reading 63%, grade F, #489 of 781 statewide, top 63%, 985 students, 48% FRL) — zoned schools average 16% FRL vs 50% district-wide (34 pts lower); this property's tenant base skews higher-income than the district average.
- Market conditions: Rents rising fast (+5.5%/yr); 239 active listings in the ZIP; 5 comparable units currently listed for rent nearby; rentals leasing fast (median 5d on market — plan ~1-2 weeks tenant-placement turnaround); solid renter incomes; 797 units permitted in Greene County in 2024 (148 in 5+ unit buildings).
Forward outlook
- Local home prices are declining (-3.0%/yr); year-one equity from $1k of loan paydown is wiped out by about $6k of value loss. Plan a longer hold.
Negotiation context
- It's been on market 50 days — a 3% lower offer ($184k) is reasonable based on typical stale-listing flexibility.
- Current owner paid $82k; list at $190k implies a 132% gain — meaningful room to come down on a strong offer.
Risks & watch-outs
- Climate carrying-cost: major flood risk — expect insurance premiums to compound above CPI over the hold.
Questions for the listing agent
- It's been on market 50 days. Have you received any prior offers? Is the seller open to a 18% concession, seller financing, or rate buy-down credit?
- Built in 1967 — when were the roof, HVAC, electrical panel, plumbing, and water heater last replaced?
- Is there a deadline driving the sale (1031 exchange, divorce, estate, relocation)? That informs how much negotiation room exists.
- The area grade is low — what's the realistic commute time and amenity access for the typical tenant pool here? Any planned neighborhood developments (good or bad) we should know about?
- What's the average days-on-market for RENTAL listings here right now (not sales)? A rising rental-DOM trend means longer vacancies and softer asking-rent achievability than the comps imply.
- What's the recent tenant-quality profile in this submarket — average credit score on applications, eviction rate, late-payment / NSF rate, and stable-employment percentage? A property-management company in the area should have these aggregated.
- How much new for-sale + rental construction is in the pipeline within 1–3 miles? Heavy new supply typically softens prices + rents 12–24 months out; constrained supply supports both.
Investment metrics
- 1% rule
- 0.82% ✗
- Cap rate
- 6.33%
- Cash-on-cash
- 0.13%
- DSCR
- 1.01
- GRM
- 10.1
CMA / ARV
- ARV (median comp)
- $188,689
- List price
- $189,900
- Delta
- 0.64%
- Verdict
- FAIR
- Comps
- 20 within 1.0 mi
Show comp detail 12 sales within ~0.75 mi
| Address | Dist | Beds/Ba | Sqft | Sold | Price | $/sf | Match |
|---|---|---|---|---|---|---|---|
| 1618 Navajo Dr | 0.16mi | 3/1.0 | 999 (+1%) | 7mo | $181,500 | $182 | 86 |
| 1861 Nebraska Dr | 0.22mi | 3/1.0 | 1,015 (+2%) | 1mo | $176,000 | $173 | 85 |
| 1403 Texas Dr | 0.27mi | 3/1.0 | 999 (+1%) | 6mo | $213,000 | $213 | 81 |
| 1778 Arapaho Dr | 0.27mi | 3/1.5 | 1,001 (+1%) | 4mo | $180,000 | $180 | 81 |
| 1772 Maumee Dr | 0.28mi | 3/1.5 | 999 (+1%) | 4mo | $194,000 | $194 | 80 |
| 1769 Gayhart Dr | 0.24mi | 3/1.5 | 1,015 (+2%) | 6mo | $192,500 | $190 | 78 |
| 779 Buckskin Trl | 0.67mi | 3/1.5 | 999 (+1%) | 1mo | $225,000 | $225 | 65 |
| 1392 Chinook Ct | 0.34mi | 3/1.5 | 1,110 (+12%) | 2mo | $228,000 | $205 | 61 |
| 2096 Alabama Dr | 0.45mi | 3/1.5 | 1,127 (+14%) | 2mo | $189,000 | $168 | 52 |
| 1777 Kylemore Dr | 0.56mi | 3/1.0 | 864 (-13%) | 3mo | $165,000 | $191 | 50 |
| 219 Kansas Dr | 0.52mi | 3/1.0 | 1,131 (+14%) | 4mo | $168,500 | $149 | 49 |
| 1362 Arrowhead Trl | 0.67mi | 2/1.0 (-1) | 1,102 (+11%) | 4mo | $185,000 | $168 | 42 |
Match score weights: distance 35% · size 25% · config 20% · recency 20%. Top-matched comps best support the ARV.
Projected returns pro-forma
-3.0% appreciation · 5.48% rent growth · sell at horizon
- IRR
- -13.5%
- Equity multiple
- 0.50×
- Total profit
- $-26,444
- Equity at exit
- $28,315
- IRR
- -1.4%
- Equity multiple
- 0.90×
- Total profit
- $-5,438
- Equity at exit
- $16,419
Cash invested: $53,172 (down + closing). Projections, not guarantees.
Landlord ↔ Tenant lean methodology
- Overall (STATE)
- 73 Landlord-Friendly
- State Ohio
- 73 Landlord-Friendly · R+6
- County
- — inherits STATE
- City
- — inherits STATE
ZIP-level market 45385
- Rents YoY
- 5.5%
- Active inventory
- 239
- Price-to-rent
- 10.1×
Monthly cashflow live
- Estimated rent
- $1,561 high interval (Pro) →
- Mortgage (P&I)
- −$996
- Tax from tax record
- −$153 /mo · $1,832/yr
- Insurance
- −$79
- HOA
- −$0
- Lot rent
- −$0
- Vacancy / Maint / Mgmt
- −$328
- Net cashflow
- $6
Break-even live
Sensitivity live
| Price | -10% $113 | -5% $59 | +0% $6 | +5% $-48 | +10% $-102 |
|---|---|---|---|---|---|
| Rent | -10% $-118 | -5% $-56 | +0% $6 | +5% $67 | +10% $129 |
| Rate | -1.0pp $101 | -0.5pp $54 | base $6 | +0.5pp $-43 | +1.0pp $-94 |
UW: 25.0% down · 7.5% · 30yr · 1.5% tax · 5.0% vac · 8.0% maint · 8.0% mgmt
Financing live
Cash to close
- Down payment
- $47,475
- Closing costs
- $5,697
- Reserves months
- —
- Total cash needed
- —
Loan-product check · same deal, 3 products live
Conventional
25% down · 7.5% · 30yr
- Down + closing
- —
- Monthly P&I
- —
- Monthly cashflow
- —
- DSCR
- —
- Eligible?
- —
Personal DTI + credit; lowest rate.
DSCR
20% down · 8.5% · 30yr
- Down + closing
- —
- Monthly P&I
- —
- Monthly cashflow
- —
- DSCR
- —
- Eligible?
- —
No personal income docs; deal must DSCR.
Hard money
10% down · 12.0% · 12mo
- Down + closing
- —
- Monthly P&I
- —
- Monthly cashflow
- —
- DSCR
- —
- Eligible?
- —
Short-term bridge; refi at stabilization.
Rent comps 5 comps
| Address | Beds | Baths | Sqft | Rent | $/sqft | DOM | Units | Dist |
|---|---|---|---|---|---|---|---|---|
| 216 Kansas Dr Xenia, OH | 3.0 | 2.0 | 1100 | $1,600 | $1.45 | 5d | 1 | 0.53mi |
| 87 Poe Ln Xenia, OH | 3.0 | 1.0 | 912 | $1,400 | $1.54 | 5d | 1 | 1.20mi |
| 1331 Berwald Dr Xenia, OH | 3.0 | 1.0 | 896 | $1,850 | $2.06 | 5d | 1 | 1.35mi |
| 341 Stelton Rd Xenia, OH | 2.0–11.0 | 1.0 | 800 | $910 | $1.14 | 5d | 13 | 1.49mi |
| 451 Cincinnati Ave Xenia, OH | 3.0 | 1.0 | 1024 | $1,275 | $1.25 | 16d | 1 | 1.50mi |
Listing history 21 events
-
2026-06-21statusdays on market $189,900 Pending 50 DOM
-
2026-06-18days on market $189,900 ActiveUnderContract 48 DOM
-
2026-06-17days on market $189,900 ActiveUnderContract 47 DOM
-
2026-06-16days on market $189,900 ActiveUnderContract 46 DOM
-
2026-06-15days on market $189,900 ActiveUnderContract 45 DOM
-
2026-06-14days on market $189,900 ActiveUnderContract 43 DOM
-
2026-06-13days on market $189,900 ActiveUnderContract 42 DOM
-
2026-06-10days on market $189,900 ActiveUnderContract 40 DOM
-
2026-06-09days on market $189,900 ActiveUnderContract 39 DOM
-
2026-06-08days on market $189,900 ActiveUnderContract 38 DOM
-
2026-06-07days on market $189,900 ActiveUnderContract 37 DOM
-
2026-06-05days on market $189,900 ActiveUnderContract 34 DOM
-
2026-06-03days on market $189,900 ActiveUnderContract 33 DOM
-
2026-06-02days on market $189,900 ActiveUnderContract 32 DOM
-
2026-06-01days on market $189,900 ActiveUnderContract 31 DOM
-
2026-05-31days on market $189,900 ActiveUnderContract 30 DOM
-
2026-05-31days on market $189,900 ActiveUnderContract 29 DOM
-
2026-05-13price $194,900 785-char remark
-
2026-04-30$199,900 Active 785-char remark
-
2020-10-05soldstatus $82,000
-
1979-12-03soldstatus $34,900
ⓘ Source: listings_history table (triggers on properties + properties_extension) + one-shot
backfill from property_details.listing_events for pre-trigger history.
Tax reassessment forecast OH · Partial reset (capped growth)
- Current annual tax
- $1,832 · $153/mo
- Projected year-2 tax
- $2,397 · $200/mo
- Expected delta
- +$565/yr (+$47/mo · 30.8%)
ⓘ Screening estimate from a state-policy table — verify with the county assessor before closing.
Climate risk First Street
- Flood 6/10 Major FEMA zone X (unshaded) · 69% chance over 30 yrs
- Wildfire 1/10 Low
- Heat 3/10 Moderate 7 d/yr ≥100°F today · 18 d/yr by 30 yrs out
- Wind 2/10 Low 100% chance of damaging wind over 30 yrs
- Air quality 3/10 Moderate 3 unhealthy d/yr today · 4 by 30 yrs out
Nearby sold comps map
Loading sold comps map…
Walkable amenities ~0.75 mi
Loading nearby amenities…
Taxation est. · year 1
- Rental income
- $18,735
- − Mortgage interest
- −$10,637
- − Property taxes
- −$1,832
- − Insurance
- −$950
- − Repairs & maintenance
- −$1,499
- − Management
- −$1,499
- − Depreciation
- −$5,524
- Taxable loss
- −$3,206
- Est. tax savings @ 24.0%
- +$769
- After-tax cash flow
- $838/yr
For passive investors: Depreciation is non-cash, so a rental often shows a tax loss while cash-flowing — sheltering income. Rental losses are passive: they offset passive income freely, and up to $25,000/yr can offset ordinary (W-2) income if you actively participate and your MAGI is under $100k (phasing out to $0 by $150k); unused losses carry forward. On sale, claimed depreciation is recaptured at up to 25%, and gains may owe capital-gains tax (a 1031 exchange can defer both). Figures are a year-1 estimate at your 24.0% rate — not tax advice; consult a CPA.
Schools (NCES district)
- District
- Xenia Community City
- NCES district ID
- 3904515
- Math proficiency
- 42% ▼ -16.00%
- Reading proficiency
- 53% ▼ -5.00%
- Median HH income
- $46,206
- Composite
- 40.31/100
- National rank
- #3752
- State rank
- #478 of 656 in OH
Livability — Xenia
- Score
- 75/100
- State rank
- #244
- US rank
- #3892
Category grades
Schools grade is shown separately in the Schools card above.
Census & demographics
- Census place
- Xenia, OH
- County
- Greene County · 132,120 people
- City population
- 40,617
- Metro
- Dayton-Kettering, OH
- Population (ZIP)
- 40,617
- Household income
- $76,564
- Rent vs Own
- Severe rent burden
- 906.0
Population outlook (Greene County) Hauer SSP2
- Today (2025)
- 170,301 people
- By 2030
- 171,840 · +0.9%
- By 2040
- 171,408 · +0.7%
- By 2050
- 167,806 · -1.5%
- By 2075
- 154,430 · -9.3%
- By 2100
- 138,669 · -18.6%
Race, ethnicity, and origin ACS 2023
- Neighborhood character
- Predominantly White (83%)
- Race & ethnicity
- White 83% Two or more races 6% Black 6% Hispanic / Latino 2% Asian 2%
- Common ancestry
- Slovak 3% Italian 2% Serbian 1%
- Foreign-born
- 3% · Canada
- Languages at home
- 96% English-only · Other Indo-European 1% Spanish 1%
Political lean MEDSL · Greene
- 2024 margin
- R (+19.8) · D 39.5% · R 59.3% · Other 1.2%
- 2008→2024 swing
- -1.4pp toward R · 2008: -18.4pp · 2024: -19.8pp
- All cycles
- 2024: R+19.8 2020: R+19.5 2016: R+24.5 2012: R+21.8 2008: R+18.4
Not yet ingested
- Civics
- —
Market trends
- HPI YoY
- ▼ -158.15%
- Current HPI
- 239.0473
- Rent YoY
- ▲ 5.48%
- Metro
- Dayton-Kettering, OH
- State GDP YoY
- ▲ 1.98%
- F500 in state
- 48
Industry mix (Fortune 500 HQ in OH)
| Industry | F500 HQs | Revenue |
|---|---|---|
| Insurance | 3 | $145B |
|
||
| Industrial Machinery | 3 | $49B |
|
||
| Financial Services | 3 | $24B |
|
||
| Consumer Goods | 2 | $93B |
|
||
| Aerospace / Defense | 2 | $47B |
|
||
| Utilities | 2 | $33B |
|
||
Price history
+444.1% since first listed6 events — show timeline
- 2026-05-28 Contingent — Dayton MLS
- 2026-05-21 Price Changed $189,900 Dayton MLS
- 2026-05-13 Price Changed $194,900 Dayton MLS
- 2026-04-30 Listed $199,900 Dayton MLS
- 2020-10-05 Sold (Public Records) $82,000 Public Records
- 1979-12-03 Sold (Public Records) $34,900 Public Records
Property tax history
+5.2%/yrLatest (2025): $1,832 · +1.9% YoY. Source: county tax records.
Cash-flow waterfall
monthlySold comps — $/sqft
last 12 mo · ≤1 miLoading sold comps…