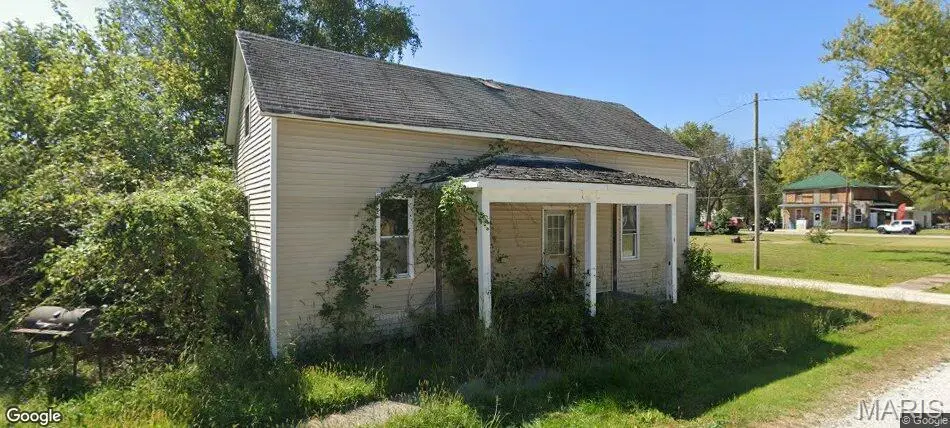
4 W Church St W · Lenzburg, IL
Flood risk 1/10 · Minimal
- FEMA flood zone
- X
- Chance of flooding over 30 yrs
- 0.0%
- Est. flood insurance / yr
- $507 – $1,088
Fire risk 1/10 · Minimal
- Est. fire insurance / yr
- $804 – $1,492
Heat risk 5/10 · Moderate
- Hot days now (above 107°F)
- 7 days/yr
- Hot days in 30 yrs
- 21 days/yr
Wind risk 2/10 · Minimal
- Chance of severe wind over 30 yrs
- 2.0%
Air-quality risk 3/10 · Minor
- Unhealthy air days now
- 2 days/yr
- Unhealthy air days in 30 yrs
- 3 days/yr
Risk factors via First Street. Map © Google.
Why this score? — see what drove the D+ grade
The composite is a weighted blend of 9 inputs, each scored 0–100. Each bar is that input's sub-score; the figure is the points it added to the 100-point composite (weight × sub-score).
- Cash flow +15.0/30.0
- ARV discount +7.5/15.0
- Appreciation +5.2/10.0
- 1% rule +5.0/10.0
- DSCR +5.0/10.0
- Livability +2.6/5.0
- Rent growth +2.5/5.0
- Condition / age +2.5/5.0
- Schools +1.4/10.0
$16,500
🖨 Deal sheet (PDF) 📄 Offer letter ✓ Due diligence
Listing remarks MLS
This Property will be auctioned on Auction.com - please go to the website, register an account and submit your offer(s). SMALL TOWN STABILITY! Estimated as 2BR/1BA in peaceful Lenzburg - 862 sq ft with 1-car garage. Perfect for investors targeting rural markets, contractors seeking projects, BRRRR strategy investors, or first-time multi-property buyers wanting stable community. Exterior showing (curb viewing) only. NO inside showings available, no more inside pictures available. No contingencies will be accepted. Cash sale only. Sold "where is and as is" No Survey or Keys Provided. Interior Access for Home Inspections Will Not Be Granted. Listing Information May Not Be Accurate. Buyers Must Do Their Own Due Diligence to Verify Number of Beds, Baths, Square Footage, Room Sizes, Lot Size & Any Other Property Details. Photos, Marketing Comments, and Due Diligence Items are Provided for Guidance Purposes Only. By Making an Offer on This Property, the Buyer Represents They Have Independently Verified All Information and Have Made the Decision to Make an Offer Based Upon Their Own Investigation.
Key facts
- 6,098 sq ft lot
- Garage
- Built 1900
Neighborhood map
What this means for you Summary
Snapshot
- This is a 2-bed/1.0-bath single-family listed at $16k.
Deal economics
- At list price, monthly cash flow is $567 ($7k/yr) — positive.
- The deal already cash-flows at list — no discount required.
- Meets the 1% rule at list price ($863 rent vs $16k).
- Recommended offer: $15k (12.0% below list) — sets the bar for market timing.
Location & tenants
- Location reads 52/100 on livability (#1,303 in IL) — a working-class tenant base; expect higher turnover. Strengths: cost of living A+, housing A; Watch: employment D, schools F, crime D-.
- Marissa CUSD 40 (rural): math 17% / reading 14% proficiency, ranked #496 of 620 in IL (top 80%) — low school quality limits family demand, transient renter base, plan for 1-2y turnover.
- Market conditions: 3 active listings in the ZIP; 783 units permitted in St. Clair County in 2024 (378 in 5+ unit buildings).
Forward outlook
- In year one you build about $164 of equity ($114 loan paydown + $50 appreciation (0.3% local appreciation)).
- St. Clair County population projected at -23% by 2050 — secular population decline; favor cash flow + early exit over multi-decade hold.
- At projected returns (0.3% appreciation + 3.0% rent growth), your $5k cash investment doubles in ~1 year — after that, you're playing with house money.
Negotiation context
- It's been on market 150 days — a 12% lower offer ($15k) is reasonable based on typical stale-listing flexibility.
Risks & watch-outs
- Watch-outs: built in 1900 — expect roof / HVAC / electrical / plumbing capex.
- Climate carrying-cost: extreme-heat days projected 7→21/yr by 2055 (HVAC capex compounding) — expect insurance premiums to compound above CPI over the hold.
Questions for the listing agent
- It's been on market 150 days. Have you received any prior offers? Is the seller open to a 12% concession, seller financing, or rate buy-down credit?
- Built in 1900 — when were the roof, HVAC, electrical panel, plumbing, and water heater last replaced?
- Why hasn't it sold? Are there any deal-killer items the seller is aware of (foundation, flood, title, zoning, code violations)?
- Is there a deadline driving the sale (1031 exchange, divorce, estate, relocation)? That informs how much negotiation room exists.
- Schools are F-rated, which usually means shorter tenancies and higher turnover. Who's the typical renter profile here, and what's been the actual vacancy rate?
- Crime grade is D in this area — have there been break-ins, vandalism, or insurance claims at this property in the last 3 years? What carrier currently insures it and at what premium?
- The area grade is low — what's the realistic commute time and amenity access for the typical tenant pool here? Any planned neighborhood developments (good or bad) we should know about?
- What's the average days-on-market for RENTAL listings here right now (not sales)? A rising rental-DOM trend means longer vacancies and softer asking-rent achievability than the comps imply.
- What's the recent tenant-quality profile in this submarket — average credit score on applications, eviction rate, late-payment / NSF rate, and stable-employment percentage? A property-management company in the area should have these aggregated.
- How much new for-sale + rental construction is in the pipeline within 1–3 miles? Heavy new supply typically softens prices + rents 12–24 months out; constrained supply supports both.
Investment metrics
- 1% rule
- 5.23% ✓
- Cap rate
- 47.56%
- Cash-on-cash
- 147.39%
- DSCR
- 7.56
- GRM
- 1.6
CMA / ARV
- ARV (median comp)
- $38,537
- List price
- $16,500
- Delta
- -57.18%
- Verdict
- UNDERPRICED
- Comps
- 4 within 1.0 mi
Show comp detail 2 sales within ~0.75 mi
| Address | Dist | Beds/Ba | Sqft | Sold | Price | $/sf | Match |
|---|---|---|---|---|---|---|---|
| 9 E Church St | 0.03mi | 2/1.0 | 809 (-6%) | 9mo | $93,500 | $116 | 81 |
| 200 E Park St | 0.17mi | 3/2.0 (+1) | 800 (-7%) | 15mo | $24,950 | $31 | 59 |
Match score weights: distance 35% · size 25% · config 20% · recency 20%. Top-matched comps best support the ARV.
Projected returns pro-forma
0.3% appreciation · 3.0% rent growth · sell at horizon
- IRR
- —
- Equity multiple
- 8.77×
- Total profit
- $35,906
- Equity at exit
- $5,040
- IRR
- —
- Equity multiple
- 18.38×
- Total profit
- $80,291
- Equity at exit
- $6,262
Cash invested: $4,620 (down + closing). Projections, not guarantees.
Landlord ↔ Tenant lean methodology
- Overall (STATE)
- 43 Moderately Tenant-Leaning
- State Illinois
- 43 Moderately Tenant-Leaning · D+7
- County
- — inherits STATE
- City
- — inherits STATE
ZIP-level market 62255
- Home prices YoY
- 0.3%
- Active inventory
- 3
- Price-to-rent
- 1.6×
Monthly cashflow live
- Estimated rent
- $863 medium interval (Pro) →
- Mortgage (P&I)
- −$87
- Tax est. 1.5%
- −$21 /mo · $248/yr
- Insurance
- −$7
- HOA
- −$0
- Vacancy / Maint / Mgmt
- −$181
- Net cashflow
- $567
Break-even live
Sensitivity live
| Price | -10% $579 | -5% $573 | +0% $567 | +5% $562 | +10% $556 |
|---|---|---|---|---|---|
| Rent | -10% $499 | -5% $533 | +0% $567 | +5% $602 | +10% $636 |
| Rate | -1.0pp $576 | -0.5pp $572 | base $567 | +0.5pp $563 | +1.0pp $559 |
UW: 25.0% down · 7.5% · 30yr · 1.5% tax · 5.0% vac · 8.0% maint · 8.0% mgmt
Financing live
Cash to close
- Down payment
- $4,125
- Closing costs
- $495
- Reserves months
- —
- Total cash needed
- —
Loan-product check · same deal, 3 products live
Conventional
25% down · 7.5% · 30yr
- Down + closing
- —
- Monthly P&I
- —
- Monthly cashflow
- —
- DSCR
- —
- Eligible?
- —
Personal DTI + credit; lowest rate.
DSCR
20% down · 8.5% · 30yr
- Down + closing
- —
- Monthly P&I
- —
- Monthly cashflow
- —
- DSCR
- —
- Eligible?
- —
No personal income docs; deal must DSCR.
Hard money
10% down · 12.0% · 12mo
- Down + closing
- —
- Monthly P&I
- —
- Monthly cashflow
- —
- DSCR
- —
- Eligible?
- —
Short-term bridge; refi at stabilization.
Listing history 18 events
-
2026-06-21days on market $16,500 Active 150 DOM
-
2026-06-21days on market $16,500 Active 149 DOM
-
2026-06-18days on market $16,500 Active 147 DOM
-
2026-06-17days on market $16,500 Active 146 DOM
-
2026-06-16days on market $16,500 Active 145 DOM
-
2026-06-15days on market $16,500 Active 144 DOM
-
2026-06-13days on market $16,500 Active 142 DOM
-
2026-06-12days on market $16,500 Active 141 DOM
-
2026-06-09days on market $16,500 Active 138 DOM
-
2026-06-08days on market $16,500 Active 137 DOM
-
2026-06-07days on market $16,500 Active 136 DOM
-
2026-06-07days on market $16,500 Active 135 DOM
-
2026-06-04days on market $16,500 Active 132 DOM
-
2026-06-02days on market $16,500 Active 131 DOM
-
2026-06-01days on market $16,500 Active 130 DOM
-
2026-05-31days on market $16,500 Active 129 DOM
-
2026-05-31days on market $16,500 Active 128 DOM
-
2026-01-22$16,500 Active 1120-char remark
Show marketing remark (1120 chars)
This Property will be auctioned on Auction.com - please go to the website, register an account and submit your offer(s). SMALL TOWN STABILITY! Estimated as 2BR/1BA in peaceful Lenzburg - 862 sq ft with 1-car garage. Perfect for investors targeting rural markets, contractors seeking projects, BRRRR strategy investors, or first-time multi-property buyers wanting stable community. Exterior showing (curb viewing) only. NO inside showings available, no more inside pictures available. No contingencies will be accepted. Cash sale only. Sold "where is and as is" No Survey or Keys Provided. Interior Access for Home Inspections Will Not Be Granted. Listing Information May Not Be Accurate. Buyers Must Do Their Own Due Diligence to Verify Number of Beds, Baths, Square Footage, Room Sizes, Lot Size & Any Other Property Details. Photos, Marketing Comments, and Due Diligence Items are Provided for Guidance Purposes Only. By Making an Offer on This Property, the Buyer Represents They Have Independently Verified All Information and Have Made the Decision to Make an Offer Based Upon Their Own Investigation.
ⓘ Source: listings_history table (triggers on properties + properties_extension) + one-shot
backfill from property_details.listing_events for pre-trigger history.
Climate risk First Street
- Flood 1/10 Low FEMA zone X · 0% chance over 30 yrs
- Wildfire 1/10 Low
- Heat 5/10 Major 7 d/yr ≥107°F today · 21 d/yr by 30 yrs out
- Wind 2/10 Low 2% chance of damaging wind over 30 yrs
- Air quality 3/10 Moderate 2 unhealthy d/yr today · 3 by 30 yrs out
Nearby sold comps map
Loading sold comps map…
Walkable amenities ~0.75 mi
Loading nearby amenities…
Taxation est. · year 1
- Rental income
- $10,352
- − Mortgage interest
- −$924
- − Property taxes
- −$248
- − Insurance
- −$82
- − Repairs & maintenance
- −$828
- − Management
- −$828
- − Depreciation
- −$480
- Taxable income
- $6,961
- Est. tax owed @ 24.0%
- −$1,671
- After-tax cash flow
- $5,139/yr
For passive investors: Depreciation is non-cash, so a rental often shows a tax loss while cash-flowing — sheltering income. Rental losses are passive: they offset passive income freely, and up to $25,000/yr can offset ordinary (W-2) income if you actively participate and your MAGI is under $100k (phasing out to $0 by $150k); unused losses carry forward. On sale, claimed depreciation is recaptured at up to 25%, and gains may owe capital-gains tax (a 1031 exchange can defer both). Figures are a year-1 estimate at your 24.0% rate — not tax advice; consult a CPA.
Schools (NCES district)
- District
- Marissa CUSD 40
- NCES district ID
- 1724650
- Math proficiency
- 17% ▼ -3.00%
- Reading proficiency
- 14% ▼ -12.00%
- Median HH income
- $49,125
- Composite
- 14.12/100
- National rank
- #9458
- State rank
- #496 of 620 in IL
Livability — Lenzburg
- Score
- 52/100
- State rank
- #1303
- US rank
- #24717
Category grades
Schools grade is shown separately in the Schools card above.
Census & demographics
- Census place
- Lenzburg, IL
- Population (ZIP)
- 1,231
Population outlook (St. Clair County) Hauer SSP2
- Today (2025)
- 250,366 people
- By 2030
- 240,511 · -3.9%
- By 2040
- 217,391 · -13.2%
- By 2050
- 192,699 · -23.0%
- By 2075
- 140,637 · -43.8%
- By 2100
- 100,499 · -59.9%
Race, ethnicity, and origin ACS 2023
- Neighborhood character
- Predominantly White (99%)
- Race & ethnicity
- White 99% Two or more races 1%
- Common ancestry
- Romanian 4% Slovak 4% Lithuanian 2%
- Foreign-born
- 0%
- Languages at home
- 95% English-only · German/W. Germanic 5%
Political lean MEDSL · St. Clair
- 2024 margin
- Lean D (+7.9) · D 53.0% · R 45.1% · Other 1.8%
- 2008→2024 swing
- -14.6pp toward R · 2008: 22.4pp · 2024: 7.9pp
- All cycles
- 2024: D+7.9 2020: D+8.7 2016: D+5.6 2012: D+14.5 2008: D+22.4
Not yet ingested
- Civics
- —
Market trends
- HPI YoY
- ▲ 0.30%
- Current HPI
- 117.8569
- Rent YoY
- —
- Metro
- —
- State GDP YoY
- ▲ 1.59%
- F500 in state
- 60
Industry mix (Fortune 500 HQ in IL)
| Industry | F500 HQs | Revenue |
|---|---|---|
| Insurance | 4 | $201B |
|
||
| Consumer Goods | 4 | $87B |
|
||
| Industrial Machinery | 3 | $64B |
|
||
| Healthcare | 2 | $55B |
|
||
| Retail / Pharmacy | 1 | $148B |
|
||
| Agriculture / Food | 1 | $86B |
|
||
Price history
1 event — show timeline
- 2026-01-22 Listed $16,500 MARIS as Distributed by MLS Grid
Cash-flow waterfall
monthlySold comps — $/sqft
last 12 mo · ≤1 miLoading sold comps…