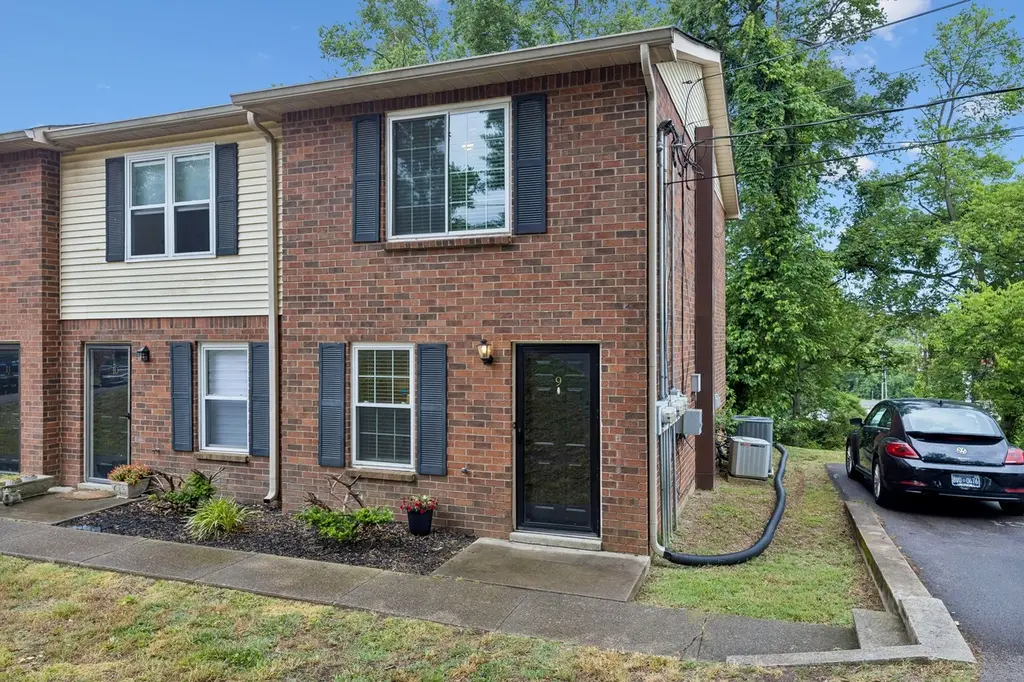
212 Blue Ridge Dr #9 · Green Hill, TN
Flood risk No data
- FEMA flood zone
- —
- Chance of flooding over 30 yrs
- —
- Est. flood insurance / yr
- —
Fire risk No data
- Est. fire insurance / yr
- —
Heat risk No data
- Hot days now (above threshold)
- —
- Hot days in 30 yrs
- —
Wind risk No data
- Chance of severe wind over 30 yrs
- —
Air-quality risk No data
- Unhealthy air days now
- —
- Unhealthy air days in 30 yrs
- —
Risk factors via First Street. Map © Google.
Why this score? — see what drove the D grade
The composite is a weighted blend of 9 inputs, each scored 0–100. Each bar is that input's sub-score; the figure is the points it added to the 100-point composite (weight × sub-score).
- Cash flow +14.0/30.0
- ARV discount +9.6/15.0
- DSCR +4.2/10.0
- Schools +3.8/10.0
- 1% rule +3.4/10.0
- Livability +3.4/5.0
- Rent growth +2.6/5.0
- Condition / age +2.5/5.0
- Appreciation +0.0/10.0
$199,990
🖨 Deal sheet (PDF) 📄 Offer letter ✓ Due diligence
Listing remarks
You can't beat this price in Wilson County! Welcome to this beautifully renovated end unit in Old Hickory. New appliances, cabinets, counters, flooring, light fixtures, windows, doors, water heater, sinks, vanities, HVAC. Located in the highly desirable Wilson County school zone, this home blends modern updates with a warm, inviting feel from the moment you walk in. The half bath and laundry area feature tile flooring, while the rest of the home offers durable LVP flooring throughout. Nearly every major component of the home was replaced in 2020—including the HVAC system, 50-gallon water heater, electrical, and more—giving you the confidence of newer construction with the charm
Key facts
- Private patio
- New appliances
- Tile flooring
Tags
Property features AI
Finance
- Other: Living area approximately 1,050 square feet; Common walls: end unit
- HOA & community: HOA with monthly fee of $125; HOA covers structure maintenance, grounds maintenance, and trash; Condominium/common-interest community; Pets allowed
Exterior
- Parking: Assigned parking; Asphalt parking surface; Two total parking spaces (two open)
- Security: Smoke detectors
- Utilities: Public water; Public sewer; Electricity available
- Home design: Attached townhouse; End unit; Two levels; Renovated
- Construction: Brick and vinyl siding exterior; Shingle roof; Slab foundation; Built/renovated (year listed as renovated)
- Exterior features: Patio; Level lot; Zero lot line
Interior
- Kitchen: Eat-in kitchen (~16x15); Electric oven; Electric range; Dishwasher; Disposal; Microwave; Refrigerator; Stainless steel appliances
- Bedrooms: Two bedrooms (one ~14x13 with extra-large closet; one ~14x10 with extra-large closet)
- Flooring: Carpet; Tile
- Bathrooms: One full bath; One half bath
- Heating & cooling: Central heating (electric); Central air (electric)
- Interior features: Ceiling fans; Extra closets; Pantry; Hot tub
- Laundry & utility: Washer hookup; Electric dryer hookup
Neighborhood map
What this means for you Summary
Snapshot
- This is a 2-bed/2.0-bath townhouse listed at $200k.
Deal economics
- At list price, monthly cash flow is $26 ($314/yr) — positive.
- The deal already cash-flows at list — no discount required.
- To meet the 1% rule (rent ≥ 1% of price), the offer needs to be $168k (15.8% below list).
- Recommended offer: $168k (15.8% below list) — sets the bar for 1% rule.
- Cap rate 6.4% vs local median 3.3% in Green Hill — top-decile yield for the area; either an underpriced asset or a hidden risk that comps aren't pricing in. Stress-test before assuming the spread holds.
Location & tenants
- Location reads 68/100 on livability (#77 in TN) — a middle-class / working-renter tenant base. Strengths: employment A+, housing A+, crime A; Watch: amenities F, commute F, health & safety F.
- Wilson County (rural): math 42% / reading 43% proficiency, ranked #10 of 139 in TN (top 7%) — families likely to look elsewhere, expect single-tenant / working-renter base with shorter leases.
- Zoned schools: W A Wright Elementary (math 65% / reading 52%, grade B-, #67 of 952 statewide, top 7%, 514 students, 0% FRL); Mt. Juliet Middle School (math 41% / reading 36%, grade F, #49 of 333 statewide, top 15%, 1,022 students, 0% FRL); Green Hill High School (math 3% / reading 54%, grade F, #96 of 332 statewide, top 30%, 1,662 students, 0% FRL) — zoned schools average 0% FRL vs 25% district-wide (25 pts lower); this property's tenant base skews higher-income than the district average.
- Market conditions: Rents flat; 255 active listings in the ZIP; 17 comparable units currently listed for rent nearby; rentals at typical pace (median 23d on market — plan ~3-4 weeks tenant-placement turnaround); solid renter incomes; 1,927 units permitted in Wilson County in 2024 (10 in 5+ unit buildings).
Forward outlook
- Local home prices are declining (-3.0%/yr); year-one equity from $1k of loan paydown is wiped out by about $6k of value loss. Plan a longer hold.
- Wilson County population projected at +47% by 2050 — long-run rental-demand tailwind backs the buy-and-hold thesis.
Negotiation context
- Only 2 days on market — expect competitive offers; lowballing is unlikely to land.
- Current owner paid $130k; list at $200k implies a 54% gain — meaningful room to come down on a strong offer.
Questions for the listing agent
- What does the HOA fee cover, when was the last increase, and are there any pending special assessments or reserve-fund shortfalls?
- Is there a deadline driving the sale (1031 exchange, divorce, estate, relocation)? That informs how much negotiation room exists.
- Schools are D-rated, which usually means shorter tenancies and higher turnover. Who's the typical renter profile here, and what's been the actual vacancy rate?
- The area grade is low — what's the realistic commute time and amenity access for the typical tenant pool here? Any planned neighborhood developments (good or bad) we should know about?
- What's the average days-on-market for RENTAL listings here right now (not sales)? A rising rental-DOM trend means longer vacancies and softer asking-rent achievability than the comps imply.
- What's the recent tenant-quality profile in this submarket — average credit score on applications, eviction rate, late-payment / NSF rate, and stable-employment percentage? A property-management company in the area should have these aggregated.
- How much new for-sale + rental construction is in the pipeline within 1–3 miles? Heavy new supply typically softens prices + rents 12–24 months out; constrained supply supports both.
Investment metrics
- 1% rule
- 0.84% ✗
- Cap rate
- 6.45%
- Cash-on-cash
- 0.56%
- DSCR
- 1.02
- GRM
- 9.9
CMA / ARV
- ARV (on-the-fly)
- $210,000
- Comps found
- 4
Show comp detail 4 sales within ~0.75 mi
| Address | Dist | Beds/Ba | Sqft | Sold | Price | $/sf | Match |
|---|---|---|---|---|---|---|---|
| 208 Blue Ridge Dr #2 | 0.02mi | 2/1.5 | 1,050 (0%) | 10mo | $190,000 | $181 | 89 |
| 212 Blue Ridge Dr #10 | 0.00mi | 2/1.5 | 1,050 (0%) | 22mo | $220,000 | $210 | 79 |
| 183 Brooke Castle Dr | 0.73mi | 2/2.0 | 1,073 (+2%) | 7mo | $215,000 | $200 | 56 |
| 190 Brooke Castle Dr | 0.71mi | 2/2.0 | 1,073 (+2%) | 15mo | $200,000 | $186 | 51 |
Match score weights: distance 35% · size 25% · config 20% · recency 20%. Top-matched comps best support the ARV.
Projected returns pro-forma
-3.0% appreciation · 0.3% rent growth · sell at horizon
- IRR
- -18.3%
- Equity multiple
- 0.37×
- Total profit
- $-35,218
- Equity at exit
- $29,819
- IRR
- -16.7%
- Equity multiple
- 0.18×
- Total profit
- $-45,927
- Equity at exit
- $17,291
Cash invested: $55,997 (down + closing). Projections, not guarantees.
Landlord ↔ Tenant lean methodology
- Overall (STATE)
- 87 Strongly Landlord-Friendly
- State Tennessee
- 87 Strongly Landlord-Friendly · R+13
- County
- — inherits STATE
- City
- — inherits STATE
ZIP-level market 37138
- Rents YoY
- 0.3%
- Active inventory
- 255
- Price-to-rent
- 9.9×
Monthly cashflow live
- Estimated rent
- $1,683 high interval (Pro) →
- Mortgage (P&I)
- −$1,049
- Tax from tax record
- −$46 /mo · $558/yr
- Insurance
- −$83
- HOA
- −$125
- Vacancy / Maint / Mgmt
- −$353
- Net cashflow
- $26
Break-even live
Sensitivity live
| Price | -10% $139 | -5% $83 | +0% $26 | +5% $-30 | +10% $-87 |
|---|---|---|---|---|---|
| Rent | -10% $-107 | -5% $-40 | +0% $26 | +5% $93 | +10% $159 |
| Rate | -1.0pp $127 | -0.5pp $77 | base $26 | +0.5pp $-26 | +1.0pp $-78 |
UW: 25.0% down · 7.5% · 30yr · 1.5% tax · 5.0% vac · 8.0% maint · 8.0% mgmt
Financing live
Cash to close
- Down payment
- $49,998
- Closing costs
- $6,000
- Reserves months
- —
- Total cash needed
- —
Loan-product check · same deal, 3 products live
Conventional
25% down · 7.5% · 30yr
- Down + closing
- —
- Monthly P&I
- —
- Monthly cashflow
- —
- DSCR
- —
- Eligible?
- —
Personal DTI + credit; lowest rate.
DSCR
20% down · 8.5% · 30yr
- Down + closing
- —
- Monthly P&I
- —
- Monthly cashflow
- —
- DSCR
- —
- Eligible?
- —
No personal income docs; deal must DSCR.
Hard money
10% down · 12.0% · 12mo
- Down + closing
- —
- Monthly P&I
- —
- Monthly cashflow
- —
- DSCR
- —
- Eligible?
- —
Short-term bridge; refi at stabilization.
Rent comps 17 comps
| Address | Beds | Baths | Sqft | Rent | $/sqft | DOM | Units | Dist |
|---|---|---|---|---|---|---|---|---|
| 4738 Cascade Dr Old Hickory, TN | 2.0 | 1.5 | 1000 | $1,599 | $1.60 | 25d | 1 | 0.46mi |
| 2425 Pleasant Springs Ln Hermitage, TN | 3.0 | 2.0 | 1377 | $2,100 | $1.53 | 25d | 1 | 0.62mi |
| 3032 Thornbury Pl Old Hickory, TN | 2.0 | 2.5 | 1374 | $1,995 | $1.45 | 45d | 1 | 0.64mi |
| 4872 Shasta Dr Old Hickory, TN | 3.0 | 2.0 | 1485 | $2,125 | $1.43 | 25d | 1 | 0.69mi |
| 201 Brooke Castle Dr Unit 1 Hermitage, TN | 2.0 | 2.0 | 1073 | $1,400 | $1.30 | 23d | 1 | 0.69mi |
| 201 Brooke Castle Dr Hermitage, TN | 2.0 | 2.0 | 1073 | $1,400 | $1.30 | 25d | 1 | 0.69mi |
| 4701 Lebanon Pike Hermitage, TN | 1.0–3.0 | 1.0–2.0 | 988 | $1,630 | $1.65 | 3d | 16 | 0.76mi |
| 4701 Lebanon Pike Hermitage, TN | 1.0–3.0 | 1.0–2.0 | 988 | $1,612 | $1.63 | 12d | 8 | 0.76mi |
| 4924 Teton Dr Old Hickory, TN | 3.0 | 1.5 | 1050 | $1,800 | $1.71 | 19d | 1 | 0.76mi |
| 4837 Cascade Dr Unit 2 Old Hickory, TN | 1.0 | 1.0 | 950 | $1,200 | $1.26 | 23d | 1 | 0.78mi |
| 171 Brooke Castle Dr Hermitage, TN | 2.0 | 1.0 | 900 | $1,300 | $1.44 | 9d | 1 | 0.80mi |
| 171 Brooke Castle Dr Unit 1 Hermitage, TN | 2.0 | 1.0 | 862 | $1,300 | $1.51 | 25d | 1 | 0.80mi |
| 143 Brooke Castle Dr Hermitage, TN | 2.0 | 1.0 | 862 | $1,300 | $1.51 | 25d | 1 | 0.87mi |
| 4716 Trenton Dr Hermitage, TN | 2.0 | 1.5 | 912 | $1,246 | $1.37 | 5d | 3 | 0.88mi |
| 111 General Jackson Ln Hermitage, TN | 2.0 | 2.0 | 1000 | $1,250 | $1.25 | 23d | 1 | 0.93mi |
| 1208 Wembley Dr Hermitage, TN | 3.0 | 2.0 | 1336 | $2,245 | $1.68 | 17d | 1 | 1.07mi |
| 735 Tulip Grove Rd Hermitage, TN | 2.0 | 2.5 | 1330 | $1,800 | $1.35 | 16d | 2 | 1.24mi |
HOA detail
- Monthly dues
- $125 · $1,500/yr
- Likely covers
- waterelectric
Listing history 2 events
-
2026-05-21$199,990 Active
-
2019-11-04soldstatus $130,000
ⓘ Source: listings_history table (triggers on properties + properties_extension) + one-shot
backfill from property_details.listing_events for pre-trigger history.
Tax reassessment forecast TN · Resets to sale price
- Current annual tax
- $558 · $46/mo
- Projected year-2 tax
- $1,420 · $118/mo
- Expected delta
- +$862/yr (+$72/mo · 154.5%)
ⓘ Screening estimate from a state-policy table — verify with the county assessor before closing.
Nearby sold comps map
Loading sold comps map…
Walkable amenities ~0.75 mi
Loading nearby amenities…
Taxation est. · year 1
- Rental income
- $20,198
- − Mortgage interest
- −$11,203
- − Property taxes
- −$558
- − Insurance
- −$1,000
- − Repairs & maintenance
- −$1,616
- − Management
- −$1,616
- − HOA
- −$1,500
- − Depreciation
- −$5,818
- Taxable loss
- −$3,112
- Est. tax savings @ 24.0%
- +$747
- After-tax cash flow
- $1,060/yr
For passive investors: Depreciation is non-cash, so a rental often shows a tax loss while cash-flowing — sheltering income. Rental losses are passive: they offset passive income freely, and up to $25,000/yr can offset ordinary (W-2) income if you actively participate and your MAGI is under $100k (phasing out to $0 by $150k); unused losses carry forward. On sale, claimed depreciation is recaptured at up to 25%, and gains may owe capital-gains tax (a 1031 exchange can defer both). Figures are a year-1 estimate at your 24.0% rate — not tax advice; consult a CPA.
Schools (NCES district)
- District
- Wilson County
- NCES district ID
- 4704550
- Math proficiency
- 42% ▼ -11.00%
- Reading proficiency
- 43% ▼ -4.00%
- Median HH income
- $68,429
- Composite
- 38.33/100
- National rank
- #4225
- State rank
- #10 of 139 in TN
Livability — Green Hill
- Score
- 68/100
- State rank
- #77
- US rank
- #9078
Category grades
Schools grade is shown separately in the Schools card above.
Census & demographics
- Census place
- Green Hill, TN
- County
- Davidson County · 680,067 people
- Metro
- Nashville-Davidson--Murfreesboro--Franklin, TN
- Population (ZIP)
- 22,575
- Household income
- $85,149
- Rent vs Own
- Severe rent burden
- 530.0
Population outlook (Wilson County) Hauer SSP2
- Today (2025)
- 160,409 people
- By 2030
- 176,099 · +9.8%
- By 2040
- 206,769 · +28.9%
- By 2050
- 235,383 · +46.7%
- By 2075
- 302,144 · +88.4%
- By 2100
- 343,710 · +114.3%
Race, ethnicity, and origin ACS 2023
- Neighborhood character
- Predominantly White (80%)
- Race & ethnicity
- White 80% Black 10% Hispanic / Latino 6% Two or more races 5% Asian 1%
- Hispanic origin (detail)
- Common ancestry
- Slovak 3% Italian 2% Romanian 2%
- Foreign-born
- 4% · Canada
- Languages at home
- 94% English-only · Spanish 3% Arabic 1% Other Asian/Pacific 1%
Political lean MEDSL · Wilson
- 2024 margin
- Solid R (+40.1) · D 29.4% · R 69.4% · Other 1.2%
- 2008→2024 swing
- -3.5pp toward R · 2008: -36.6pp · 2024: -40.1pp
- All cycles
- 2024: R+40.1 2020: R+37.7 2016: R+44.3 2012: R+41.6 2008: R+36.6
Not yet ingested
- Civics
- —
Market trends
- HPI YoY
- ▼ -267.63%
- Current HPI
- 283.6234
- Rent YoY
- ▲ 0.30%
- Metro
- Nashville-Davidson--Murfreesboro--Franklin, TN
- State GDP YoY
- ▲ 2.78%
- F500 in state
- 22
Industry mix (Fortune 500 HQ in TN)
| Industry | F500 HQs | Revenue |
|---|---|---|
| Healthcare | 3 | $91B |
|
||
| Retail | 3 | $72B |
|
||
| Transportation / Logistics | 1 | $88B |
|
||
| Paper / Packaging | 1 | $19B |
|
||
| Insurance | 1 | $13B |
|
||
| Energy | 1 | $12B |
|
||
Price history
+53.8% since first listed2 events — show timeline
- 2026-05-21 Listed $199,990 REALTRACS as Distributed by MLS Grid
- 2019-11-04 Sold (Public Records) $130,000 Public Records
Property tax history
+3.4%/yrLatest (2025): $558 · +0.0% YoY. Source: county tax records.
Cash-flow waterfall
monthlySold comps — $/sqft
last 12 mo · ≤1 miLoading sold comps…