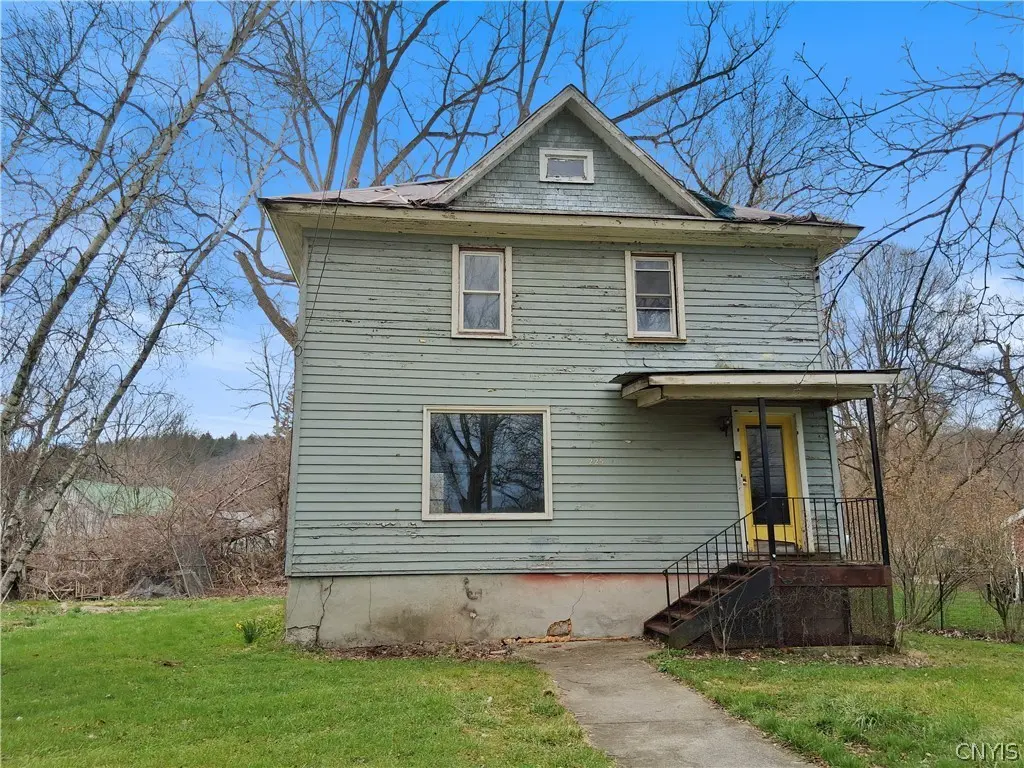
225 Clinton St · Montour Falls, NY
Flood risk 9/10 · Severe
- FEMA flood zone
- X (shaded)
- Chance of flooding over 30 yrs
- 0.99%
- Est. flood insurance / yr
- $473 – $860
Fire risk 2/10 · Minimal
- Est. fire insurance / yr
- $691 – $1,283
Heat risk 3/10 · Minor
- Hot days now (above 94°F)
- 8 days/yr
- Hot days in 30 yrs
- 17 days/yr
Wind risk 1/10 · Minimal
- Chance of severe wind over 30 yrs
- 1.0%
Air-quality risk 1/10 · Minimal
- Unhealthy air days now
- 0 days/yr
- Unhealthy air days in 30 yrs
- 0 days/yr
Risk factors via First Street. Map © Google.
Why this score? — see what drove the B+ grade
The composite is a weighted blend of 9 inputs, each scored 0–100. Each bar is that input's sub-score; the figure is the points it added to the 100-point composite (weight × sub-score).
- Cash flow +30.0/30.0
- 1% rule +10.0/10.0
- DSCR +10.0/10.0
- ARV discount +7.5/15.0
- Appreciation +7.1/10.0
- Schools +4.3/10.0
- Livability +3.2/5.0
- Rent growth +2.5/5.0
- Condition / age +2.5/5.0
$39,900
🖨 Deal sheet (PDF) 📄 Offer letter ✓ Due diligence
Listing remarks MLS
Make this affordable house a premium home. This property offers a fantastic opportunity to increase value with some cosmetic improvements. 3 bedroom 1 bath house is priced under assessment and offers hardwood floors under carpets and 3 bedrooms on the 2nd floor. Don't let this opportunity pass you by. Home is being sold As Is.
Key facts
- Renovated kitchen
- Full basement
- Walk-up attic
Tags
Property features AI
Finance
- HOA & community: Trails/paths nearby
Exterior
- Parking: Detached garage; 1 garage space
- Utilities: Electricity connected; Public water connected; Sewer connected; High-speed internet available; Cable available
- Home design: 2-story house; Resale fixer condition; Waterfront property on Shequaga Creek with river/stream access; Rectangular residential lot (approximately 0.31 acres, 99 x 146) facing a city street; Approximately 100 feet of frontage
- Construction: Frame construction with wood siding; Block and stone foundation; Metal and shingle roof; Existing (not newly built)
- Exterior features: Gravel driveway; Open porch
Interior
- Kitchen: Country-style kitchen
- Bedrooms: Total rooms: 6 (includes living areas and laundry)
- Flooring: Hardwood; Laminate; Varied flooring types
- Bathrooms: 1 full bathroom; 1 half bathroom; One main-level bathroom
- Heating & cooling: Gas forced-air heating
- Interior features: Separate formal dining room; Separate formal living room; Country-style kitchen; Natural woodwork
- Laundry & utility: Laundry located in the basement; Electric water heater
Neighborhood map
What this means for you Summary
Snapshot
- This is a 3-bed/1.0-bath single-family listed at $40k.
Deal economics
- At list price, monthly cash flow is $640 ($8k/yr) — positive.
- The deal already cash-flows at list — no discount required.
- Meets the 1% rule at list price ($1k rent vs $40k).
- Recommended offer: $39k (1.5% below list) — sets the bar for market timing.
Location & tenants
- Location reads 63/100 on livability (#786 in NY) — a middle-class / working-renter tenant base. Strengths: cost of living A+, crime A-, housing B+; Watch: health & safety D, schools F, amenities F.
- Odessa-Montour Central School District (rural): math 41% / reading 60% proficiency, ranked #383 of 590 in NY (top 65%) — acceptable for families but not a draw, mixed tenant base, ~2y average lease.
- Market conditions: 19 active listings in the ZIP; 52 units permitted in Schuyler County in 2024 (0 in 5+ unit buildings).
Forward outlook
- In year one you build about $2k of equity ($276 loan paydown + $2k appreciation (4.2% local appreciation)).
- Schuyler County population projected at -15% by 2050 — secular population decline; favor cash flow + early exit over multi-decade hold.
- At projected returns (4.2% appreciation + 3.0% rent growth), your $11k cash investment doubles in ~2 years — after that, you're playing with house money.
Negotiation context
- It's been on market 17 days — a 2% lower offer ($39k) is reasonable based on typical stale-listing flexibility.
- 3 sale attempts since 16y ago with the ask held roughly flat each time — persistent listings suggest the price (not the market) is what's stuck; bring a comps-based counter.
Risks & watch-outs
- Watch-outs: flood insurance adds $56/mo; built in 1920 — expect roof / HVAC / electrical / plumbing capex.
- Climate carrying-cost: severe flood risk — expect insurance premiums to compound above CPI over the hold.
Questions for the listing agent
- Built in 1920 — when were the roof, HVAC, electrical panel, plumbing, and water heater last replaced?
- What's the actual annual flood-insurance premium (NFIP or private), and is the property in a SFHA with mandatory coverage?
- Is there a deadline driving the sale (1031 exchange, divorce, estate, relocation)? That informs how much negotiation room exists.
- Schools are F-rated, which usually means shorter tenancies and higher turnover. Who's the typical renter profile here, and what's been the actual vacancy rate?
- What's the average days-on-market for RENTAL listings here right now (not sales)? A rising rental-DOM trend means longer vacancies and softer asking-rent achievability than the comps imply.
- What's the recent tenant-quality profile in this submarket — average credit score on applications, eviction rate, late-payment / NSF rate, and stable-employment percentage? A property-management company in the area should have these aggregated.
- How much new for-sale + rental construction is in the pipeline within 1–3 miles? Heavy new supply typically softens prices + rents 12–24 months out; constrained supply supports both.
Investment metrics
- 1% rule
- 3.08% ✓
- Cap rate
- 27.22%
- Cash-on-cash
- 74.76%
- DSCR
- 4.33
- GRM
- 2.7
CMA / ARV
- ARV (median comp)
- $206,673
- List price
- $39,900
- Delta
- -80.69%
- Verdict
- UNDERPRICED
- Comps
- 20 within 1.0 mi
Show comp detail 8 sales within ~0.75 mi
| Address | Dist | Beds/Ba | Sqft | Sold | Price | $/sf | Match |
|---|---|---|---|---|---|---|---|
| 248 Owego St | 0.53mi | 3/2.0 | 1,493 (+0%) | 2mo | $182,000 | $122 | 69 |
| 121 Owego St | 0.32mi | 3/1.5 | 1,388 (-7%) | 3mo | $154,000 | $111 | 69 |
| 406 W Broadway St | 0.36mi | 3/1.5 | 1,586 (+6%) | 3mo | $210,000 | $132 | 68 |
| 231 Tracy St | 0.21mi | 3/1.0 | 1,320 (-12%) | 8mo | $165,000 | $125 | 64 |
| 402 W Broadway St | 0.35mi | 2/1.5 (-1) | 1,440 (-4%) | 10mo | $171,900 | $119 | 62 |
| 315 Genesee St | 0.63mi | 3/1.0 | 1,460 (-2%) | 13mo | $190,426 | $130 | 56 |
| 311 E Main St | 0.39mi | 3/2.5 | 1,610 (+8%) | 15mo | $199,000 | $124 | 50 |
| 126 N L'hommedieu St | 0.60mi | 3/1.5 | 1,400 (-6%) | 17mo | $28,000 | $20 | 46 |
Match score weights: distance 35% · size 25% · config 20% · recency 20%. Top-matched comps best support the ARV.
Projected returns pro-forma
4.16% appreciation · 3.0% rent growth · sell at horizon
- IRR
- 74.5%
- Equity multiple
- 5.31×
- Total profit
- $48,151
- Equity at exit
- $20,603
- IRR
- 73.2%
- Equity multiple
- 10.97×
- Total profit
- $111,387
- Equity at exit
- $33,998
Cash invested: $11,172 (down + closing). Projections, not guarantees.
Landlord ↔ Tenant lean methodology
- Overall (STATE)
- 15 Strongly Tenant-Friendly
- State New York
- 15 Strongly Tenant-Friendly · D+10
- County
- — inherits STATE
- City
- — inherits STATE
ZIP-level market 14865
- Home prices YoY
- 1.6%
- Active inventory
- 19
- Price-to-rent
- 2.7×
Monthly cashflow live
- Estimated rent
- $1,230 medium interval (Pro) →
- Mortgage (P&I)
- −$209
- Tax est. 1.5%
- −$50 /mo · $598/yr
- Insurance
- −$17
- Flood insurance flood zone
- −$56 /mo · $666/yr
- HOA
- −$0
- Vacancy / Maint / Mgmt
- −$258
- Net cashflow
- $640
Break-even live
Sensitivity live
| Price | -10% $668 | -5% $654 | +0% $640 | +5% $627 | +10% $613 |
|---|---|---|---|---|---|
| Rent | -10% $543 | -5% $592 | +0% $640 | +5% $689 | +10% $738 |
| Rate | -1.0pp $661 | -0.5pp $651 | base $640 | +0.5pp $630 | +1.0pp $620 |
UW: 25.0% down · 7.5% · 30yr · 1.5% tax · 5.0% vac · 8.0% maint · 8.0% mgmt
Financing live
Cash to close
- Down payment
- $9,975
- Closing costs
- $1,197
- Reserves months
- —
- Total cash needed
- —
Loan-product check · same deal, 3 products live
Conventional
25% down · 7.5% · 30yr
- Down + closing
- —
- Monthly P&I
- —
- Monthly cashflow
- —
- DSCR
- —
- Eligible?
- —
Personal DTI + credit; lowest rate.
DSCR
20% down · 8.5% · 30yr
- Down + closing
- —
- Monthly P&I
- —
- Monthly cashflow
- —
- DSCR
- —
- Eligible?
- —
No personal income docs; deal must DSCR.
Hard money
10% down · 12.0% · 12mo
- Down + closing
- —
- Monthly P&I
- —
- Monthly cashflow
- —
- DSCR
- —
- Eligible?
- —
Short-term bridge; refi at stabilization.
Listing history 7 events
-
2026-05-11status Pending 860-char remark
-
2026-04-24$39,900 Active 860-char remark
-
2021-04-26historical
-
2021-01-11$77,000
-
2011-07-19soldstatus $52,174
-
2011-07-12soldstatus $52,174
Show marketing remark (328 chars)
Make this affordable house a premium home. This property offers a fantastic opportunity to increase value with some cosmetic improvements. 3 bedroom 1 bath house is priced under assessment and offers hardwood floors under carpets and 3 bedrooms on the 2nd floor. Don't let this opportunity pass you by. Home is being sold As Is.
-
2010-12-16$48,000
Show marketing remark (328 chars)
Make this affordable house a premium home. This property offers a fantastic opportunity to increase value with some cosmetic improvements. 3 bedroom 1 bath house is priced under assessment and offers hardwood floors under carpets and 3 bedrooms on the 2nd floor. Don't let this opportunity pass you by. Home is being sold As Is.
ⓘ Source: listings_history table (triggers on properties + properties_extension) + one-shot
backfill from property_details.listing_events for pre-trigger history.
Climate risk First Street
- Flood 9/10 Extreme FEMA zone X (shaded) · 99% chance over 30 yrs
- Wildfire 2/10 Low
- Heat 3/10 Moderate 8 d/yr ≥94°F today · 17 d/yr by 30 yrs out
- Wind 1/10 Low 100% chance of damaging wind over 30 yrs
- Air quality 1/10 Low 0 unhealthy d/yr today · 0 by 30 yrs out
Nearby sold comps map
Loading sold comps map…
Walkable amenities ~0.75 mi
Loading nearby amenities…
Taxation est. · year 1
- Rental income
- $14,760
- − Mortgage interest
- −$2,235
- − Property taxes
- −$598
- − Insurance
- −$866
- − Repairs & maintenance
- −$1,181
- − Management
- −$1,181
- − Depreciation
- −$1,161
- Taxable income
- $7,538
- Est. tax owed @ 24.0%
- −$1,809
- After-tax cash flow
- $5,876/yr
For passive investors: Depreciation is non-cash, so a rental often shows a tax loss while cash-flowing — sheltering income. Rental losses are passive: they offset passive income freely, and up to $25,000/yr can offset ordinary (W-2) income if you actively participate and your MAGI is under $100k (phasing out to $0 by $150k); unused losses carry forward. On sale, claimed depreciation is recaptured at up to 25%, and gains may owe capital-gains tax (a 1031 exchange can defer both). Figures are a year-1 estimate at your 24.0% rate — not tax advice; consult a CPA.
Schools (NCES district)
- District
- Odessa-Montour Central School District
- NCES district ID
- 3621630
- Math proficiency
- 41% ▼ -8.00%
- Reading proficiency
- 60% ▲ 7.00%
- Median HH income
- $46,720
- Composite
- 42.81/100
- National rank
- #3142
- State rank
- #383 of 590 in NY
Livability — Montour Falls
- Score
- 63/100
- State rank
- #786
- US rank
- #15104
Category grades
Schools grade is shown separately in the Schools card above.
Census & demographics
- Census place
- Montour Falls, NY
- Population (ZIP)
- 2,578
Population outlook (Schuyler County) Hauer SSP2
- Today (2025)
- 17,999 people
- By 2030
- 17,676 · -1.8%
- By 2040
- 16,586 · -7.9%
- By 2050
- 15,322 · -14.9%
- By 2075
- 13,004 · -27.8%
- By 2100
- 10,752 · -40.3%
Race, ethnicity, and origin ACS 2023
- Neighborhood character
- Predominantly White (92%)
- Race & ethnicity
- White 92% Two or more races 6%
- Common ancestry
- Lithuanian 7% Iranian 4% Slovak 3%
- Foreign-born
- 2% · Canada
- Languages at home
- 98% English-only · German/W. Germanic 1%
Political lean MEDSL · Schuyler
- 2024 margin
- Strong R (+21.0) · D 39.5% · R 60.5%
- 2008→2024 swing
- -13.9pp toward R · 2008: -7.1pp · 2024: -21.0pp
- All cycles
- 2024: R+21.0 2020: R+17.6 2016: R+28.7 2012: R+7.9 2008: R+7.1
Not yet ingested
- Civics
- —
Market trends
- HPI YoY
- ▲ 4.16%
- Current HPI
- 263.1314
- Rent YoY
- —
- Metro
- —
- State GDP YoY
- ▲ 2.60%
- F500 in state
- 92
Industry mix (Fortune 500 HQ in NY)
| Industry | F500 HQs | Revenue |
|---|---|---|
| Financial Services | 10 | $950B |
|
||
| Consumer Goods | 9 | $162B |
|
||
| Insurance | 4 | $225B |
|
||
| Telecommunications | 2 | $144B |
|
||
| Pharmaceuticals | 2 | $112B |
|
||
| Media / Entertainment | 2 | $69B |
|
||
Price history
-16.9% since first listed7 events — show timeline
- 2026-05-11 Pending — CNYIS
- 2026-04-24 Listed $39,900 CNYIS
- 2021-04-26 Listing Removed — UNYREIS
- 2021-01-11 Listed $77,000 UNYREIS
- 2011-07-19 Sold (Public Records) $52,174 Public Records
- 2011-07-12 Sold (MLS) $52,174 UNYREIS
- 2010-12-16 Listed $48,000 UNYREIS
Property tax history
+7.1%/yrLatest (2025): $3,838 · +13.0% YoY. Source: county tax records.
Cash-flow waterfall
monthlySold comps — $/sqft
last 12 mo · ≤1 miLoading sold comps…