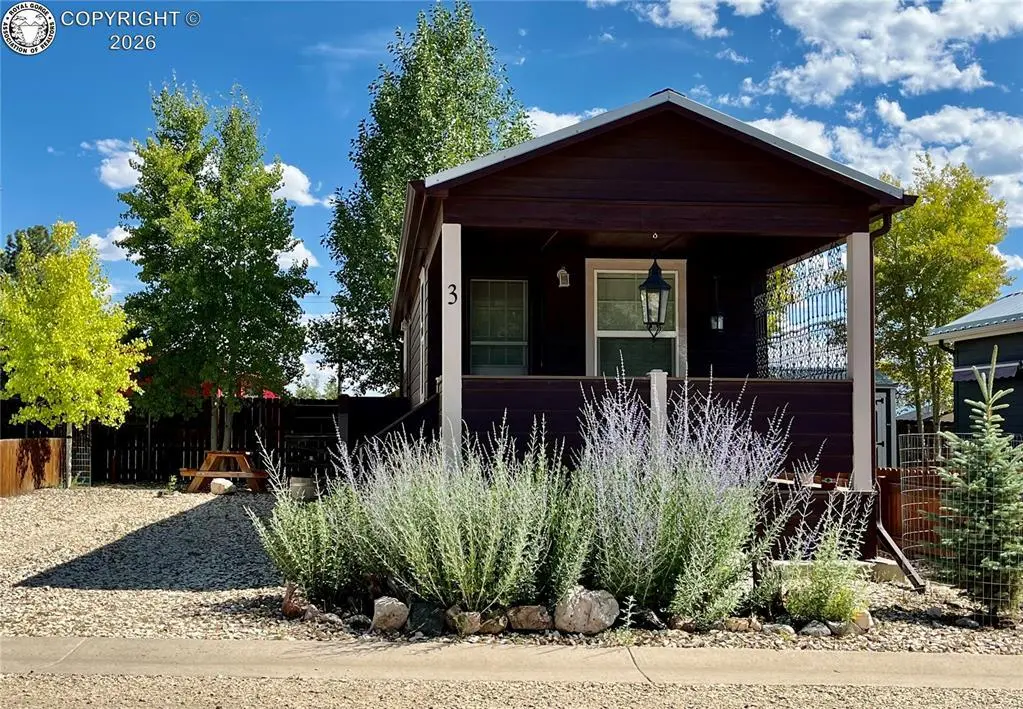
325 E Main St #3 · Silver Cliff, CO
Flood risk 1/10 · Minimal
- FEMA flood zone
- —
- Chance of flooding over 30 yrs
- 0.0%
- Est. flood insurance / yr
- —
Fire risk 5/10 · Moderate
- Est. fire insurance / yr
- $939 – $1,743
Heat risk 1/10 · Minimal
- Hot days now (above 83°F)
- 5 days/yr
- Hot days in 30 yrs
- 15 days/yr
Wind risk 1/10 · Minimal
- Chance of severe wind over 30 yrs
- —
Air-quality risk 1/10 · Minimal
- Unhealthy air days now
- 0 days/yr
- Unhealthy air days in 30 yrs
- 0 days/yr
Risk factors via First Street. Map © Google.
Why this score? — see what drove the C+ grade
The composite is a weighted blend of 9 inputs, each scored 0–100. Each bar is that input's sub-score; the figure is the points it added to the 100-point composite (weight × sub-score).
- Cash flow +18.2/30.0
- ARV discount +15.0/15.0
- 1% rule +10.0/10.0
- DSCR +5.7/10.0
- Schools +3.6/10.0
- Livability +3.0/5.0
- Rent growth +2.5/5.0
- Condition / age +2.2/5.0
- Appreciation +0.0/10.0
$89,999
🖨 Deal sheet 📄 Offer letter ✓ Due diligence
Listing remarks
Nestled in the valley, between the Wet Mountains & breathtaking Sangre de Cristo Mountain range you’ll find this charming, freshly painted 400 + sq foot park home. This home comes with a spacious side yard ready for your enjoyment and barbecue. Unique to this park community - the home sits on a concrete foundation specifically sized, framed, insulated and anchored. Two entry doors lead inside, where you’ll find the kitchen combined with living area, equipped with a full size refrigerator and newer stove. The quaint, back bedroom is fitted with a full closet, washer & dryer. Coziness beams throughout and during those warm summer days, central air conditioning (a speci
Key facts
- Covered front porch
- Walking distance
- Concrete foundation
Tags
Property features AI
Finance
- HOA & community: Homeowners association with a $420 monthly fee
Exterior
- Parking: Gravel driveway
- Utilities: Electricity connected; Propane; Public sewer
- Home design: Single-family residence; Residential property
- Exterior features: Has a view
Interior
- Flooring: Laminate
- Bathrooms: One three-quarter bathroom
- Heating & cooling: Central air conditioning; Forced air heating
- Interior features: Double-pane windows; Laminate flooring
Neighborhood map
What this means for you Summary
Snapshot
- This is a 1-bed/1.0-bath single-family listed at $90k. Condition is rated fair.
Deal economics
- At list price, monthly cash flow is $81 ($978/yr) — positive.
- The deal already cash-flows at list — no discount required.
- Meets the 1% rule at list price ($1k rent vs $90k).
- Recommended offer: $87k (3.0% below list) — sets the bar for market timing.
- Cap rate 7.4% vs local median 2.5% in Silver Cliff — top-decile yield for the area; either an underpriced asset or a hidden risk that comps aren't pricing in. Stress-test before assuming the spread holds.
Location & tenants
- Location reads 60/100 on livability (#253 in CO) — a middle-class / working-renter tenant base. Strengths: cost of living A+, health & safety A+; Watch: housing D, crime F, amenities F.
- Custer County School District Consolidate 1 (rural): math 30% / reading 50% proficiency, ranked #55 of 176 in CO (top 31%) — families likely to look elsewhere, expect single-tenant / working-renter base with shorter leases.
- Zoned schools: Custer County Elementary School (math 30% / reading 34%, grade F, #469 of 966 statewide, top 49%, 165 students, 42% FRL).
- Market conditions: 281 active listings in the ZIP; 117 units permitted in Custer County in 2024 (0 in 5+ unit buildings).
Forward outlook
- Local home prices are declining (-3.0%/yr); year-one equity from $622 of loan paydown is wiped out by about $3k of value loss. Plan a longer hold.
Negotiation context
- It's been on market 50 days — a 3% lower offer ($87k) is reasonable based on typical stale-listing flexibility.
Risks & watch-outs
- Watch-outs: HOA is 30% of rent.
- Climate carrying-cost: moderate wildfire risk — expect insurance premiums to compound above CPI over the hold.
Questions for the listing agent
- It's been on market 50 days. Have you received any prior offers? Is the seller open to a 3% concession, seller financing, or rate buy-down credit?
- Have any recent inspections been done? Can we get a copy of the seller's disclosures and any deferred-maintenance estimates?
- What does the HOA fee cover, when was the last increase, and are there any pending special assessments or reserve-fund shortfalls?
- Is there a deadline driving the sale (1031 exchange, divorce, estate, relocation)? That informs how much negotiation room exists.
- Schools are F-rated, which usually means shorter tenancies and higher turnover. Who's the typical renter profile here, and what's been the actual vacancy rate?
- Crime grade is F in this area — have there been break-ins, vandalism, or insurance claims at this property in the last 3 years? What carrier currently insures it and at what premium?
- What's the average days-on-market for RENTAL listings here right now (not sales)? A rising rental-DOM trend means longer vacancies and softer asking-rent achievability than the comps imply.
- What's the recent tenant-quality profile in this submarket — average credit score on applications, eviction rate, late-payment / NSF rate, and stable-employment percentage? A property-management company in the area should have these aggregated.
- How much new for-sale + rental construction is in the pipeline within 1–3 miles? Heavy new supply typically softens prices + rents 12–24 months out; constrained supply supports both.
Investment metrics
- 1% rule
- 1.58% ✓
- Cap rate
- 7.38%
- Cash-on-cash
- 3.88%
- DSCR
- 1.17
- GRM
- 5.3
CMA / ARV
- ARV (median comp)
- $126,977
- List price
- $89,999
- Delta
- -29.12%
- Verdict
- UNDERPRICED
- Comps
- 5 within 1.0 mi
Show comp detail 3 sales within ~0.75 mi
| Address | Dist | Beds/Ba | Sqft | Sold | Price | $/sf | Match |
|---|---|---|---|---|---|---|---|
| 325 Main St #9 | 0.02mi | 1/1.0 | 420 (0%) | 23mo | $85,000 | $202 | 80 |
| 325 E Main St #20 | 0.00mi | 1/1.0 | 363 (-14%) | 1mo | $88,000 | $242 | 76 |
| 325 Main St #1 | 0.02mi | 1/1.0 | 399 (-5%) | 24mo | $137,900 | $346 | 71 |
Match score weights: distance 35% · size 25% · config 20% · recency 20%. Top-matched comps best support the ARV.
Projected returns pro-forma
-3.0% appreciation · 3.0% rent growth · sell at horizon
- IRR
- -9.9%
- Equity multiple
- 0.64×
- Total profit
- $-9,115
- Equity at exit
- $13,419
- IRR
- -0.1%
- Equity multiple
- 1.00×
- Total profit
- $-119
- Equity at exit
- $7,781
Cash invested: $25,200 (down + closing). Projections, not guarantees.
Landlord ↔ Tenant lean methodology
- Overall (STATE)
- 38 Tenant-Leaning
- State Colorado
- 38 Tenant-Leaning · D+4
- County
- — inherits STATE
- City
- — inherits STATE
ZIP-level market 81252
- Home prices YoY
- -11.3%
- Active inventory
- 281
- Price-to-rent
- 5.3×
Monthly cashflow live
- Estimated rent
- $1,422 medium interval (Pro) →
- Mortgage (P&I)
- −$472
- Tax est. 1.5%
- −$112 /mo · $1,350/yr
- Insurance
- −$37
- HOA
- −$420
- Vacancy / Maint / Mgmt
- −$299
- Net cashflow
- $81
Break-even live
UW: 25.0% down · 7.5% · 30yr · 1.5% tax · 5.0% vac · 8.0% maint · 8.0% mgmt
Financing live
Cash to close
- Down payment
- $22,500
- Closing costs
- $2,700
- Reserves months
- —
- Total cash needed
- —
Loan-product check · same deal, 3 products live
Conventional
25% down · 7.5% · 30yr
- Down + closing
- —
- Monthly P&I
- —
- Monthly cashflow
- —
- DSCR
- —
- Eligible?
- —
Personal DTI + credit; lowest rate.
DSCR
20% down · 8.5% · 30yr
- Down + closing
- —
- Monthly P&I
- —
- Monthly cashflow
- —
- DSCR
- —
- Eligible?
- —
No personal income docs; deal must DSCR.
Hard money
10% down · 12.0% · 12mo
- Down + closing
- —
- Monthly P&I
- —
- Monthly cashflow
- —
- DSCR
- —
- Eligible?
- —
Short-term bridge; refi at stabilization.
HOA detail
- Monthly dues
- $420 · $5,040/yr
Listing history 17 events
-
2026-06-19days on market $89,999 Active 50 DOM
-
2026-06-18days on market $89,999 Active 49 DOM
-
2026-06-17days on market $89,999 Active 48 DOM
-
2026-06-16days on market $89,999 Active 47 DOM
-
2026-06-15days on market $89,999 Active 46 DOM
-
2026-06-14days on market $89,999 Active 44 DOM
-
2026-06-12days on market $89,999 Active 43 DOM
-
2026-06-09days on market $89,999 Active 40 DOM
-
2026-06-08days on market $89,999 Active 39 DOM
-
2026-06-07days on market $89,999 Active 38 DOM
-
2026-06-05days on market $89,999 Active 35 DOM
-
2026-06-03days on market $89,999 Active 34 DOM
-
2026-06-02days on market $89,999 Active 33 DOM
-
2026-06-01days on market $89,999 Active 32 DOM
-
2026-05-31days on market $89,999 Active 31 DOM
-
2026-05-30days on market $89,999 Active 30 DOM
-
2026-04-30$89,999 Active 1848-char remark
ⓘ Source: listings_history table (triggers on properties + properties_extension) + one-shot
backfill from property_details.listing_events for pre-trigger history.
Climate risk First Street
- Flood 1/10 Low 0% chance over 30 yrs
- Wildfire 5/10 Major
- Heat 1/10 Low 5 d/yr ≥83°F today · 15 d/yr by 30 yrs out
- Wind 1/10 Low
- Air quality 1/10 Low 0 unhealthy d/yr today · 0 by 30 yrs out
Nearby sold comps map
Loading sold comps map…
Walkable amenities ~0.75 mi
Loading nearby amenities…
Taxation est. · year 1
- Rental income
- $17,065
- − Mortgage interest
- −$5,041
- − Property taxes
- −$1,350
- − Insurance
- −$450
- − Repairs & maintenance
- −$1,365
- − Management
- −$1,365
- − HOA
- −$5,040
- − Depreciation
- −$2,618
- Taxable loss
- −$165
- Est. tax savings @ 24.0%
- +$40
- After-tax cash flow
- $1,017/yr
For passive investors: Depreciation is non-cash, so a rental often shows a tax loss while cash-flowing — sheltering income. Rental losses are passive: they offset passive income freely, and up to $25,000/yr can offset ordinary (W-2) income if you actively participate and your MAGI is under $100k (phasing out to $0 by $150k); unused losses carry forward. On sale, claimed depreciation is recaptured at up to 25%, and gains may owe capital-gains tax (a 1031 exchange can defer both). Figures are a year-1 estimate at your 24.0% rate — not tax advice; consult a CPA.
Condition & rehab AI · 13 photos
The home is in fair condition with some minor repairs and maintenance needed. Adding paint and landscaping would significantly enhance its value.
Repairs flagged
- Minor Paint — Some wear visible on the walls.
- Minor Landscaping — Sparse landscaping in the fenced yard.
Value-add opportunities
- Both Paint the interior walls and add some landscaping — Both updates will improve the home's curb appeal and interior aesthetics, making it more attractive to potential buyers or renters.
Renovation cost estimate screening
| Repair item | Severity | Est. cost |
|---|---|---|
| Paint · Some wear visible on the walls. | Minor | $500–3,000 |
| Landscaping · Sparse landscaping in the fenced yard. | Minor | $500–3,000 |
| Total estimated repair cost · 2 items | $1,000–6,000 |
Value-add ROI direction
- Both Paint the interior walls and add some landscaping — Both updates will improve the home's curb appeal and interior aesthetics, making it more attractive to potential buyers or renters. ↑
ⓘ Cost ranges are severity-bucket heuristics (US national rule-of-thumb). Get contractor quotes + a written scope before underwriting a rehab budget.
Schools (NCES district)
- District
- Custer County School District Consolidate 1
- NCES district ID
- 0807200
- Math proficiency
- 30% ▬ 0.00%
- Reading proficiency
- 50% ▲ 10.00%
- Median HH income
- $38,757
- Composite
- 35.81/100
- National rank
- #9620
- State rank
- #55 of 176 in CO
Livability — Silver Cliff
- Score
- 60/100
- State rank
- #253
- US rank
- #19303
Category grades
Schools grade is shown separately in the Schools card above.
Census & demographics
- Census place
- Silver Cliff, CO
- City population
- 4,413
- Population (ZIP)
- 4,413
Population outlook (Custer County) Hauer SSP2
- Today (2025)
- 4,686 people
- By 2030
- 4,760 · +1.6%
- By 2040
- 4,743 · +1.2%
- By 2050
- 4,667 · -0.4%
- By 2075
- 4,702 · +0.3%
- By 2100
- 4,569 · -2.5%
Race, ethnicity, and origin ACS 2023
- Neighborhood character
- Predominantly White (93%)
- Race & ethnicity
- White 93% Two or more races 3% Hispanic / Latino 2% Asian 1%
- Common ancestry
- Romanian 4% Italian 3% Lithuanian 3%
- Foreign-born
- 3% · Canada
- Languages at home
- 98% English-only · Spanish 1%
Political lean MEDSL · Custer
- 2024 margin
- Solid R (+36.1) · D 30.7% · R 66.8% · Other 2.5%
- 2008→2024 swing
- -7.2pp toward R · 2008: -28.9pp · 2024: -36.1pp
- All cycles
- 2024: R+36.1 2020: R+37.5 2016: R+41.2 2012: R+33.9 2008: R+28.9
Not yet ingested
- Civics
- —
Market trends
- HPI YoY
- ▼ -32.35%
- Current HPI
- 252.8606
- Rent YoY
- —
- Metro
- —
- State GDP YoY
- ▲ 1.95%
- F500 in state
- 14
Industry mix (Fortune 500 HQ in CO)
| Industry | F500 HQs | Revenue |
|---|---|---|
| Technology Distribution | 1 | $31B |
|
||
| Food / Agriculture | 1 | $18B |
|
||
| Packaging | 1 | $14B |
|
||
| Healthcare | 1 | $13B |
|
||
| Energy | 1 | $10B |
|
||
| Technology | 1 | $4B |
|
||
Price history
1 event — show timeline
- 2026-04-30 Listed $89,999 RGAR
Cash-flow waterfall
monthlySold comps — $/sqft
last 12 mo · ≤1 miLoading sold comps…